
INFORMATION VISUALIZATION OF DRUG REGIMENS
FROM HEALTH MESSAGES
Brant Chee, Richard Berlin and Bruce Schatz
Institute for Genomic Biology, University of Illinois at Urbana-Champaign, 1206 W. Gregory Dr., Urbana IL 61801, U.S.A.
Keywords: Information Visualization, Social Networking, Newsgroup, Personal Health Record, Drug Regimen.
Abstract: The Internet has become a popular venue for people to search for and discuss topics related to health. We
present a method to extract information from informal health message groups to extract social networking
information about the drug regimens people use and the communities people form. We present preliminary
results from a visualization tool enabling health care professionals to create hypotheses about drug regimens
within a particular community. We also present a second visualization tool enabling people in a health
conversational community to find other people who are most similar to them based on the drugs they take.
1 INTRODUCTION
The number of Americans using the Internet has
steadily continued to increase. In an April 2006
study by the Pew Internet and American Life
Project, an estimated 147 million adults or 73% of
the adult population uses the Internet (Madden,
2008). Of those, an estimated 55 million adult
Americans have used the Web to get health or
medical information (Fox and Rainie, 2008). There
is a growing number and variety of health resources
available ranging from dedicated commercial health
websites such as WebMD, to specialized health sites
such as CHFPatients.com, to personal groups found
on Yahoo or IRC. As of May 25, 2008, there were
162,742 health related groups on Yahoo Health
(http://health.dir.groups.yahoo.com). The potential
amount of information and number of messages on
such sites dwarfs the largest repositories of health
literature such as Medline, which contains 17
million citations (http://www.pubmed.org).
We present results from preliminary work that
attempts to utilize the growing amount of patient
information available on the web. This information
often includes personal narratives, a self assessment
of a patient’s own health and drug interaction, much
like a personal health record.
We use information extracted from health
message groups to visualize drug combinations used
to treat the chronic condition Congestive Heart
Failure (CHF). Often multiple drugs are used to treat
the condition (Silver, 2002). Drug combinations are
increasingly common, as seen with the commercial
product BiDil, which is a combination of Isosorbide
dinitrate and hydralazine that has been shown to be
particularly useful in treating CHF in African
Americans (Taylor, 2004). Drug combinations are
hard to determine due to the fact that users may have
multiple doctors prescribing different combinations
of drugs and the change of particular drugs within a
combination over time. Adherence to drug regimens
is a huge concern; patients may change their dosing,
not take all of their medicine due to side effects, or
take additional supplements. This problem is further
compounded since patients are not always truthful
with their doctor due to lack of trust and fear of
shame, they thus often do discuss adherence or drug
combination problems with their doctors (Malterud,
2005).
The goal of this work is to enable a
conversational community for people interested in
discussing and sharing their health experiences.
2 BACKGROUND AND RELATED
Information Visualization is, “the computer-assisted
use of visual processing to gain understanding
(Chittaro, 2001).” Some of the goals of Information
Visualization are to (i) give users a deeper
understanding of data, (ii) encourage the discover of
details and relations which would be difficult to
notice otherwise, and (iii) support the recognition of
282
Chee B., Berlin R. and Schatz B. (2009).
INFORMATION VISUALIZATION OF DRUG REGIMENS FROM HEALTH MESSAGES .
In Proceedings of the International Conference on Health Informatics, pages 282-287
DOI: 10.5220/0001549302820287
Copyright
c
SciTePress

relevant patterns by exploiting the visual recognition
capability of users.
Health and Medical visualizations are the most
closely related work since they deal with the same
type of subject matter. The majority of medical
visualizations deal with such problems as image
acquisition and processing (for example Magnetic
Resonance Imaging scans or Computer Aided
Tomography images) (Chittaro, 2001).
LifeLines (Plaisant, 1998), provides seminal
work in the area of timeline health visualization. It
visualizes a patient’s medical history by providing a
timeline depicting relevant events broken into
various aspects including problems, allergies, lab
pathology, etc. This differs from our visualizations
in several ways. The data used to generate the
visualization is gathered from a patient’s medical
record, not from publicly accessible message board
postings. Secondly instead of a visualization for a
single patient, we are anonymizing patient data and
aggregating it over many people.
The visualization we present in this paper are
aimed not only at medical professions but also the
online community that uses the web to discuss
health related topics. A typical face-to-face patient-
physician encounter is between 15 and 20 minutes
long (Travaline et al., 2005). Often this is an
insufficient amount of time for a physician to go
over all aspects of a patient’s medical history
leading to questions and dissatisfaction when
visiting a physician. 29% of the population who use
the Internet report that not having time with their
doctor is one of the top most frustrating health care
experiences (Taylor and Leitman, 2001).
Of the 55 million Americans that seek health
information on the web, “70% said the Web
information influenced their decision about how to
treat an illness or condition” (Fox and Rainie, 2008).
This is a sizable community to benefit from
visualizations to determine common drug
combinations as well enable people to find similar
other persons to discuss treatment experiences.
PatientsLikeMe is a commercial site that takes
aim at health care social networking. Our work
differs from the site in that we are analyzing existing
messages instead of having users fill out forms.
Completing forms can often be time consuming;
continually updating forms requires the discipline of
routine visits and additions to the form. Our
approach may also alleviate skewed data due to the
Hawthorne effect. It remains to be seen if an
extraction-based approach is as accurate as an
explicit form-based one, such as PatientsLikeMe,
but it better matches the chronic conditions that
dominate healthcare concerns.
It has been shown that support groups are
increasingly important in the treatment of chronic
illness such as CHF (Silver, 2002). Recent studies
have also shown that a person’s social network and
relationships with others are relevant to phenomena
such as smoking cessation and onset of obesity
(Christakis and Fowler, 2007, 2008). Similarly we
believe that the visualization we demonstrate can
help to both provide insight into the social networks
of online message board communities as well as
help to establish closer relationships between users
by finding more similar people who share
experiences through similar drug regimens.
3 IMPLEMENTATION
In this section we present the dataset and
visualization tools. We first explain the dataset used
and the way the data was extracted and prepared for
use in the visualization.
3.1 Data Preparation
Our test corpus consisted of messages extracted
from the CHFpatients website. The CHFpatients site
discusses topics relating to Congestive Heart Failure.
CHF is the leading cause of mortality in the United
States (Berlin and Schatz, 2001). As such there are
numerous resources including newsgroups on the
topic of CHF. However, the CHFpatients website is
unique in that it is a large established website with
many members.
The CHFpatients website archive consists of
10,884 messages dating back to 1999. The messages
are on a variety of topics ranging from advice about
medicine to bereavement over a loved one. This
group is somewhat unique in that the moderator
spell checks and edits the messages for clarity.
Sometimes the moderator will also include
comments at the ends of posts and append links
helping to disambiguate drug names. The editing
and also meticulous data formatting leads to clean
data in which noise, such as names of people, could
be easily removed. It also aided in extracting the link
structure of threads within the newsgroup.
Initially, archived messages were downloaded
from the CHFpatients website using wget. The pages
are html aggregates of individual messages. A parser
was then created to extract individual messages from
the archive. After the individual messages were
extracted, header information containing the name of
INFORMATION VISUALIZATION OF DRUG REGIMENS FROM HEALTH MESSAGES
283
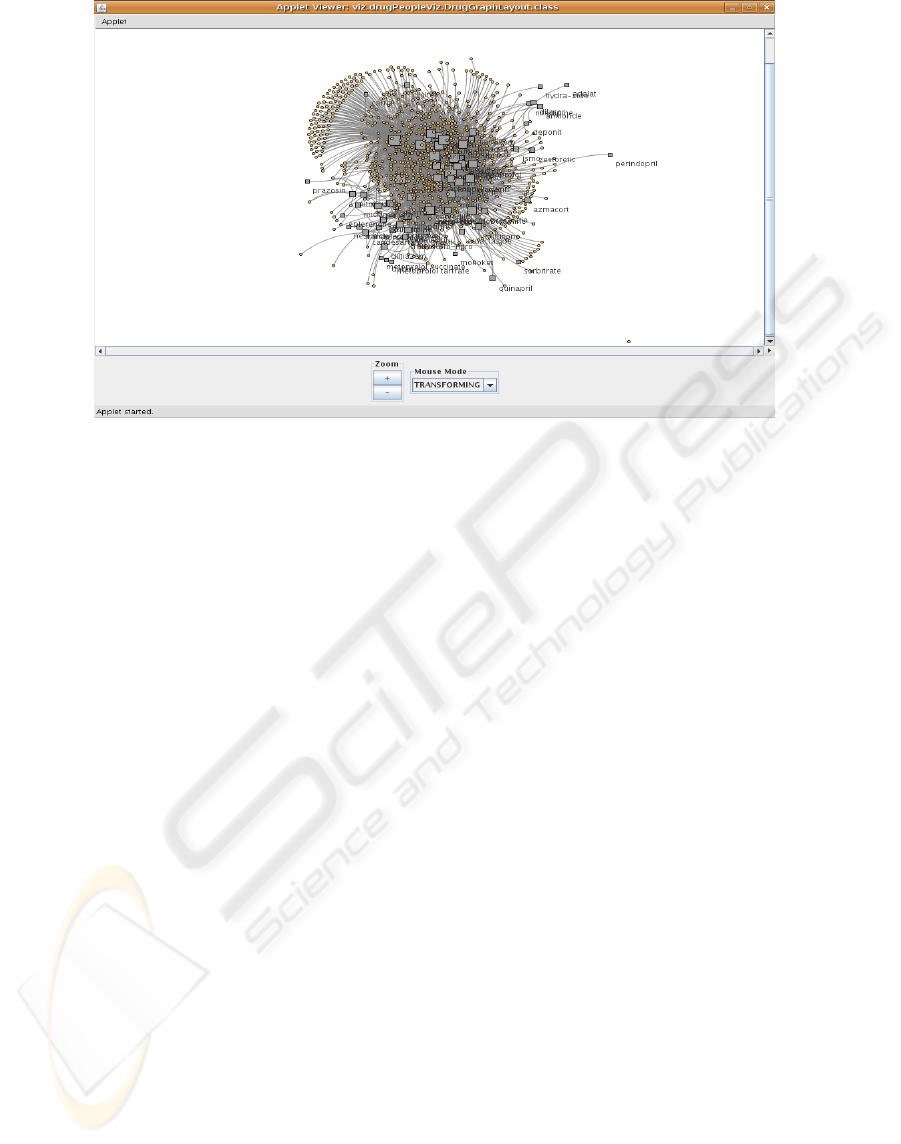
Figure 1: The picture on top depicts the initial Drug-Graph visualization interface for the user.
the person who sent the messages, as well as thread
history was analyzed. This information was used to
generate a stop word list of people names that would
be removed at index time.
The open source information retrieval package
Lucene (http://lucene.apache.org/) was used to
create an index. A Porter stemmer variant was used
to normalize the words. Stemming involves
normalizing words, for example walks, walking, and
walk are all about the same concept, so these terms
would be stemmed to the same term. This removes
some of the variation in the resulting lexicon.
A taxonomy of common CHF drugs was created,
consisting of 214 drugs within several categories,
including: Beta Blockers, ACE Inhibitors, Diuretics,
Vasodilators, Endothelin Blockers, Thrombin
Inhibitors, Phosphodiesterase-III Inhibitors,
Angiotensin II Receptor Antagonist, Calcium
Sensitizer, Cholesterol Lowering Drugs, or Nitrates.
Of these 214 drugs, 75, were found in the
CHFpatients message archive.
3.2 Drug-People Visualization
The goal of the drug-people graph visualization is to
show the interaction between message board
members and drugs. The visualization should not
only lay the resulting graph out in an aesthetically
pleasing manner, but should also convey the
semantics of the drugs and people in the underlying
network. Drugs that are infrequently talked about or
not talked about in conjunction with other drugs
should be placed near the edge of the graph. Drugs
which are highly talked about and/or talked about in
conjunction with other drugs should be placed near
the center of the graph.
A network of drug-people relationships was
extracted. For each drug found in the index, the
person who wrote that message was extracted and
the date of the first instance of mention was created.
Thus, we created nodes of drug names and people.
The edges of the network were people who
mentioned the drug in their message.
It is not assumed that anyone who is on a drug
posts about it, conversely it is also not assumed that
when a person mentions a drug that they are taking
it. However, the people who post about particular
drugs are usually the ones taking them, especially if
they mention or side effects. Many messages are
anecdotes of personal accounts of experiences on
particular drugs. With enough data, trends can be
discovered, even if a small percentage of people are
asking about potential side effects or questions about
taking the drug in the future.
The visualization was created in Java using the
Java Universal Network/Graph Framework (JUNG)
(http://jung.sourceforge.net/). JUNG provides
customizable rending support. In this visualization
people nodes are represented by tan colored circles
and the drug nodes are represented by grey squares.
The different shaped nodes enable users to easily
discern between people and drugs. While the drug
nodes have the drug names beside them, the people
nodes do not, anonymyzing the people who mention
the drugs. The drug nodes also vary in size
depending on the number of people that are
connected to it. This way one can easily discern how
popular a drug is.
HEALTHINF 2009 - International Conference on Health Informatics
284
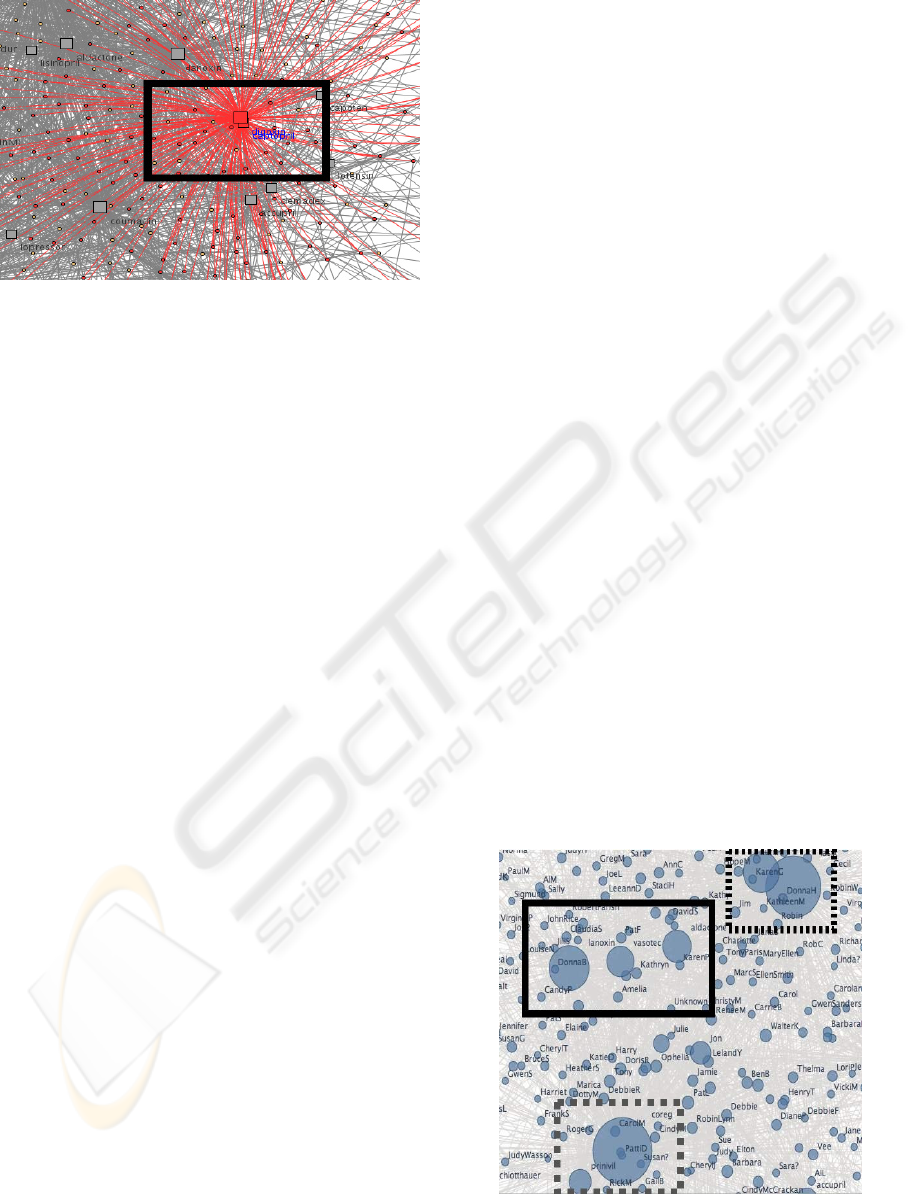
Figure 2: The drugs Captopril and Digoxin enclosed in the
box are hypothesized to be a drug regimen due to
closeness and overlapping neighbours.
Figure 1 depicts the drug-people graph
visualization. The graph is presented in the top
panel. The bottom panel allows users to zoom in and
out of the graph and switch between transforming
and picking modes. Additionally the user can zoom
in and out of the graph using the scroll wheel.
Transforming mode allows the user to translate the
graph and zoom in/out, whereas picking mode
allows the user to select and move nodes.
Selecting a drug highlights the drug, the
neighbouring people nodes, and edges in red. This
can help to show the number of people that take a
given drug. Once nodes are selected they can be
moved for easier exploration of the graph. Multiple
drugs can be selected at a time, or new drugs can be
added to the existing set of drugs by holding down
the control key while selecting a different drug or
using the mouse to create a selection box. By adding
new drugs to a set, one can see the number of people
added to a current set of people by a given drug.
The change in color and amount of new people
nodes that grow by adding another selected drug can
indicate if a drug is part of a regimen.
JUNG provides facilities for several graph layout
algorithms. The goal of a graph layout algorithm is
to preserve node similarities and faithfully represent
the structure of the graph (Gasner et al., 2005). We
chose the FR layout algorithm that “attempts to
produce aesthetically-pleasing, two-dimensional
pictures of graphs by doing simplified simulations of
physical systems. We are concerned with drawing
undirected graphs according to generally accepted
aesthetic criteria: 1. Distribute the vertices evenly in
the frame. 2. Minimize edge crossings. 3. Make edge
lengths uniform. 4. Reflect inherent symmetry. 5.
Conform to the frame. ” (Fruchterman and Reingold,
1991)
4 RESULTS
In this section we present initial results using the
visualization. This is preliminary work as we plan a
user study. Our medical co-author (a hospital
surgeon) validated regimens found in an earlier
version of the drug-people visualization. We present
earlier regimens as well as current visualizations.
The layout algorithm tends to place drugs that
few people talk about near the edge of the screen,
indicating at a glance which drugs have the most
people taking them. The layout algorithm also
places drugs together that are in the same class or
are used interchangeably together in tight clusters,
such as Natrecor and Prinivil (both ACE inhibitors)
or Nitro-Bid, Nitro-Time, Nitro-Par, and Nitro-Dur.
The advantage of the visualizations is that the
groupings of drugs can be found visually. It is
possible that clustering would also group drugs in
the same regimen together, but that is beyond the
scope of this work. This work enables medical
professionals to discern possible drug regimens by
visual inspection. The most discussed drugs are
arranged by size towards the middle of the
visualization, size also indicates their popularity,
which can be a good indicator to a novice within the
community. The number of circular nodes can also
be an easy indicator of the number of people within
the community. The density of grey also indicates
the number of drug by people mentions at a glance.
Three drug regimen hypotheses are listed in
Table 1 and can be viewed in Figure 2. They were
previously located in a prior version of the
visualization and evaluated by our medical co-
author. The previous version of the visualization
did not have differing shapes for drugs and people.
Figure 3: Close up of previous visualization version. The
boxes highlight three possible drug regimen hypothesis.
INFORMATION VISUALIZATION OF DRUG REGIMENS FROM HEALTH MESSAGES
285
This made locating drugs difficult. The people
names were included, which added to difficulty in
finding drugs, as well as privacy concerns.
All three of the hypotheses seem plausible since
the various drugs are different classes of drugs
working on differing systems. An implausible
regimen would be one that consists of drugs in the
same class, i.e. Coreg, Toprol and Zebeta, since they
are all Beta Blockers and interact with the body in
the same way.
The second regimen of three drugs looks
especially good because it consists of Lanoxin and
Aldactone, which are commonly prescribed together.
Lanoxin is toxic if Potassium levels are low, so a
Potassium sparing diuretic such as Aldactone is used
if a diuretic is prescribed as part of a regimen.
In the current version of the visualization another
promising drug combination was found. Digoxin and
Captopril were found close together suggesting that
they are a possible drug combination. Figure 2
depicts the two drugs highlighted in red.
This drug combination is especially good,
because these drugs are overlapping within the
visualization, indicating a high degree in overlap
between the people who take both drugs. The
combination has also been validated because the
drugs have been tested together in a clinical study
(Pitt and Goldstein, 1989).
5 CONCLUSIONS
We have provided results demonstrating that viable
hypotheses about drug regimens can be formed
utilizing visualization of data from patient-specified
clinical notes that are published on the web. The
ability to determine drug regimens empirically from
patient reported data is important due to the fact that
patients often see multiple health care providers that
may not have a clear picture of all drugs a patient is
taking.
This system also demonstrates that hypotheses
can be generated about which drugs are most used
and the most common regimens; some of which may
not be common knowledge.
We envision providing better matching in the
future. However, this means better units of
matching are necessary; currently we are using
words; specifically drug names because they are
from a limited vocabulary that can be manually
developed and have little morphological variation.
Conceptual matching is the next logical step
matching based on semantic concepts not only
words. We would also like to match people based on
attitude towards drugs and other treatment methods
(including surgery, homeopathic methods, etc.)
This preliminary work demonstrates the utility of
information technology applied to health messages.
These techniques allow the investigation of health
information by means not previously envisioned;
vast amounts of data can be analyzed and patterns
can be recognized via interactive visualization.
Although in its infancy, application of
conceptual matching presents a way to search large
amounts of medical information, at first for patterns
of medication use, later for the matching of side-
effects, and lastly for evidence of value and efficacy.
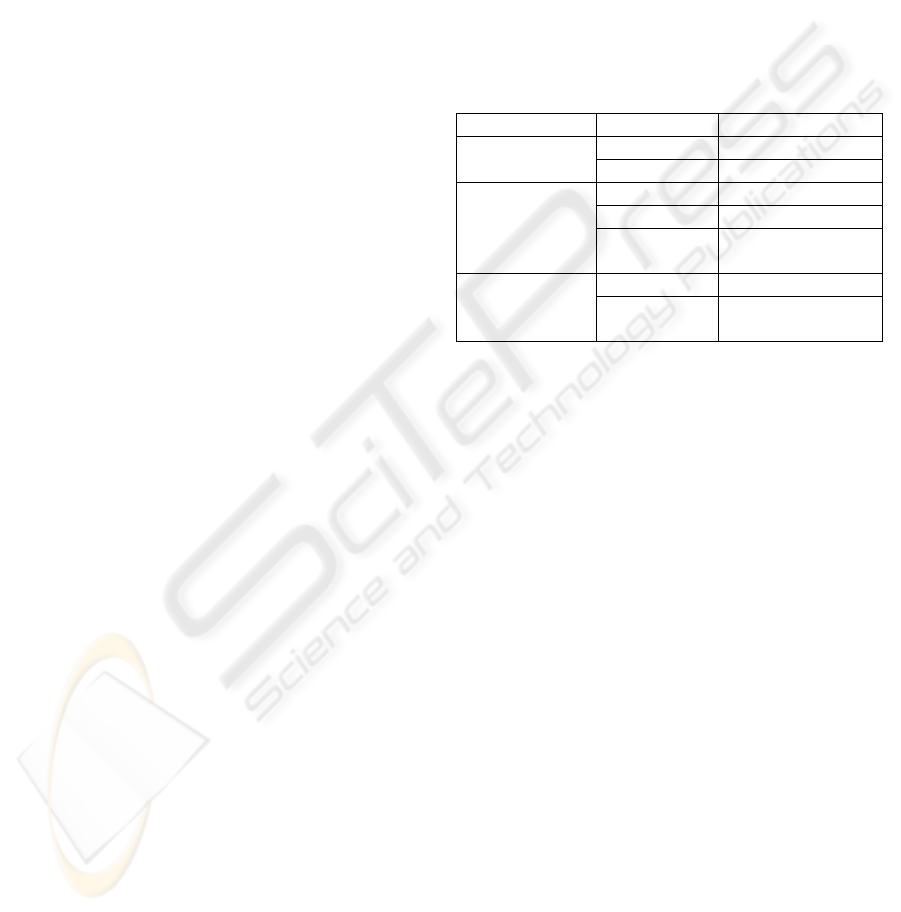
Table 1: Explanation of the drug regimen hypotheses.
Drug Function
Dashed Box Coreg Beta Blocker
Prinivil ACE Inhibitor
Solid Box Lanoxin Digitalis glycoside
Vasotec ACE Inhibitor
Aldactone Potassium sparing
diuretic (water pill)
Grey Dotted
Box
Digoxin Digitalis glycoside
Lasix Loop diuretic
(water pill)
6 FUTURE WORK
We will initially follow up on the current work with
user studies to determine if the visualizations are
useful and what modifications are necessary before
further feature addition. We would like to see the
visualization tools in use by the communities the
messages were derived from.
The end goal would be the development of a
software environment that supports multiple views
and enables users to explore the data in an intuitive
way. The viewer would have the ability to not only
depict multiple views of the network but also allow
users to use various graph layout algorithms, remove
edges based on number of occurrences, and also
incorporate detailed information on a particular
person, side effect or drug.
Further work is necessary in the design of
matching algorithms. We would like to utilize the
clustering algorithm we have developed for fast
segmentation of Small-World social networks to
further help user matching (Chee and Schatz, 2007).
The current system does not incorporate a notion
of outcomes, i.e. what reaction the particular patient
in their particular situation has to the drug regime
identified. We are experimenting in future work
with evaluating the outcome automatically from the
HEALTHINF 2009 - International Conference on Health Informatics
286

tone of the message, a form of affective evaluation
called sentiment analysis.
We have separately developed a health monitor
system, which adaptively chooses questions, based
on the patient’s situational answers, from a thousand
question dataset, covering the full range of lifestyle
conditions. (Sanders, 2008)
See http://www.canis.uiuc.edu/healthmonitor .
The questions in the dataset are more precisely
targeted towards evaluating the patient than the free-
text extracted from their messages. However, the
number of available messages is currently much
larger than the number of answered questions. So
having an outcome measure for drug regimens from
health messages would enable us to extrapolate the
effects of health monitors over large populations.
Making these tools available to the public, could
help foster a sense of community and create
discussion topics. The website could also foster
discussion between doctors and patients, enhancing
medical communication, and between patients and
patients, enhancing social networking.
Application of conceptual matching to massive
amounts of health information is just beginning.
Most health information is not yet in a form to allow
for the ready evaluation of trends and patterns; here
health messages are substituting for detailed
personal health records. One envisions large health
datasets, involving medication follow-up, large-scale
clinical trials, common clinical diagnoses, and other
information analyzed using these techniques.
The nature of health information is going to
change, methods of clinical trials will be re-
evaluated, and population health information will be
placed on a firm informational basis. Despite current
difficulties of tracking information, the use of
conceptual matching will enable analysis of health
information to enter the modern technology world.
REFERENCES
Berlin, R. and Schatz, B., 2001. Monitoring of quality of
life for congestive heart failure populations.
Congestive Heart Failure, 7(1) pp. 13-23.
Chee, B. and Schatz, B., 2007. Document clustering using
small world communities. In Proceedings of the 7th
ACM/IEEE-CS Joint Conference on Digital Libraries
JCDL '07, pp 53-62.
Chittaro, L., 2001. Information visualization and its
application to medicine. Artificial Intelligence in
Medicine, 22(2), pp. 81-88.
Christakis, N., Fowler, J., 2008. Collective dynamics of
smoking behavior. New England Journal of Medicine,
358(21) pp. 2249-2258.
Christakis, N., Fowler, J., 2007. The spread of obesity in a
large social network over 32 years. New England
Journal of Medicine, 357(4):370-379.
Fox, S., Rainie, L., 2008. The online health care
revolution: How the web helps Americans take better
care of themselves. The Pew Internet & American Life
Project. http://www.pewinternet.org accessed, March
10, 2008.
Gasner, E., Koren, Y. North, S. 2005. Graph drawing by
stress majorization. Lec. Notes in Computer Science.
2005 Feb, 3383/2005 pp. 239-250.
Fruchterman, T.M.J., Reingold, E., 1991. Graph drawing
by force-directed placement. Software-Practice and
Experience, 21(11) pp. 1129-1164.
Madden M., 2008. Internet penetration and impact. The
Pew Internet & American Life Project.
http://www.pewinternet.org accessed, March 2008.
Malterud, K., 2005. Humiliation instead of care? The
Lancet, 366 pp. 785-766.
Pitt, B., Goldstein, S., 1989. The captopril-digoxin
multicenter research group study on the comparative
steps of captopril and digoxin in patients with mild-
moderate heart failure: Implications for therapy.
Cardiovascular Drugs and Therapy, 3 pp. 7-9.
Plaisant, C., Mushlin, R., Snyder, A., Li, J., Heller, D.,
Shneiderman, B., 1998. LifeLines: Using
visualization to enhance navigation and analysis of
patient records. In Proc American Medical Informatics
Association Annual Fall Symposium, AMIA, pp. 76-
80.
Sanders, B., Berlin, R., Schatz, B., 2008. Adaptive
Question Asking for Population Health Monitoring, In
Proc American Medical Informatics Association
Annual Fall Symposium, AMIA, submitted.
Silver, M., 2002. Success with Heart Failure, Perseus
Publishing, Cambridge, MA, 2002.
Taylor, A., Ziesche, S., Yancy, C., Carson, P., D'Agostino,
R., Kerdinand, K., Taylor, M., Adams, K., Sabolinski,
M., Worcel, M., Cohn, J.N., 2004. African-American
heart failure trial investigators. Combination of
isosorbide dinitrate and hydralazine in blacks with
heart failure. New England Journal of Medicine,
351(20) pp. 2049-57.
Taylor, H., Leitman, R., 2001. Study reveals big potential
for the internet to improve doctor-patient relations.
Health Care News; Harris Interactive, 1(1) pp. 1-3.
Travaline, J., Ruchinskas, R., D’Alonzo, G.E., 2005.
Patient-physician communication: Why and how.
JAOA, 105(1) pp. 13-18.
INFORMATION VISUALIZATION OF DRUG REGIMENS FROM HEALTH MESSAGES
287
