ECG-BASED AUTHENTICATION
Bayesian vs. Nearest Neighbour Classifiers
Carla Oliveira and Ana Fred
Instituto de Telecomunicações, Instituto Superior Técnico, Tech. University of Lisbon, Lisbon, Portugal
Keywords: Bayesian, Biometric authentication, ECG, MAP, One-Class, 1-NN.
Abstract: This paper presents an approach for human authentication based on electrocardiogram (ECG) waveforms.
ECG data was collected from 24 individuals during the realization of cognitive tests, where subjects held a
surface mount triode placed on the V2 pre cordial derivation. Authentication is based on MAP, One-Class
and 1-NN classifiers. Results show that ECG-based authentication may be a feasible tool for biometric
systems. The One-Class classifier with class normalization has presented enhanced performance, with an
equal error rate of 3.5%.
1 INTRODUCTION
Biometric authentication is a promising tool for
security applications, attesting that the user of a
system is who he claims to be through the use of
some of its physical or behaviour characteristics
(e.g., a fingerprint). Recent work, (Biel et al., 2001)
and (Israel et al., 2005), suggests that the human
heartbeat is a characteristic that can be used in
biometric authentication schemes, as it exhibits
features that are unique to an individual.
Electrocardiogram (ECG) is the typical method to
measure heartbeat, being extensively used in
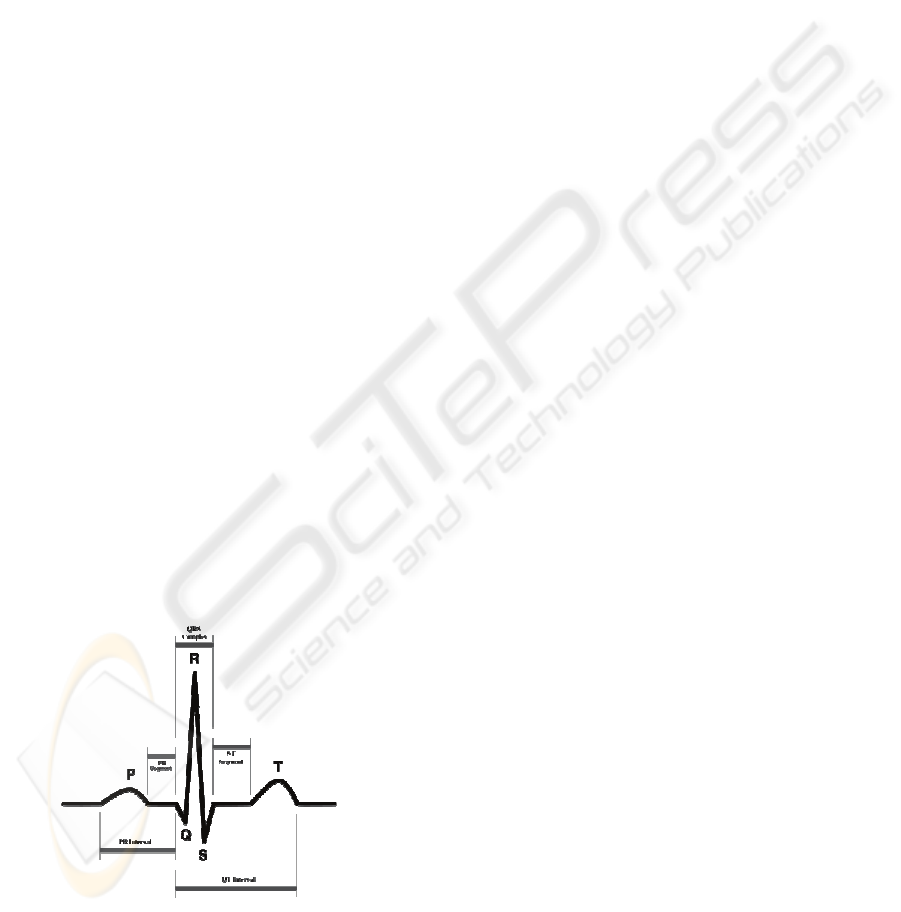
medicine. Figure 1 illustrates a typical ECG trace.
Figure 1: A typical heartbeat waveform (adapted from
(Wikipedia, 2008)). The R R interval indicates the
duration of a heartbeat. P, QRS, and T indicate the major
ECG complexes comprising one heartbeat.
Some feasibility studies on the potential of ECG
for biometrical applications are found in the
literature. For example, in the identification scheme
presented in (Wübbeler et al., 2007), authors use 234
ECG recordings of 10 s length, obtained during
several months up to several years. Records were
taken from 74 subjects in a supine position in a
resting state, from the three Einthoven leads.
Classification is based on the heart vector and a
simple distance measure, standard nearest
neighbour, and threshold schemes being used. For
verification, an error rate of 2.8% was achieved;
while a rate of 98.1% was obtained for
identification. Other study is presented in (Chan et
al., 2008), where ECG data was collected from 50
subjects during 3 sessions on different days, from
two electrodes on the pads of their thumbs using
their thumb and index fingers. Classification was
performed using percent residual difference,
correlation coefficient, and a novel distance measure
based on wavelet transform. The wavelet distance
measure has a classification accuracy of 89%,
outperforming the other methods by nearly 10%.
In this work we have addressed the problem of
user authentication from ECG records using a single
lead montage, while the subjects were performing
cognitive tests on a computer. Classification is based
on two Bayesian classifiers, the maximum a
posteriori (MAP) (Duda et al., 2001) and the
One-Class (Tax, 2001) classifiers, and also on a
distance based method, the 1-Nearest Neighbour
(1-NN) (Duda et al., 2001) classifier. The MAP
163
Oliveira C. and Fred A. (2009).
ECG-BASED AUTHENTICATION - Bayesian vs. Nearest Neighbour Classifiers .
In Proceedings of the International Conference on Bio-inspired Systems and Signal Processing, pages 163-168
DOI: 10.5220/0001549901630168
Copyright
c
SciTePress

classifier assigns an object x to the class k with the
largest a posteriori probability p(ω
k
|x). In One-Class
classification only p(x|ω
k
), the probability density of
the target class, ω
k
, is known. Estimating the
probability density from the training data and given
a threshold, the classifier accepts or rejects the test
samples. The 1-NN classifier assigns an object x to
its nearest class, with closeness measured by the
Euclidean distance between the vectors of inputs.
This paper is composed of 4 sections, besides the
current one. The next section presents the data
acquisition system from which ECG records were
obtained. Section 3 describes the authentication
system, detailing the implementation of the
classifiers. An overview and discussion of results is
provided in Section 4. Section 5 finalises the paper,
drawing the main conclusions.
2 DATA ACQUISITION AND
PROCESSING
The ECG data analysed in this work was acquired
within the scope of the HiMotion Project (HiMotion,
2008). The HiMotion Project consisted on the
design, implementation and administration of a set
of computer based experiments with cognitive tests
related to memory, concentration, association,
intelligence and insight (discovery). The underlining
idea is that these activities produce noticeable
changes in the physiological characteristics of
subjects, which, on one hand, are task dependent,
and therefore global task-related dynamics/features
can be recognized, and, on the other hand, individual
behavioural traits may be present in the acquired
data, and thus contribute for human authentication.
A set of physiologic signals was continuously
acquired during the realization of the tests:
electrodermal activity, blood volume pressure,
electroencephalography and ECG. A population of
24 male and female volunteers, with a mean age of
23.4±2.5 years, was asked to complete the series of
tests in individual sessions, designed to take, in
average, 30 minutes.
ECG measurements were taken using a surface
mount triode placed on the V2 pre-cordial
derivation. Each heartbeat waveform was
sequentially segmented from the full recording, and
then all individual waveforms were aligned by their
R peaks in segments of equal temporal length. The
mean wave for groups of 10 heartbeat waveforms
(without overlapping), was computed to minimize
the effect of outliers. A labelled database composed
by 137 samples was compiled, in which each pattern
corresponds to a mean wave. For each mean
waveform (Figure 1), the latency and amplitude for
each of the P QRS T peaks were extracted, along
with a sub sampling of the waveform itself,
providing a feature representation space of 53
features. In this work, only the latencies and
amplitudes of P, Q, S and T complexes were used,
resulting in 8 features, Table 1.
Table 1: Description of features.
Feature Description
1 Latency of P complex
2 Latency of Q complex
3 Latency of S complex
4 Latency of T complex
5 Amplitude of P complex
6 Amplitude of Q complex
7 Amplitude of S complex
8 Amplitude of T complex
Concluding, the available ECG data comprises
24 classes (each corresponding to each one of the
subjects under test) and 8 features.
3 AUTHENTICATION SYSTEM
The purpose of ECG-based authentication systems is
to attest that the user of a system is who he claims to
be, through the monitoring of its ECG records. In
this work, three classifiers were implemented using
Matlab (Matlab, 2007): MAP classifier, One-Class
classifier and 1-NN classifier.
The MAP classifier algorithm was constructed as
follows. Two mutually exclusive sub-sets from the
137 sample set are created, with 1 pattern for test
and the remaining 136 for training (“leave-one-out”
method). Then, density of the training data, p(x|ω
k
),
is estimated according to a maximum likelihood
technique later explained. p(ω
k
|x) is subsequently
computed for each test sample according to (1) and
the classifier decides on accepting test samples if (2)
is verified. This process is repeated for all the 137
samples. It is important to state that a Naive Bayes
model is considered for used features, thus assuming
statistical independence between them, (3). Also,
classes are assumed to be equiprobable, (4).
24
1
(| )( ) (| )( )
(|)
()
(| )( )
kk kk
k
ii
i
px p px p
px
px
px p
ω
ωωω
ω
ω
ω
=
==
∑
(1)
(|)
k
px
ω
λ
>
(2)
BIOSIGNALS 2009 - International Conference on Bio-inspired Systems and Signal Processing
164
88
11
(| ) ( | ) ( , )
j
jj
kkkk
jj
px px N
ω
ωμσ
==
==
∏∏
(3)
1
() ( )
24
ik
pp
ωω
==
(4)
For the One-Class classifier, a similar algorithm
was adopted. The algorithm starts to estimate the
distribution of training data. Then, the probability
density of the target class, p(x|ω
k
), is estimated and
normalized within a factor F
class
, which is the
maximum value within each class, (5). Afterwards,
given a threshold λ, the classifier accepts the test
samples included in the acceptance region defined
by threshold according to (6). This process is
repeated for all the 137 samples. For comparison
purposes, another version of the One-Class classifier
was implemented, using a different normalization
factor, F
all
, which is the maximum p(x|ω
k
) value
found over all classes, (7).
max( ( | ))
class k
Fpx
ω
=
(5)
(| )
k
px
ω
λ
>
(6)
max ( ( | ))
all k k
Fpx
ω
=
(7)
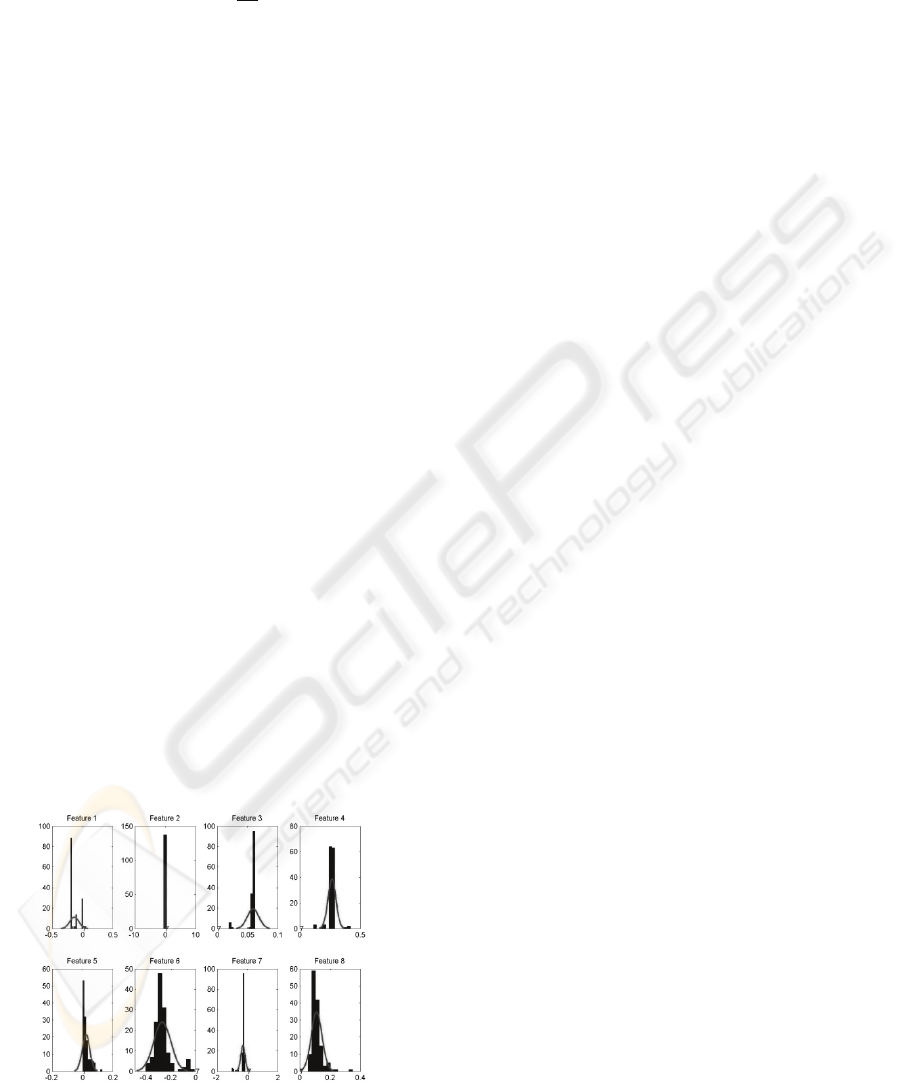
Note that, regarding these two Bayesian
classifiers, the density model of the training data was
estimated based on its histogram plots, Figure 2. A
Gaussian distribution, with mean µ and variance σ
2
,
was assumed for each feature. It is important to state
that this is a simplistic approach (e.g., feature 2 in
Figure 2 is a Dirac function), with implicit
drawbacks on the performance of the authentication
system. A mixture of Gaussians will probably
provide refined results, but has the additional
complexity drawback.
Figure 2: Histogram plots for subject id 10.
The 1-NN classifier algorithm starts to compute
and store the Euclidean distances between all data
samples, and then normalizes the computed values
to F
dis
, which is the maximum distance found
between two samples x
a
and x
b
, (8). After the
creation of training and test sets, the minimum
distances for the training set within each class are
found and classification is based on that. Test
samples are accepted if (9) is verified. This process
is repeated 137 times, one per sample.
max( ( , ))
dis a b
Fdxx
=
(8)
min
(| )
k
dx
ω
λ
<
(9)
4 RESULTS AND DISCUSSION
In what concerns the MAP classifier, the confusion
matrix (average values obtained for the 137 runs) is
presented in Figure 3. It is clear from this figure that
test samples from different individuals are extremely
uncorrelated, thus being correctly classified. About
60% of the test samples achieve p(ω
k
|x) > 0.85. In
Figure 4 and Figure 5 one may observe the average
Receiving Operating Characteristic (ROC) and the
False Acceptance Rate (FAR) / False Rejection Rate
(FRR) curves, respectively, for the 137 runs. It is
observed that FAR and FRR are dependant on the
adjustable chosen threshold. If the threshold value is
increased, FAR decreases, while FRR increases.
When the value of threshold is decreased, the
proportion FRR will decrease, while FAR increases.
FAR lies between 5% and 17%, while FRR achieves
values between 4% and 9%. The equal error rate
(EER) occurs for λ ~ 2.6E-04, corresponding to
FAR=FRR=7%. For this value of the threshold,
FAR and FRR values were analysed within each
class (see Figure 6). It is observed that classes 1, 18
and 22 present the worst results. In order to
determine EER within each class, the respective
FAR and FRR values were computed. Table 2
presents the λ
k
values corresponding to the EER for
each class k. An average EER of 5.9% was
estimated, being lower to the one obtained for the
MAP classifier with a global threshold. Thus, one
concludes that specific thresholds per class will
enhance the performance of the classifier.
ECG-BASED AUTHENTICATION - Bayesian vs. Nearest Neighbour Classifiers
165
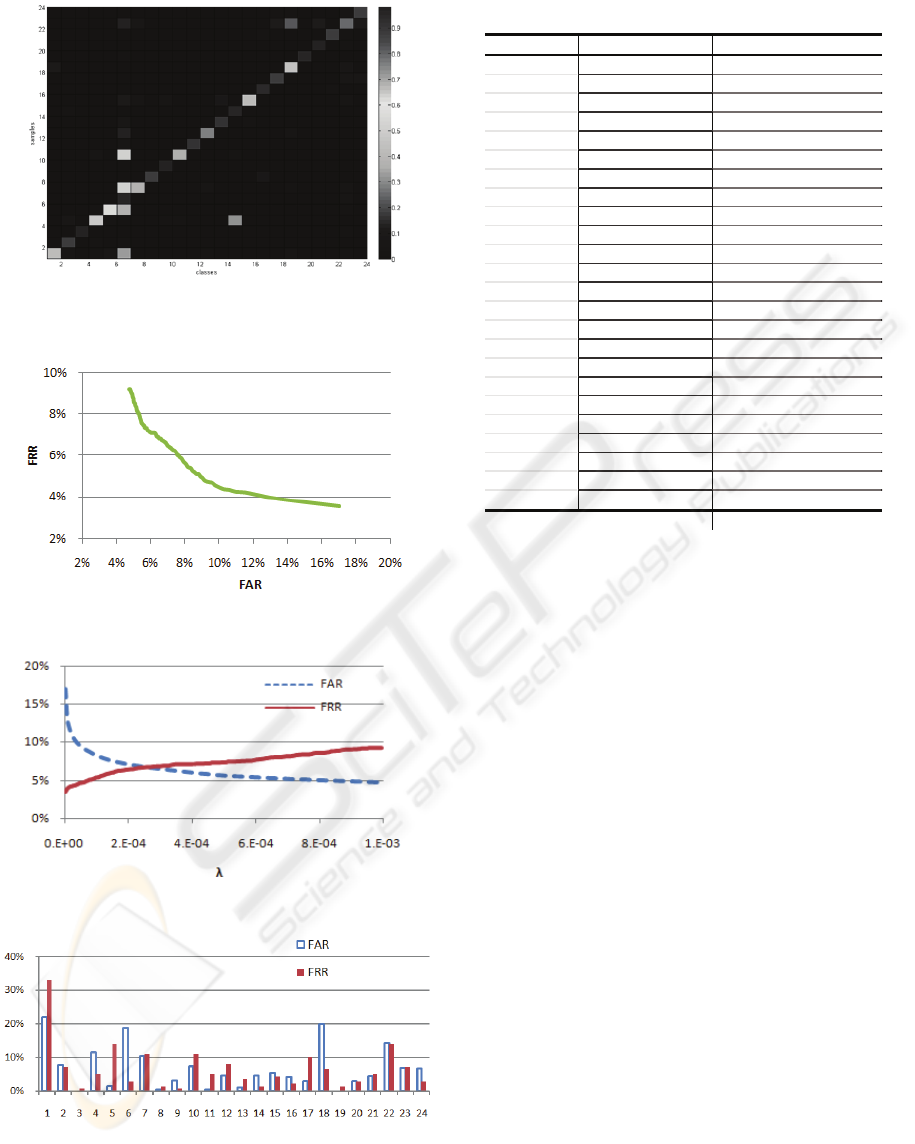
Figure 3: Confusion matrix for the MAP classifier
(average values).
Figure 4: ROC curve for the MAP classifier.
Figure 5: FAR/FRR(λ) curves for the MAP classifier.
Figure 6: FAR/FRR curves for each class, with
λ ~ 2.6E-04 (MAP classifier).
Table 2: ERR within each class (MAP classifier).
Class, k λ
k
ERR
1 1.51E-04 27%
2 4.66E-04 7%
3 2.00E-09 0%
4 6.40E-03 6%
5 6.45E-06 4%
6 9.90E-01 5%
7 1.91E-06 11%
8 3.00E-06 1%
9 2.00E-03 1%
10 1.56E-04 8%
11 2.06E-08 2%
12 2.10E-05 7%
13 2.80E-10 2%
14 1.60E-01 3%
15 3.86E-04 4%
16 3.30E-03 2%
17 3.48E-06 9%
18 4.70E-03 10%
19 2.00E-08 0%
20 1.56E-04 3%
21 1.71E-04 5%
22 3.11E-04 15%
23 2.66E-04 7%
24 2.03E-03 4%
average 6%
Regarding the One-Class classifier, the confusion
matrix (average values) obtained for the 137 runs, is
presented in Figure 7. Again, it is observed that
samples are extremely uncorrelated and almost all
are correctly classified. 75% of the test samples
achieve p(x|ω
k
) > 0.85. ROC and FAR/FRR(λ)
curves for the One-Class classifier (with
normalization within each class) are represented in
Figures 8 and 9, respectively. One observes better
results for this classifier when compared to MAP,
with FAR ranging from 3% and 13%, while FRR
lies between 7% and 13%. EER happens for
λ ~ 1.4E-03, corresponding to FAR=FRR=3.5%.
Worse results were obtained for the version of
One-Class classifier with normalization to the
maximum p(x|ω
k
). In this case, FAR lies between
5% and 15%, while FRR ranges from 8% to 16%.
EER occurs for λ ~ 2.5E-08, corresponding to
FAR=FRR=10%.
Regarding the 1-NN classifier, Figure 10 and
Figure 11 represent the ROC and FAR/FRR(λ)
curves for this classifier. For 1-NN, a symmetric
trend is verified when compared to the Bayesian
classifiers. With higher threshold levels, FAR will
increase, while FRR decreases. This is intuitive, as
increasing the distance threshold will lead the
system to accept more users, thus increasing FAR
and decreasing FRR. Poor performances were
BIOSIGNALS 2009 - International Conference on Bio-inspired Systems and Signal Processing
166
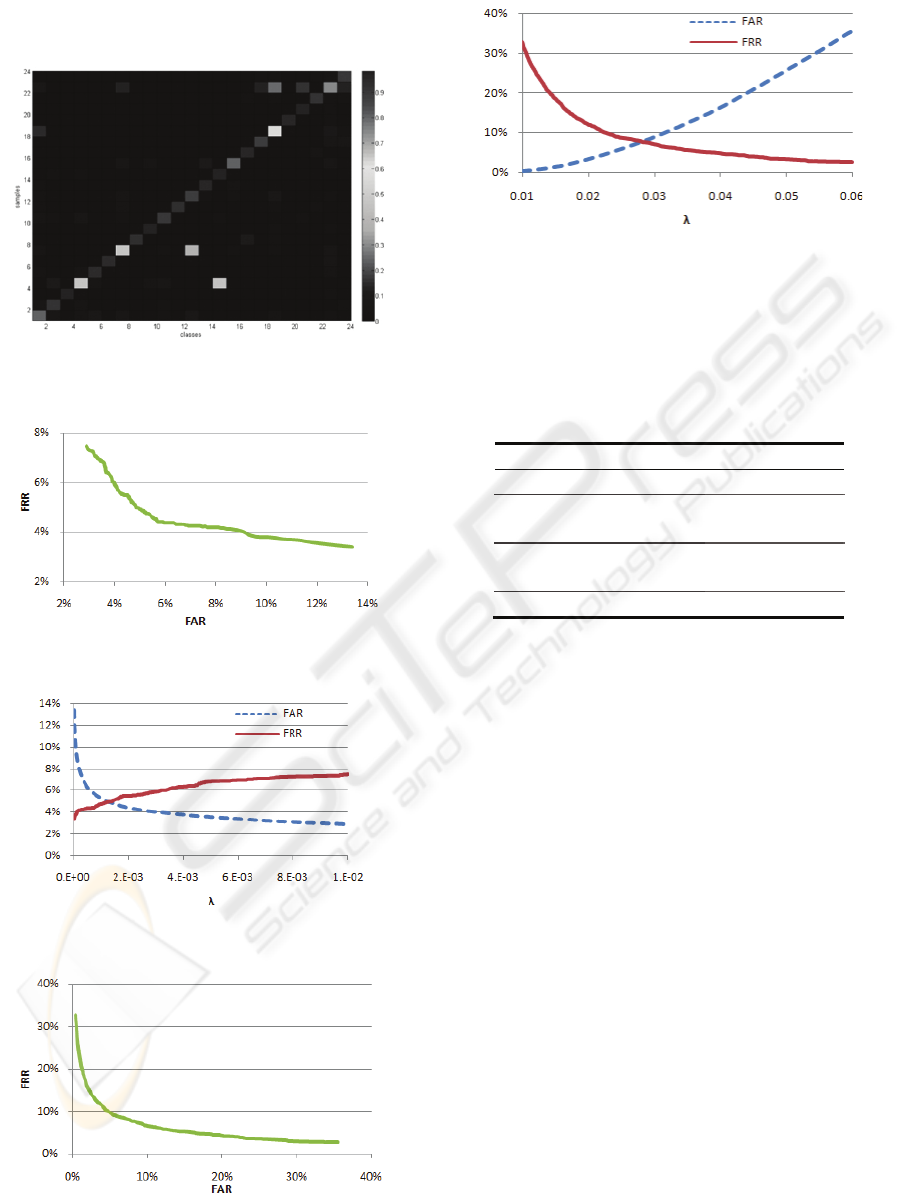
obtained for 1-NN, with EER occurring for
λ ~ 2.9E-02, corresponding to FAR=FRR=8%.
Figure 7: Confusion matrix for the One-Class classifier
with class normalization (average values).
Figure 8: ROC curve for the One-Class classifier.
Figure 9: FAR/FRR(λ) curves for the One-Class classifier.
Figure 10: ROC curve for the 1-NN classifier.
Figure 11: FAR/FRR(λ) curves for the 1-NN classifier.
An overview of the obtained results is presented
in Table 3, from which one concludes that all the
implemented classifiers are promising for an
ECG-based authentication scheme.
Table 3: Overview of classifiers.
Classifier EER
MAP 7%
One-Class
(class normalization)
3.5%
One-Class
(maximum normalization)
10%
1-NN 8%
5 CONCLUSIONS
This paper exploits possible approaches for
ECG-based authentication schemes, using real data
obtained by the HiMotion Project. ECG records
from 24 individuals were gathered during realization
of cognitive tests, where subjects held a surface
mount triode placed on the V2 pre cordial
derivation. Two Bayesian classifiers, MAP and
One-Class, and a standard 1-NN were implemented
using Matlab. Results show that the three schemes
achieve feasible performances for an authentication
system, with statistical classifiers presenting better
results.
Regarding the Bayesian classifiers, Gaussian
distributions were assumed to estimate p(x|ω
k
). In
the MAP classifier, decision is based on posterior
probabilities, given a global threshold for the 24
classes. This assumption results in an EER of 7%. It
was shown that enhanced performance could be
obtained, if one considers specific thresholds per
class. The same conclusion is valid for the One
Class classifier, which, in a first approach, considers
class normalization factors, leading to an error rate
of 3.5%. Without normalization to the maximum
ECG-BASED AUTHENTICATION - Bayesian vs. Nearest Neighbour Classifiers
167

p(x|ω
k
) within each class, performance degrades to
error rates of 10%. Regarding the 1-NN classifier,
which is based on distance measure, a slight worse
performance was achieved with EER of 8%.
It is concluded that the ECG biometric does
provide a simple method for human authentication,
which may be appropriate in some applications (e.g.,
sensor authentication in body area networks).
Moreover, ECG may be a good source of additional
information in a multi-biometrics approach, as well
as integrated in health surveillance systems.
REFERENCES
Biel,L., Pettersson,O., Philipson,L. & Wide,P. (2001).
ECG Analysis: A New Approach in Human
Identification. In IEEE Transactions on
Instrumentation and Measurement, Vol. 50, No. 3,
808-812.
Israel,S., Irvine,J., Cheng,A., Wiederhold,M. &
Wiederhold,B. (2005). ECG to identify individuals. In
Pattern Recognition, Vol. 38, No. 1, 133-142.
Sinus Rhythm. (2008). Retrieved 2008, from
http://en.wikipedia.org/wiki/sinus_rhythm.
Wübbeler,G., Stavridis,M., Kreiseler,D., Bousseljot,R. &
Elster,C. (2007). Verification of Humans Using the
Electrocardiogram. Pattern Recognition Letters,
Vol. 28, No. 10, 1172-1175.
Chan,A., Hamdy,M., Badre,A. & Badee,V. (2008).
Wavelet Distance Measure for Person Identification
Using Electrocardiograms. In IEEE Transactions on
Instrumentation and Measurement, Vol. 57, No. 2,
248-253.
Duda,R., Hart,P. & Stork,D. (2001). In Pattern
Classification. John Willey & Sons Inc.. New York,
2nd Edition.
Tax,D. (2001). One-Class classification: Concept-learning
in the absence of counter-examples. Ph.D. Thesis,
Delft University of Technology, Delft.
HiMotion Project. (2008). Retrieved 2008, from
http://www.it.pt/auto_temp_web_page_preview.asp?id
=305.
MATLAB Release 14 (2007). Retrieved 2008, from
http://www.mathworks.com/products/matlab/.
BIOSIGNALS 2009 - International Conference on Bio-inspired Systems and Signal Processing
168
