
A PRELIMINARY STUDY ON THE DETECTION OF
TRANSCRIPTION FACTOR BINDING SITES
Erola Pairo, Santiago Marco
Institut de bioenginyeria de Catalunya,Baldiri i Reixac 13, 08028, Barcelona, Spain
Departament d’electronica, Universitat de Barcelona, Mart´ı i Franqu`es 1, 08028, Barcelona, Spain
Alexandre Perera
Centre de Recerca en Enginyeria Biomdica
CIBER de Bioingeniera, Materiales y Nanomedicina (CIBER-BBN), Spain
Keywords:
Transcription factors, Binding sites, Principal components analysis.
Abstract:
Transcription starts when multiple proteins, known as transcription factors recognize and bind to transcription
start site in DNA sequences. Since mutation in transcription factor binding sites are known to underlie diseases
it remains a major challenge to identify these binding sites. Conversion from symbolic DNA to numerical
sequences and genome data make it possible to construct a detector based on a numerical analysis of DNA
binding sites. A subspace model for the TFBS is built. TFBS will show a very small distance to this particular
subspace. Using this distance binding sites are distinguished from random sequences and from genome data.
1 INTRODUCTION
Understanding transcription is a major challenge in
molecular biology, and knowledge of transcription
factors binding sites is a prerequisite for a com-
plete understanding of gene expression. Transcrip-
tion factor binding sites (TFBS) are typically short
sequences, shorter in eukaryotes than in prokaryotes,
and degenerate. These sequences show variability
without loss of function. TFBS are mostly located
near the transcription start site, in the promoter of a
gene, but in complex organisms, such as humans, can
be located several kilobases away from it. Charac-
teristics described above made the detection of TFBS
challenging, although both experimental and compu-
tational methods have been developed (Bulyk, 2003).
Availability of genome collected data and large-
scale gene expression experiments make it possible to
devise a large number of algorithms for identification
and prediction of transcription factor binding sites.
Many algorithms use non-coding sequences of co-
regulated genes from a single specie or non-codingse-
quences from orthologous genes from several related
species for doing de novo motif discovery (Pavesi
et al., 2004). Other algorithms use known transcrip-
tion factors, to build a model and search binding sites
in databases (Hannenhali, 2008).
Models of transcription factor binding sites can
be based on consensus sequences, where each posi-
tion is represented by the most common nucleotide
on that position using the IUPAC alphabet. Whether
a sequence belong or not to a transcription factor is
determined by the mismatches to the consensus, like
Weeder (Pavesi et al., 2001). Position weight matrices
(PWM) provide a probabilistic representation of bind-
ing sites because they capture the relative preference
for all four bases at each position. Among the mo-
dels for discovery and finding of transcription factors
based on PWM, some examples are Gibbs sampling
(Neuwald et al., 1995) and MEME (Bailey and Elkan,
2006). There are also models that use Hidden Markov
chains, which take into account interpositional depen-
dence.
While genomic information is represented by
character strings, it can also be mapped into a nume-
rical sequence. Many conversions from the symbolic
DNA sequences to numeric sequences have been pro-
posed (Anastassiou, 2001; Cristea, 2005). Nume-
rical representations can be used to analyze nume-
rical DNA sequences for detecting transcription fac-
tor binding sites. In this paper a detector based on a
subspace model of the TFBS is proposed. The sub-
506
Pairo E., Marco S. and Perera A. (2009).
A PRELIMINARY STUDY ON THE DETECTION OF TRANSCRIPTION FACTOR BINDING SITES.
In Proceedings of the International Conference on Bio-inspired Systems and Signal Processing, pages 506-509
DOI: 10.5220/0001550305060509
Copyright
c
SciTePress

space is found by a Principal Component Analysis
(PCA) of a training dataset containing known exam-
ples of TFBS. The structure of the sequences that are
recognized by a specific transcription factor can be
captured by its covariance, taking into account inter-
positional dependence. While PWM based methods
use only the information regarding the frequency of
each nucleotide at a given position, the development
of methods that capture interpositional dependence
opens new possibilities to improve detector perfor-
mance.
2 MATERIALS AND METHODS
The analysis has been done on four different groups
of DNA sequences previously aligned. Each one
is recognized by a transcription factor as a bin-
ding site. The first two groups of sequences
come from Dr. Schneider data’s (http://www.-
lmmb.ncifcrf.gov/∼toms), and corresponds to the
Dr. Thomas Schneider’s work on the characteri-
zation of transcription factor binding sites (Schnei-
der, 1997). The last two groups have been obtained
using the TRANSFAC data base (http://www.gene-
regulation.com/pub/databases.html), that contains
data on transcription factors, their binding sites and
the regulated genes. The last groups of sequences
have been aligned using MUSCLE (Edgar, 2004). Ta-
ble 1 summarizes the characteristics of these groups
of sequences.
Not all the aligned sequences, corresponding to
a certain transcription factor, have the same length,
because of missing data at the extremes of some se-
quences. To carry out PCA sequences of the same
length are needed, therefore data have been prepro-
cessed and missing values have been omitted. Al-
though many techniques to model missing data have
been proposed, the present work only considers posi-
tions where the nucleotide is present for all sequences.
In order to perform or a PCA analysis conversion
to numerical sequences is needed. Each nucleotide
has been assigned to a vertex of a regular tetrahedron,
so that nucleotides are symmetric among each others
(Silverman and Linske, 1986). In figure 1, the posi-
tion of each nucleotide in a tetrahedron is schemati-
cally shown.
Vectors corresponding to each nucleotide of a se-
quence have been concatenated to a vector, and the
different sequences corresponding to a TFBS have
been arranged in matrix form. The result obtained is
a matrix with 3· Number of nucleotides columns and
as many rows as the number of original sequences.
Principal component analysis performs a eigen-
−0.5
0
0.5
1
−1
0
1
−0.5
0
0.5
1
A=(0,0,1)
T=(2sqrt(2),0,−1/3)
C=(−sqrt(2)/3,−sqrt(6)/3,−1/3)
G= (− sqrt(2)/3, −sqrt(6)/3,−1/3)
Figure 1: Schema to illustrate the numerical representation
of DNA. Each nucleotide is placed in a vertex of a regular
tetrahedron.
analysis of the covariance and permits to project the
data into a subspace defined by the set of eigenvectors
capturing the maximum variance. Equation 1, shows
the PCA decomposition, where X is the DNA numer-
ical matrix with dimensions M × 3N (where M is the
number of sequences and N is the binding site length),
A are the scores, B are the eigenvectors (loadings),
and E the error. Dimensions of A are M · npc and
dimensions of B correspond to 3N · npc, where npc
represents the number of principal components in the
model.
X = AB
T
+ E (1)
In case of DNA sequences,the similarly distribu-
tion of the variance along all dimensions indicates the
complexity of DNA data. In order to capture a great
percentage of variance more dimensions have to be
taken into account.
A detector has been created using Q-residuals,
calculated using equation 2, where E is the distance
orthogonal to the subspace defined by the principal
components. Since most of the variance of trans-
cription factor binding sites has been captured by
the model, the Q-residuals of a sequence belonging
to a binding site should be small, while random se-
quences should have higher Q-residuals, according to
their symmetric variance in all the space. Defining a
threshold on Q-residuals, TFBS can easily been dis-
tinguished from random sequences.
Q = EE
T
(2)
Models with different number of principal com-
ponents have been built for each transcription factor
and to demonstrate that binding sites have a struc-
ture 100,000 random sequences have been used as
test data. To evaluate the detector we propose the use
of Receiving Operating Characteristic (ROC) curves,
which show the true positive rate (TP) against the
false positive rate (FP). ROC curves have been com-
puted in a range of principal components in order to
A PRELIMINARY STUDY ON THE DETECTION OF TRANSCRIPTION FACTOR BINDING SITES
507
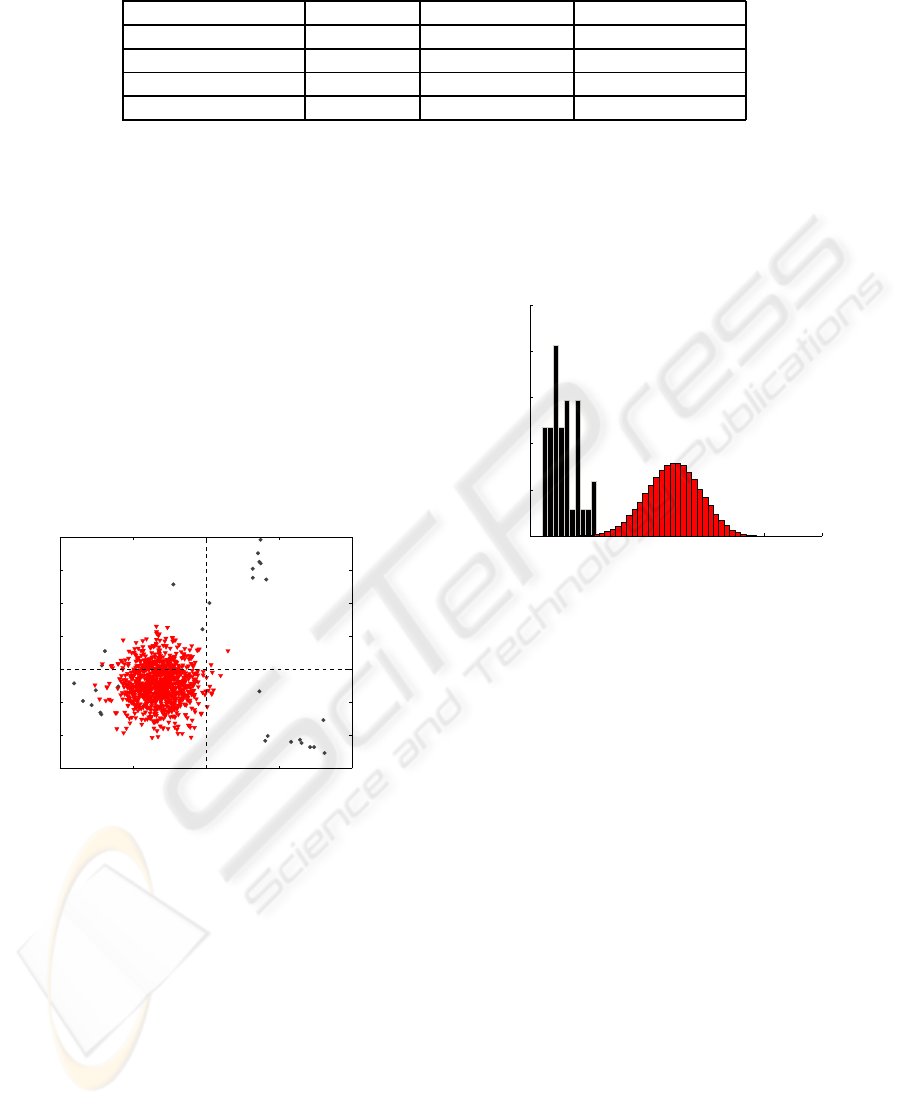
Table 1: Summary of the principal characteristics of the studied DNA sequences.
Transcription factor Organism number of bases Sequences aligned
Argr E. Coli 13 34
T7 symmetry Plasmid T7 41 34
ROX1 S.cerevisae 12 20
Abf1 S.cerevisae 11 22
study the efficiency of the proposed detector. Study-
ing the Area under ROC curve (AUC), helps to choose
the ideal number of principal components for a given
TFBS. The results have been validated using leave-
one-out-cross-validation: a TFBS sequence has been
removed and the remaining have been used to calcu-
late a model. Then, this model has been used to distin-
guish the removed sequence from random sequences.
Finally, a more realistic data has been used like
test data.S.cerevisae chromosomes 1 and 16, where
Abf1 and ROX1 binding sites, respectively, are
known to be. The model has been built without the
binding sequences in the chromosome and leave one
out has been used, to compute ROC curves in real
data.
−4 −2 0 2 4
−3
−2
−1
0
1
2
3
4
Scores on PC 1 (15.16%)
Scores on PC 2 (11.95%)
Figure 2: Scores in PCA 2 versus scores in PCA 1. T7 sym-
metry sequences are represented with circles and random
sequences with triangles.
3 RESULTS
A first visualization of the data can be obtained rep-
resenting the scores of the two first principal compo-
nents. In figure 2, the scores of the first principal com-
ponents in T7 symmetry binding sites are shown, for
better visualization only 1000 random sequences are
represented. It can be observed that binding sites have
a structure different from random sequences.
In order to confirm that Q-residuals can be used
in order to build a detector, the histograms of Q-
residuals have been computed, for model data and
100,000 random sequences in each TFBS. In figure
3, the histogram has been represented, using 8 prin-
cipal components and Argr binding sites. It is clearly
shown than a threshold can be defined between ran-
dom sequences and binding sites.
0 5 10 15 20 25
0
0.05
0.1
0.15
0.2
0.25
Q−residuals(26,03%)
Probability distribution
Figure 3: Q-residuals histogram of transcription factor
binding, in black, and random sequences in red. A threshold
can be defined to separate the two kinds of sequences
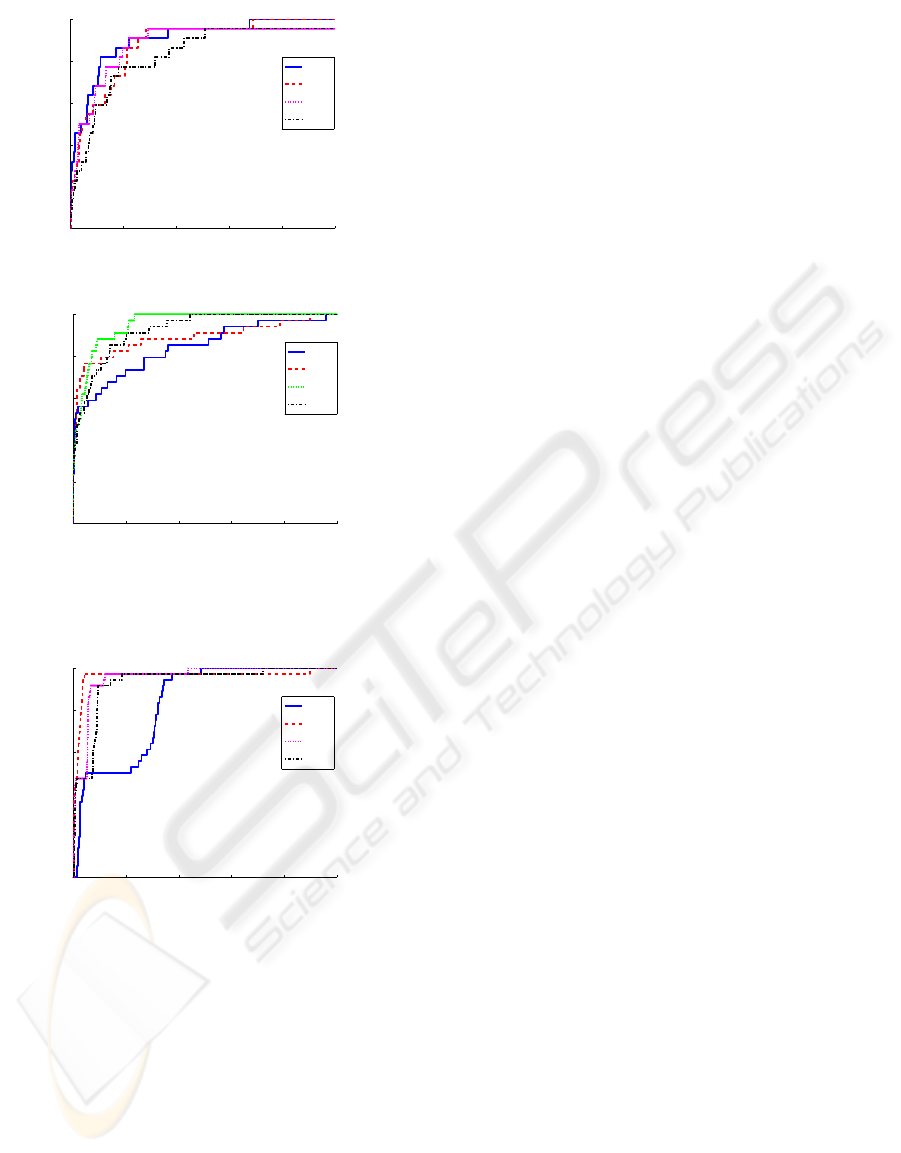
3.1 Detection Within Synthetic Data
The ideal number of principal components can be
chosen, as it is said above, using AUC. ROC curves
for Abf1 and Argr in figure 4, show that this number
is different for each TFBS. Increasing the number of
principal components, in Argr binding sites, leads to
better efficiency of the detector, but it exists a thres-
hold and above it, the PCA starts capturing indivi-
dual information of each sequence. Trying to increase
more the number of principal components leads then,
to worse efficient detectors. In Abf1 the ideal number
of principal components is one, and using only two
principal components decreases the AUC.
3.2 Detection Within a Real Genome
Next step on the validation of a the detector must be
detect TFBS within the chromosome where they are
known to be. Abf1 and ROX1 models are used to test
the chromosomedata, and figure 5 showthat the result
is even better than the detection in random sequences.
BIOSIGNALS 2009 - International Conference on Bio-inspired Systems and Signal Processing
508
0 0.01 0.02 0.03 0.04 0.05
0
0.2
0.4
0.6
0.8
1
FP
TP
1 pc
4 pc
6 pc
11 pc
(a) ROC Abf1
0 0.05 0.1 0.15 0.2 0.25
0
0.2
0.4
0.6
0.8
1
FP
TP
1 pc
7 pc
13 pc
18 pc
(b) ROC ARGR
Figure 4: ROC curves for two different transcription factor
binding sites.
0 0.002 0.004 0.006 0.008 0.01
0
0.2
0.4
0.6
0.8
1
FP
TP
1 pc
8 pc
12 pc
14 pc
Figure 5: Detection of ROX1 binding site within the yeast
chromosome 16 .
4 CONCLUSIONS
A detector that uses Q-residuals has been proposed
to distinguish TFBS from random and genome se-
quences. ROC curves show that this detector can
be used efficiently to find TFBS locations in random
data, as a preliminary study of the accuracy of Q-
residuals detectors. Increasing the number of princi-
pal components not always involves more accuracy in
the detection, as it exists a ideal number of principal
components that must be chosen for each TFBS.
Efficiency of the detector has also been proved
using a complete chromosome where the Abf1 and
ROX1 binding sites are known to be. The results have
also been tested using a leave one out cross valida-
tion. Inside the genome the resolution of the detector
is higher than in random sequences.
Detection in higher organisms and comparison be-
tween this detector and other detectors proposed in
literature have to be developed in the future.
ACKNOWLEDGEMENTS
This work has been partially supported by the Span-
ish Ministerio de Ciencia y Tecnologa through the CI-
CYT GRANT TEC2007-63637 and the Ramon y Ca-
jal program.CIBER-BBN is an initiative of the Span-
ish ISCIII.
E.P. wants to thank IBEC for supporting her PhD
financially.
REFERENCES
Anastassiou, D. (2001). Genomic signal processing. Signal
Processing Magazine, IEEE, 18(4):8–20.
Bailey, T. and Elkan, C. (2006). Meme:discovering and
analizing dna and protein sequence motifs. Nucleic
acids research, 34:W369–W373.
Bulyk, M. (2003). Computational prediction of
transcription-factor binding site locations. Genome
Biology, 5(1):201.
Cristea, P. (2005). Genomic Signal processing and statis-
tics, chapter Representation and analysis of DNA se-
quences. Hindawi Publishing Corporation.
Edgar, R. (2004). Muscle: multiple sequence alignment
with high accuracy and high throughput. Nucleic
Acids Res, 32(5):1792–1797.
Hannenhali, S. (2008). Eukaryotic transcription factor bind-
ing sites- modeling and integrative search methods.
Bioinformatics, 24.
Neuwald, A., Liu, J., and Lawrence, C. (1995). Gibbs mo-
tif sampling: Detection of bacterial outer membrane
protein repeats. Protein Sci., 4:1618–1632.
Pavesi, G., Mauri, G., and Pesole, G. (2001). An algo-
rithm for finding signals of unknown length in dna se-
quences. Bioinformatics, 17:207–214.
Pavesi, G., Mauri, G., and Pesole, G. (2004). In silico repre-
sentation and discovery of transcription factor binding
sites. Brief Bioinform, 5(3):217–236.
Schneider, T. (1997). Information content of individual ge-
netic sequences. J. Theor. Biol., 189:427–441.
Silverman, B. and Linske, R. (1986). A measure of dna
periodicity. Journal of Theoretical Biology, 118:295–
300.
A PRELIMINARY STUDY ON THE DETECTION OF TRANSCRIPTION FACTOR BINDING SITES
509
