
DEVELOPMENT OF A MYOELECTRIC CONTROLLER
BASED ON KNEE ANGLE ESTIMATION
Alberto López Delis, João Luiz Azevedo de Carvalho, Adson Ferreira da Rocha
Francisco Assis de Oliveira Nascimento and Geovany Araújo Borges
Department of Electrical Engineering, Universidade de Brasilia, Brasilia, DF, Brazil
Keywords: Electromyographic signal, Prosthesis control, Microcontrolled bioinstrumentation, Feature extraction,
Dimensionality reduction, Neural network.
Abstract: This paper presents the development of a bioinstrumentation system for the acquisition and pre-processing
of surface electromyographic (SEMG) signals, as well as the proposal of a myoelectric controller for leg
prostheses, using algorithms for feature extraction and classification of myoelectric patterns. The
implemented microcontrolled bioinstrumentation system is capable of recording up to four SEMG channels,
and one electrogoniometer channel. The proposed neural myoelectric controller is capable of predicting the
intended knee joint angle from the measured SEMG singals. The controller is designed in three stages:
feature extraction, using auto-regressive model and amplitude histogram; feature projection, using self
organizing maps; and pattern classification, using a Levenberg-Marquadt neural network. The use of SEMG
signals and additional mechanical information such as that provided by the electrogoniometer may improve
precision in the control of leg prostheses. Preliminary results are presented.
1 INTRODUCTION
The use of microprocessors in myoelectric control
has grown notably, benefitting from the functionality
and low cost of these devices. Microprocessors
provide the ability to employ advanced signal
processing and artificial intelligence (AI) methods as
part of a control system, while easily conforming to
control options, and adjusting to the input
characteristics. They also provide the ability to
implement pattern-recognition-based control
schemes, which increases the variety of control
functions, and improves robustness.
Surface electromyographic (SEMG) signals
provide a non-invasive tool for investigating the
properties of skeletal muscles (Sommerich et al,
2000). The bandwidth of the recorded potentials are
relatively narrow (50-500 Hz), and their amplitude is
low (50 µV - 5 mV) (De Luca, 2006). These signals
have been used not only for monitoring muscle
behavior during rehabilitation programs (Monseni-
Bendpei et al, 2000), but also for the mechanical
control of prostheses. In this context, it is important
to be able to correctly predict which movement is
intended by the user. The SEMG signal is very
convenient for such application, because it is non-
invasive, simple to use, and intrinsically related to
the user’s intention. However, there are other useful
variables, especially those related to proprioception,
for example: the angle of a joint, the position of the
limb, and the force being exerted.
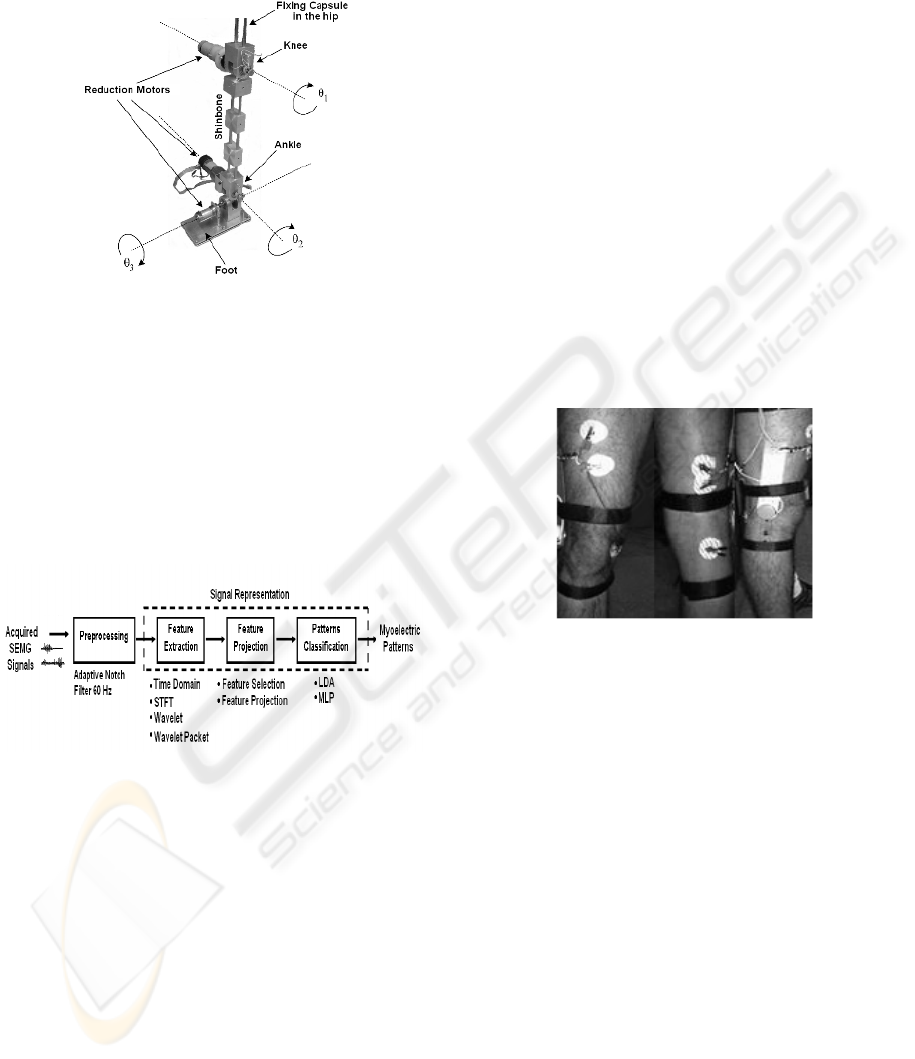
This project is supported under the development
of an active leg prosthesis prototype (Figure 1). The
prosthesis has three degrees of freedom: one for the
knee (sagittal plane), and two movements for the
foot (sagittal and frontal plane). The three degrees of
freedom are associated to the angles θ
1
, θ
2
and θ
3
,
controlled by DC reduction motors.
The prototype will be fixed to the patient’s upper
leg through a fixing capsule, where the SEMG
sensors will be located. The prosthesis will receive
control commands through digital signal processing,
feature extraction, and pattern classification.
Specifically, for the development of an active leg
prosthesis that also possesses ankle and foot axes, it
is necessary to use other sources of information
besides SEMG (Ferreira et al, 2005). Thus, the use
of myoelectric signals combined with other variables
related to proprioception may improve the reliability
in closed-loop control systems. In addition, the
bioinstrumentation system should be as immune to
noise and interference as possible. This can be
97
Delis A., de Carvalho J., da Rocha A., Nascimento F. and Borges G. (2009).
DEVELOPMENT OF A MYOELECTRIC CONTROLLER BASED ON KNEE ANGLE ESTIMATION.
In Proceedings of the International Conference on Biomedical Electronics and Devices, pages 97-103
DOI: 10.5220/0001550600970103
Copyright
c
SciTePress
achieved by proper board and shielding design, as
well as the use of filters whenever they are
necessary.
Figure 1: Mechanical structure of the prosthesis prototype.
Figure 2 presents the typical main components of
a general myoelectric controller based on pattern
recognition. The SEMG signals are acquired by
surface electrodes placed on the skin over muscle(s)
of the user. The signals originating from the
electrodes are pre-amplified to differentiate the
small signals of interest, and then are amplified,
filtered and digitized. Finally, the information is
transferred to a myoelectric controller (Asghari and
Hu, 2007).
Figure 2: Typical main components of a general
myoelectric controller based on pattern recognition.
In the design and implementation of a myoelectric
controller, the system’s precision is essential for a
realistic accomplishment of the user’s intention. The
precision is an important factor on the development
of multi-sensory controllers, and can be improved by
extracting more information from the muscle’s state,
and using a classifier that is capable of improving
this information. The controller should be capable of
learning the muscular activation patterns that are
used in natural form for typical movements. It also
needs robustness against the condition variations
during the operation. The response time cannot
create delays that are noticeable to the user.
This article presents a micro-controlled
bioinstrumentation prototype system as part of the
development of an active leg prosthesis structure
that allows the acquisition and processing of
electromyographic signals and other data related to
the articulate movement, specifically the angle of the
knee. The information obtained is processed in order
to obtain appropriate myoelectric patterns for
prosthesis control. Preliminary results on the design
of algorithms for the estimation of the knee angle,
based on patterns recognitions techniques, are
presented.
2 METHODS
The front end stage of the designed
bioinstrumentation system acquires up to four
SEMG channels. The SEMG are measured on a pair
of agonist and antagonist muscles of the leg (Fig. 3).
An electrogoniometer is used to measure the flexion
and extension angles of the knee joint (Fig. 3c).
(a) (b) (c)
Figure 3: Experimental setup. Surface electrodes are
placed over a pair of agonist and antagonist muscle groups
of the leg: (a) vastus intermedius, (b) semitendinosus. An
electrogoniometer is used to measure the flexion and
extension angles of the knee joint (c).
Differential amplifiers, used in the bipolar
configuration, significantly reduce the common
mode interference signals (CMRR > 110 dB). A
band-pass filter between 10 Hz and 500 Hz
frequency range is used. It is composed by a low-
pass filter and high-pass filter with a programmable
gain stage from digital potentiometers, controlled by
the microcontroller. These elements allow the setting
of the SEMG amplitude levels based on the
measurements from the patient. To minimize power
consumption and increase noise immunity,
operational amplifiers with JFET inputs were used.
To obtain adequate myoelectric amplitude, an
overall gain of up to 20000 can be programmed at
the front end (De Luca, 2006).
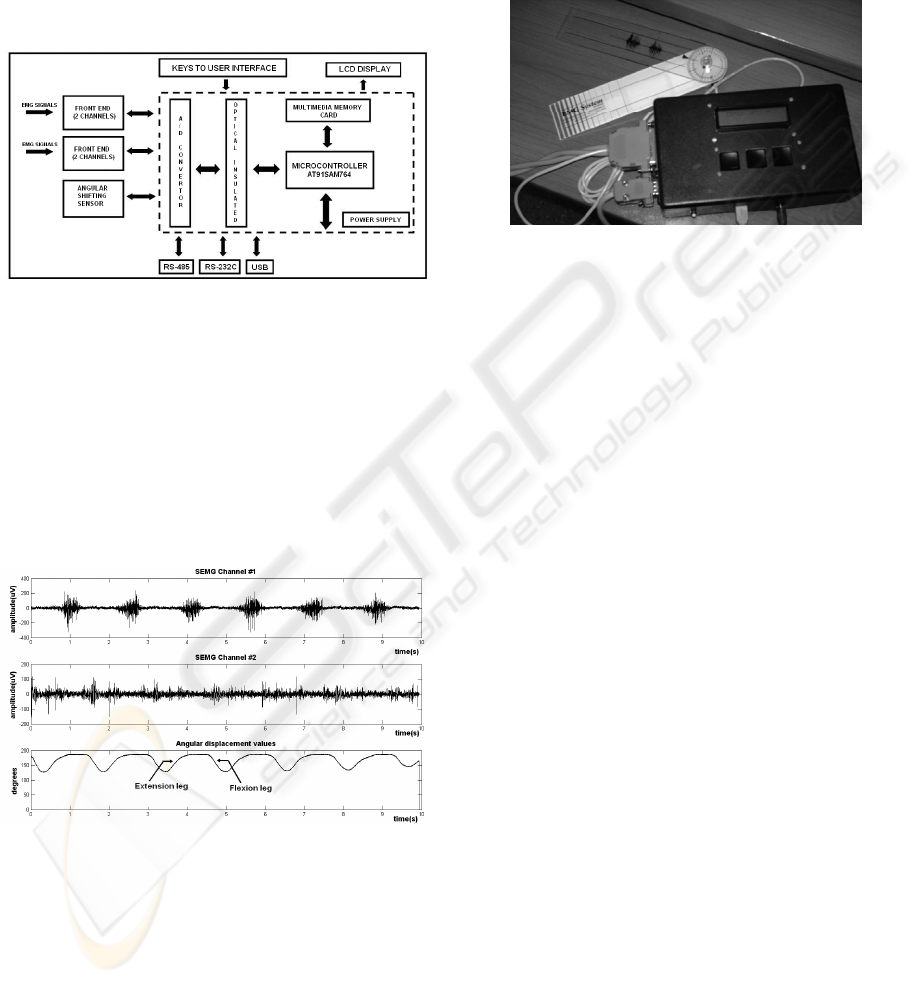
A second block, micro-controlled and optically
isolated from the front end (Figure 4), centralizes all
BIODEVICES 2009 - International Conference on Biomedical Electronics and Devices
98
the functions associated with the analog/digital
conversion process, implementing the digital gain
control for the front end amplifiers and synchronized
sampling of SEMG signals. The microcontrollers
belong to the ARM SAM7S64 ATMEL family of
high performance processors, based on 32-bit RISC
architecture with an integrated group of peripherals
that minimize the number of external components.
Figure 4: Block diagram of the bioinstrumentation system.
A 13-bit A/D converter with Serial Peripheral
Interface (SPI) is used for signal sampling, and
allows discriminating small amplitude levels. The
electrogoniometer channel is coupled to the system,
and generates an electric signal corresponding to the
angular position ranging from 30 to 240 degrees.
The sampling frequency of each channel is 1744.25
Hz. Figure 5 presents example data acquired during
an experimental measurement.
Figure 5: Recorded SEMG signals (rectus femoris and
opposite muscles) and angle of the knee joint during a
10-second experiment.
The microcontroller is linked through RS-485
protocol to the central processor of the prosthesis,
which is responsible for coordinating the tasks in the
control process. Besides the RS485 protocol, which
provides the interaction of the block with the central
processor, RS-232C and USB interfaces are
available for the communication with a PC when the
system is configured in stand alone mode (Figure 6).
In this mode, the system allows the visualization of
the state of the experiments during their realization
using a LCD display. The instrumentation system is
designed using low power consumption components,
which increases the system’s portability.
Figure 6: Bioinstrumentation module (with accessories)
configured in stand alone mode.
2.1 Adaptive Filter Implementation
The power line interference usually has its first
harmonics (60 Hz, 120 Hz, 180 Hz, and 240 Hz) in a
portion of the spectrum with major SEMG energy
concentration. The use of an analog notch filter may
distort the signal; therefore it should only be used
when really necessary. Generally, the best option is
to use an adaptive notch filter. An embedded
subroutine in the ARM-SAM7S64’s core
implements an adaptive notch filter in real time. This
filter maintains a running estimate of the 60 Hz
interference, and the current noise at time t can be
estimated from the previous two noise estimates
(Hamilton, 1996), as shown in equations (1) and (2),
)2()()( nTtenTteNte −
−
−
=
(1)
where T is the sample period and N=2cos(2
π.
60.T).
In the filter, the output is generated by subtracting
the estimated noise, e(t), from the input signal, x(t).
The expression presented in equation (2) is used to
implement the filter.
)]()([)]()([)( nTtenTtxtetxtf −−
−
−
−
=
(2)
If f(t)>0, then the estimate was too low, so we
adjust the estimate upward by incrementing d:
dTnTeTnTe ++
=
+
)()(
(3)
If f(t) < 0, the estimate was too high, so the
estimate is decremented:
dTnTeTnTe −+
=
+
)()(
(4)
DEVELOPMENT OF A MYOELECTRIC CONTROLLER BASED ON KNEE ANGLE ESTIMATION
99
As d increases, the filter adapts more rapidly, and
exhibits a broad bandwidth. Similarly, as d
decreases, the filter adapts more slowly, and has a
narrower bandwidth. The selection of the d factor is
empiric, based on test realizations, and its value is
small compared to the dynamic range of the A/D
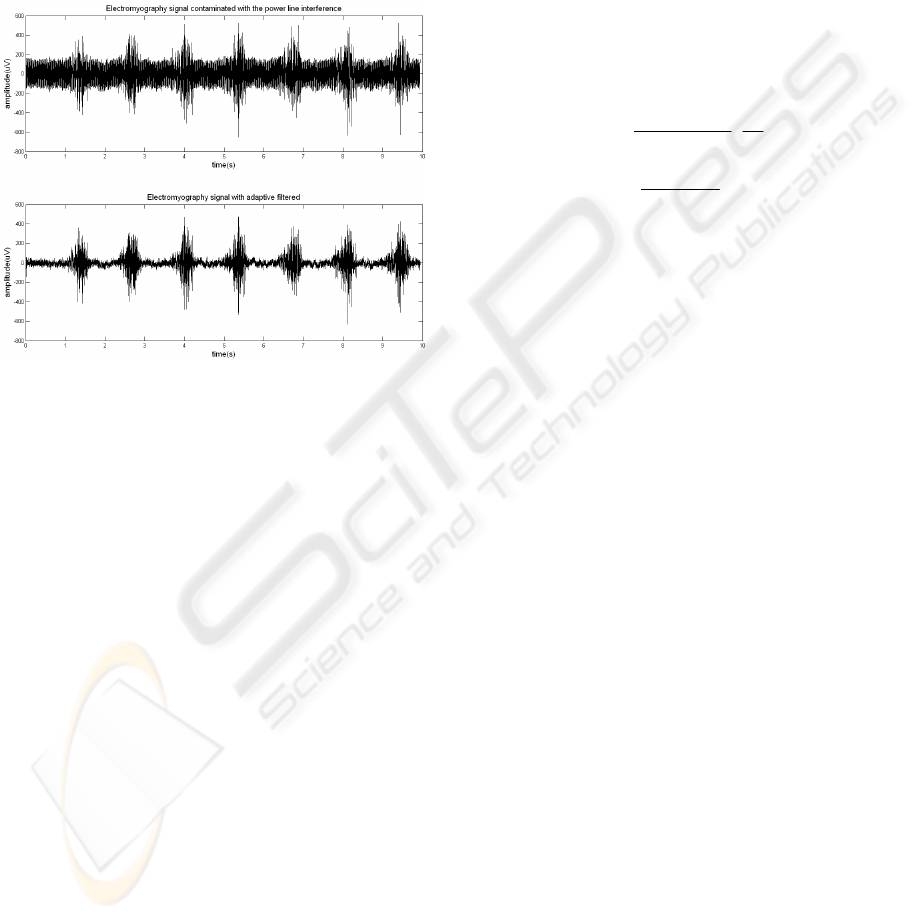
converter (Hamilton, 1996). Figure 7 shows the
adaptive filtering of a SEMG signal measured on the
rectus femoris muscle.
Figure 7: Adaptive filtering performed on a SEMG signal
contaminated with power-line interference.
2.2 Myoelectric Controller
Presenting the myoelectric signal directly to a
classifier is impractical, because of the
dimensionality and the random characteristics of the
signal. It’s necessary that the signal is represented as
a vector with reduced dimensionality, i.e., a feature
vector. The myoelectric controller algorithm
proposes the use of three stages for feature
extraction and pattern classification. The first stage
consists in the mixture of feature vectors from time
domain and spectral analysis. A second stage will
perform the reduction of the feature space, allowing
the increase in the number of SEMG input sensors
without affecting the performance of the control
process. The last stage has the goal of estimating the
knee angle.
2.2.1 Feature Vector Extraction
Given the stochastic nature of the myoelectric
signal, it can be considered as a time series, and
modeled as a linear combination of their past and
present values. The autoregressive model is a
convenient structure for model identification,
especially when the computations of velocity and
response time are important, as in the recognition
and classification of myoelectric patterns. The
autoregressive coefficients provide information
about the muscular contraction. The estimate of the
coefficients is performed using a recursive least
squares (RLS) technique, with a forgetting factor.
This method gives more weight to the most recent
samples at the moment of the iteration cycle. The
parameters are calculated recursively (Ljung, 1987),
as presented in equations (5), (6) and (7):
^
1
^
1
^
][
−−
−+=
k
T
kkkkk
yL
ηϕηη
(5)
kkk
T
kk
k
T
kkk
kk
P
PP
PP
λϕϕλ
ϕϕ
1
1
11
⎥
⎦
⎤
⎢
⎣
⎡
−=
−
−−
(6)
kk
T
kk
kk
k
P
P
L
ϕϕλ
ϕ
1−
=
(7)
where
k
^
η
are the vector coefficients that are
estimated at discrete time k;
ϕ
k
are the regressive
vectors,
k
P is the inverse correlation matrix and
k
L is the gain vector of the filter. The forgetting
factor
k
λ
controls the system response time. The
coefficient estimated at instant k can be interpreted
as a characteristic of the SEMG signal within the
time interval specified by the forgetting factor, and it
is a way of determining the angular displacement
that the patient wants to impose to the prosthesis
(Ferreira et al, 2005). The coefficients form a feature
vector for the pattern classification processes.
Recent research (Hargrove et al, 2008) has
demonstrated that a functional and efficient
configuration consists of a mixture of feature vectors
on the time domain with autoregressive coefficients.
This configuration provides good classification
precision, and is computationally efficient, which
facilitates its implementation in embedded systems.
It is also more robust to the displacement of the
surface electrodes (Hargrove et al, 2008).
This work uses a mixture of the autoregressive
vector with the EMG Histogram method. The EMG
Histogram is an extension of the Zero Crossing and
the Willison amplitude (Zardoshti-Kermai et al,
1995). Myoelectric signals reach relatively higher
levels during the contraction process, compared to
the base line amplitudes. Thus, vectors obtained
from the histogram provide a measure of the
frequency in which the signal reaches each level of
amplitude, associated with different histogram bins.
For the implementation of the histogram, a
BIODEVICES 2009 - International Conference on Biomedical Electronics and Devices
100
symmetrical interval with respect to base line over
the SEMG register is established and the same is
subdivided into 9 bins. These bins represent
intervals of amplitude in which the SEMG signal is
grouped.
The resultant feature vectors (autoregressive and
histogram) are concatenated, and then used as the
input vector of the feature projection stage.
2.2.2 Feature Projection
A feature projection stage is used to reduce the
dimension of the feature space of the input vectors,
before pattern classification process, using
supervised neural networks. This reduction is
performed using an unsupervised Kohonen
self-organizing map (SOM) neural network. The
groups of vector coefficients obtained from each
SEMG channel using the RLS and histogram
methods are transformed into two-dimensional
vectors. With the reduction in input dimension, the
SOM is able to reduce noise and absorb the large
variations that appear in the original features. In
addition, the SOM can shorten the training time of
the supervised neural network. The unsupervised
SOM can find the winning neuron on a 2-D map to
represent the original pattern. To find the output
neuron (winning node), the following steps are used,
according to the learning rule of the Kohonen
Feature map (Haykin, 1999).
Step 1: Choose random values for the initial
weight vectors W
j
(0).
Step 2: Find the winning neuron y
c
at time step t
(Similarity Matching), by using the minimum-
distance Euclidean criterion:
tjtWtxy
jc
,....,2,1,)()(minarg =−=
(8)
Step 3: Update the synaptic weight vectors of all
neurons by using the following update rule:
)]()([)()()()1(
,
tWtxthttWtW
jyjjj
c
−+=+
η
(9)
where
)(t
η
is the learning rate, and )(
,
th
c
yj
is the
neighbors function centred around the winner.
)(t
η
and )(
,
th
c
yj
are varied dynamically during the
learning stage, in order to obtain optimal results.
Step 4: Go back to step 2 until no changes in the
feature map are observed.
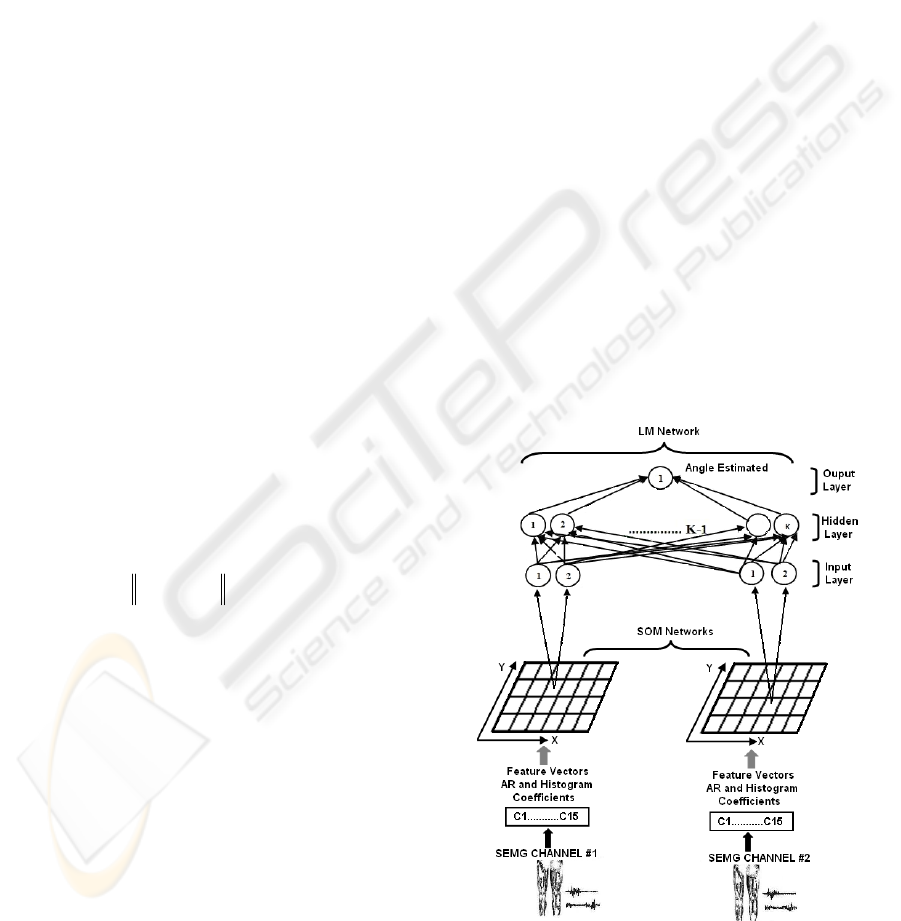
The inputs of the Kohonen’s SOM are features
from each channel, and the output is the 2-D
coordinate (on the x and y axes) on the 2-D
topological net. A 2-D coordinate is a condensed
feature for each channel (Figure 8).
2.2.3 Myoelectric Classification
Multi-layer neural networks have been successfully
applied to many difficult and nonlinear problems in
diverse domains and there is considerable research
on methods to accelerate the convergence time of
the multi-layer feedforward neural network
algorithm (Battiti, 1992 and Charalambous, 1992).
The method used in this paper is the Levenberg-
Marquadt (LM) algorithm (Hagan and Menhaj,
1994), which consists in the use of the nonlinear
least squares algorithm to the batch training of
multi-layer perceptrons. The LM algorithm can be
considered a modification of the Gauss-Newton
method. The key step in the LM algorithm is the
computation of the Jacobian matrix. The LM
algorithm is very efficient when training networks
which have up to a few hundred weights. Although
the computational requirements of the LM algorithm
become much higher after each iteration, this is fully
compensated by its higher efficiency. This is
especially true when high precision is required
(Hagan and Menhaj, 1994). Figure 8 presents the
complete block diagram of the myoelectric
controller.
Figure 8: Block diagram of the proposed myoelectric
controller algorithm.
DEVELOPMENT OF A MYOELECTRIC CONTROLLER BASED ON KNEE ANGLE ESTIMATION
101
^
)(ix
3 RESULTS
As a prototype implementation, the training and
validation processes were performed in off-line
mode, and the algorithms described above were
implemented in Matlab. At a later stage, the full
validation of the controller will be the executed from
an embedded system running on a Linux platform.
For this demonstration, SEMG measurements
were captured from a healthy subject using 10 mm
Ag/AgCL surface electrodes placed on a pair of
antagonistic muscles, associated with the flexing and
extension movements of the knee (Figure 3). The
electrodes were arranged in bipolar configuration,
and gel was used to reduce the resistance between
electrodes and skin. The distances between the
centers of the electrodes was 3-5 mm, and the
reference electrode was placed over the lateral
condyle bone. A total of 10 measurements were
performed, divided in two groups of signals -
training and validation - acquired during walks with
different speeds, with duration of 10 seconds.
For training purposes, it is essential to know
information about the input and output, comparing
the dimensional vectors obtained from the SOM
network to the displacement angle measured by the
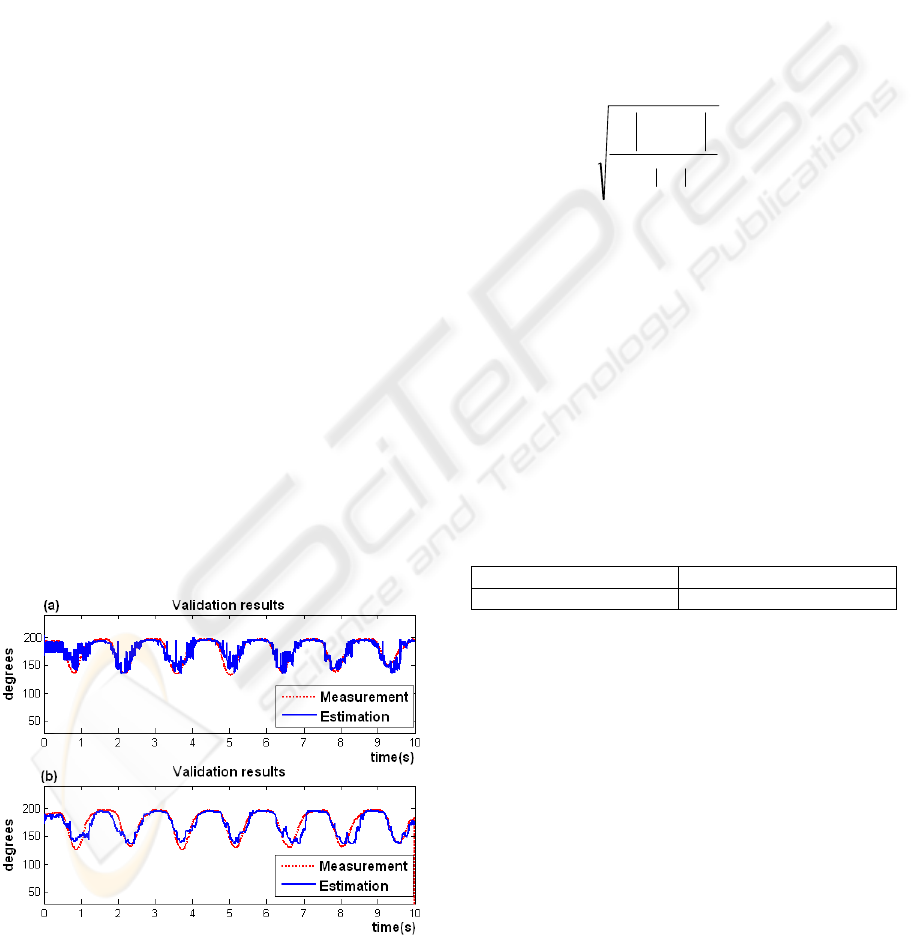
electrogoniometer sensor. Figure 9 shows the
estimated angle compared to the measured angle
from the electrogoniometer. Although the estimated
angle follows the measurement satisfactorily, the
output of the LM network presents the impulsive
noise (9a), which is canceled using a moving
average recursive filter with a 50-sample window
(9b). This filter keeps the changes levels or slopes
that are present in the angle estimated and present a
Figure 9: Comparison of the estimated knee angle (blue)
to the measured angle from the electrogoniometer (red):
(a) before filtering; (b) after filtering.
delay of (M - 1) / 2 samples, where M is the number
of samples in the average (Smith, 1999). The results
obtained with 50 samples of average were
satisfactory, decreasing the variance and conserving
the changes levels (Figure 9b).
A preliminary comparison was performed
between the proposed algorithm and the methods
proposed by Ferreira et al. (2005). The proposed
algorithm it is an alternative to the latter approach,
which consists in using the AR model for feature
extraction, and a LM multi-layer perceptron neural
network for pattern classification. The evaluation
was based on the classification error, which was
calculated using the following equation:
(%)100
)(
)()(
1
2
1
2
^
×
−
=
∑
∑
=
=
N
i
N
i
ix
ixix
error
(10)
where
)(ix and represent the angular values
from the electrogoniometer sensor and the angle
estimated vectors respectively, N is the dimension of
the vectors. Table 1 presents the averages error rate
of classification measured in the group of validation
signals.
The results in Table 1 show that the proposed
algorithm achieved better classification then the
method proposed by Ferreira et al. (2005). This
means that the proposed method is more accurate in
estimating the knee joint angle from the myoelectric
signals.
Table 1: Comparison based the average rate classification.
Ferreira et al. (2005) 8.02% ± 4.2
Proposal Algorithm 5.86% ± 1.6
4 CONCLUSIONS
This paper presents the current state of development
of a bioinstrumentation system for active control of
leg prostheses. Features of the system and of the
signal processing algorithm used in the myoelectric
controller were presented. The system allows the
acquisition of SEMG signals with a maximum
amount of signal information and a minimum
amount of contamination from electrical noise. The
results show that the system has great potential for
future developments in leg prostheses. Another
feature of the system is that it works not only as a
part of the prosthesis control, but also in stand alone
mode. Preliminary analysis showed that the
BIODEVICES 2009 - International Conference on Biomedical Electronics and Devices
102

computational complexity of the proposed algorithm
increases for each iteration during execution of the
LM network. Future work will aim optimize the
code for its execution in real time.
ACKNOWLEDGEMENTS
This work was partially supported by CAPES and
CNPq.
REFERENCES
Asghari, M. O. and Hu, H. 2007. Myoelectric Control
System - A survey, Biomedical Signal Processing and
Control, 2 275-294.
Battiti, R. 1992. First and second order methods for
learning: Between steepest decent and Newton´s
method, Neural Computation, 4 141-166.
Charalambous, C. 1992. Conjugate gradient algorithm for
efficient training of artificial neural networks, Circuit,
Devices and Systems, IEE Proceedings, 301-310.
De Luca, 2006. Encyclopedia of Medical Devices and
Instrumentation, John G. Webster Ed., 98-109.
Ferreira, R. U., da Rocha, A. F., Casão, Jr C. A., Borges,
G. A., Nascimento, F. A. O., Veneziano, W. H. , 2005.
Reconhecimento de Padrões de Sinais de EMG para
Controle de Prótese de Perna, Proc. XI Congresso
Brasileiro de Biomecânica, Brasil.
Hagan, M. T. and Menhaj, M. B. 1994. Training
feedforward networks with the Marquadth Algorithm,
IEEE Trans. Neural Networks 5 989-993.
Hamilton, P. S. 1996. A Comparison of Adaptive and
Nonadaptive Filters for Reduction of Power Line
Interference in the ECG, IEEE Trans. Biomed. Eng.,
43 105-109.
Hargrove, L., Englehart, K. and Hudgins, B. 2008. A
training strategy to reduce classification degradation
due to electrode displacements in pattern recognition
based myoelectric control, Biomedical Signal
Processing and Control, 3 175-180.
Haykin, S. 1999. Neural Networks: A Comprehensive
Foundation, New Jersey: Prentice Hall.
Ljung, L. 1987. Linear System Identification, Prentice-
Hall, Inc: Englewood Cliffs.
Monseni-Bendpei, M.A., Watson, M.J. and Richardson, B.
2000. Application of surface electromyography in the
assessment of low back pain: a literature review.
Phys. Ther. Rev., 2 93-105.
Sommerich, C.M., Joines, S.M., Hermans, V. and Moon,
S.D. 2000. Use of surface electromyography to
estimate neck muscle activity, J. Electromyography
Kinesiology, 6 377-398.
Smith, S. W. 1999. The Scientist and Engineer’s Guide to
Digital Signal processing, 2(ed.), San Diego:
California Technical Publishing.
Zardoshti-Kermani, M., Wheeler, B. C., Badie, K. and
Hashemi, R. M. 1995. EMG Feature Evaluation for
Movement Control of Upper Extremity Prostheses,
IEEE Trans. on Rehabilitation Eng., vol 3 324-333.
DEVELOPMENT OF A MYOELECTRIC CONTROLLER BASED ON KNEE ANGLE ESTIMATION
103
