
A MONITORING TOOLKIT FOR A DISTRIBUTED CLINICAL
DATA INTEGRATION ENGINE
Vânia Santos
1
, Daniel Oliveira
1
, Ilídio C. Oliveira
1,2
and J. P. S. Cunha
1,2
1
Institute of Electronics and Telematics Engineering of Aveiro (IEETA), Portugal
2
Dept. of Electronica, Telecommunications and Informatics, University of Aveiro, Portugal
Keywords: Health information systems, Health telematic networks, Heterogeneous sources integration.
Abstract: The Rede Telemática da Saúde (RTS) is a telematic network connecting health care providers in the Aveiro
region (Portugal), aiming at supporting the continuity of care. Using the RTS, health care professionals and
institutions can securely share clinical data. RTS makes use of an integration engine, which accesses the
scattered data sources to create a virtual unified view of patients’ information. RTS is deployed over a wide-
area private network, shared among a great variety of bandwidth links, systems and applications, which can
impact the infrastructure service levels in multiple ways. In this paper, we describe the development of a
toolkit for monitoring the performance of the distributed integration process. These analysis mechanisms
make it is possible to detect bottlenecks and introduce optimizations in the system, especially with respect to
the integration engine module. Its deployment in the production RTS health telematic network assists the
maintenance team and the decision taking process to handle usage trends and systems needs.
1 INTRODUCTION
Regional clinical communication networks are being
developed all around the world. (MedCom Team,
1999), (Petersen, M.E. et al, 2006), (
Katehakis,
D.G. et al, 2000
)
The Rede Telemática da Saúde (RTS) is a health
telematic network in the Aveiro region (Portugal),
allowing institutions and professionals to share
information about patients and related treatment
activities. At the heart of RTS there is an integration
engine named “HIETA – Health Care Interface
Engine for Telematic Applications” that builds a
virtual patient record by indexing scattered patient
data in a central Catalogue. The patient data itself is
not replicated, but metadata that describes the
information available and the associated sources.
(Cunha et al, 2006), (Cunha, J.P., 2007)
The early deployment of RTS in production
lacked the means to easily monitor the integration
engine processes, especially with respect to the
impact of network performance and distributed
information sources response time in the whole
process.
The problem was actually stressed with the
increasing utilization of the system and the
appearance of delays in the periodic distributed
integration processes. To understand the extent and
nature of delays and measure RTS service levels,
several questions were raised: are there bottlenecks
in the source data bases? Are there bottlenecks in the
transport over the network? Will integration engine
exhibit which performance trends as the information
in the network grows? Can the process tolerate
network failures gracefully?
To address these questions, a new module was
required in the RTS suite, allowing monitoring the
system and track problems in the distributed
integration process. The module, the RTS
Monitoring Toolkit, should also provide an
information base about the network performance,
extracting statistical data to support operations and
optimizations.
The Monitoring Toolkit module would assist the
understanding of the whole integration process
performance and, in connection to this end, provide
additional system health parameters. Besides
snapshot views, the solution was expected to provide
historical data and friendly analysis tools, allowing
to detect trends.
300
Santos V., Oliveira D., C. Oliveira I. and Cunha J. (2009).
A MONITORING TOOLKIT FOR A DISTRIBUTED CLINICAL DATA INTEGRATION ENGINE.
In Proceedings of the International Conference on Health Informatics, pages 300-305
DOI: 10.5220/0001551603000305
Copyright
c
SciTePress
2 MONITORING TOOLKIT
REQUIREMENTS
The RTS application suite is heavily based on
distributed processes calling for instruments to
schedule tasks and assess network availability and
the overall Catalogue update performance.
All middle to extensive weights systems must
have a monitoring tool to understand system
performance and react accordingly to system
behaviour. Nevertheless, RTS represents a larger
challenge: a distributed records system, supported by
a distributed network connecting several different
sources spread along a larger geographical area.
(Tanenbaum, 2002)
RTS works to unify and centralize clinical
information collected from heterogeneous data
sources, differing not only in operating systems but
also in the healthcare system encapsulating the
clinical information. In Portugal there are some
applicational systems distributed by hospitals,
regional health care centers and doctor support
systems. All of them produce clinical data, stored in
different database structures with certain associated
semantics, and all of these data are supposed to be
integrated into the RTS central database. If the
semantics are lost in the data conversion and
transmition, the data is useless, and the integration
purpose is lost.
This distributed infrastructure, the need of
keeping the data semantics, and the physical
obstacles like network failures and transmition delay
(which are inevitable) are the monitoring toolkit
challenges.
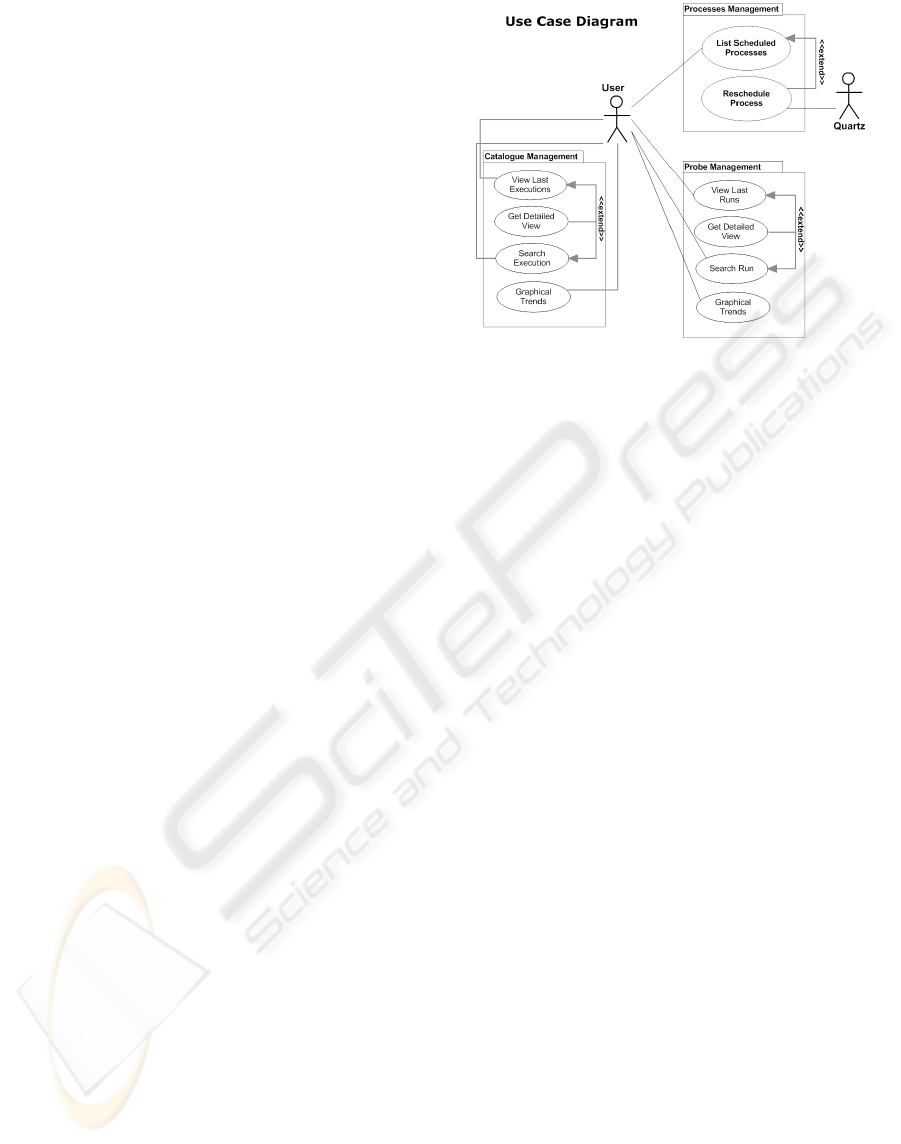
2.1 Monitoring Scenarios in the RTS
The Monitoring Toolkit requirements are organized
in three functional packages: Process management,
Catalogue Management and Probe management
(Figure 1).
Processes Management includes the use cases
to manage the integration scheduler, allowing,
through a graphical interface, to configure the RTS
scheduler, which defines when the configured
processes must execute.
Probe Management is used to monitor the
physical network layer and the information sources
availability. In the RTS monitoring system, a probe
is a message sent to the network for the purpose of
monitoring and collecting data about network
activity. It also compares a set of pre-selected probes
with the actual data coming from sources to assess
data correctness and individual source performance.
Figure 1: Monitoring Toolkit module use cases.
The Catalogue management is used to monitor
the data integration data process globally. Here, the
user is able to see the detailed integration process,
from the sub-process which builds the sources list to
the sub-process which saves the data in the database.
The Monitoring Toolkit builds charts of the
observed variables and provides a dashboard to
allow a global system state view and analysis to the
end-user.
While the scheduler management is quite trivial,
delegating the underling work to the Quartz library
(by Apache Jakarta Project, 2008) the two other
packages constitute the core of the monitoring tool:
the Sources availability probe, and the Catalogue
integration probe.
2.2 Sources Availability Probe
This task aims to check the network functional
status, selecting probe patients for reintegrate them
into the Catalogue. The fact of pre-selecting a
reduced number of patients and reuse it as a probe
set allows to obtain comparable results at different
levels, namely network availability, network
performance over time and integration sources
availability. The task starts to construct a list of all
available health care institutions in the network, and
while exists a source (from the built list) without a
probe patient, the process will keep selecting
patients already integrated in the catalogue to assign
them as a patient probe in a source without probe
patient. The assignment occurs when the selected
patient have episodes into the source which is being
processed. When all sources have probe patients, the
integration process will occur to the “source-probe
patient” combination (Listing 1).
A MONITORING TOOLKIT FOR A DISTRIBUTED CLINICAL DATA INTEGRATION ENGINE
301
Listing 1: Sources availability probe algorithm.
2.3 Catalogue Integration Probe
This probe aims to sense the Catalogue update
performance. To accomplish this task, sensors were
introduced in the method calls, along the update
workflow: visiting sources, gathering updates,
merging them to the Catalogue. The sensors
distribution along the process is illustrated in the
following algorithm.
Listing 2: Catalogue integration probe algorithm.
3 SYSTEM ARCHITECTURE
The Monitoring Toolkit was developed as a new
module to extend the RTS applications suite. We
will first introduce the RTS software organization
and then explain how the Monitoring Toolkit fits.
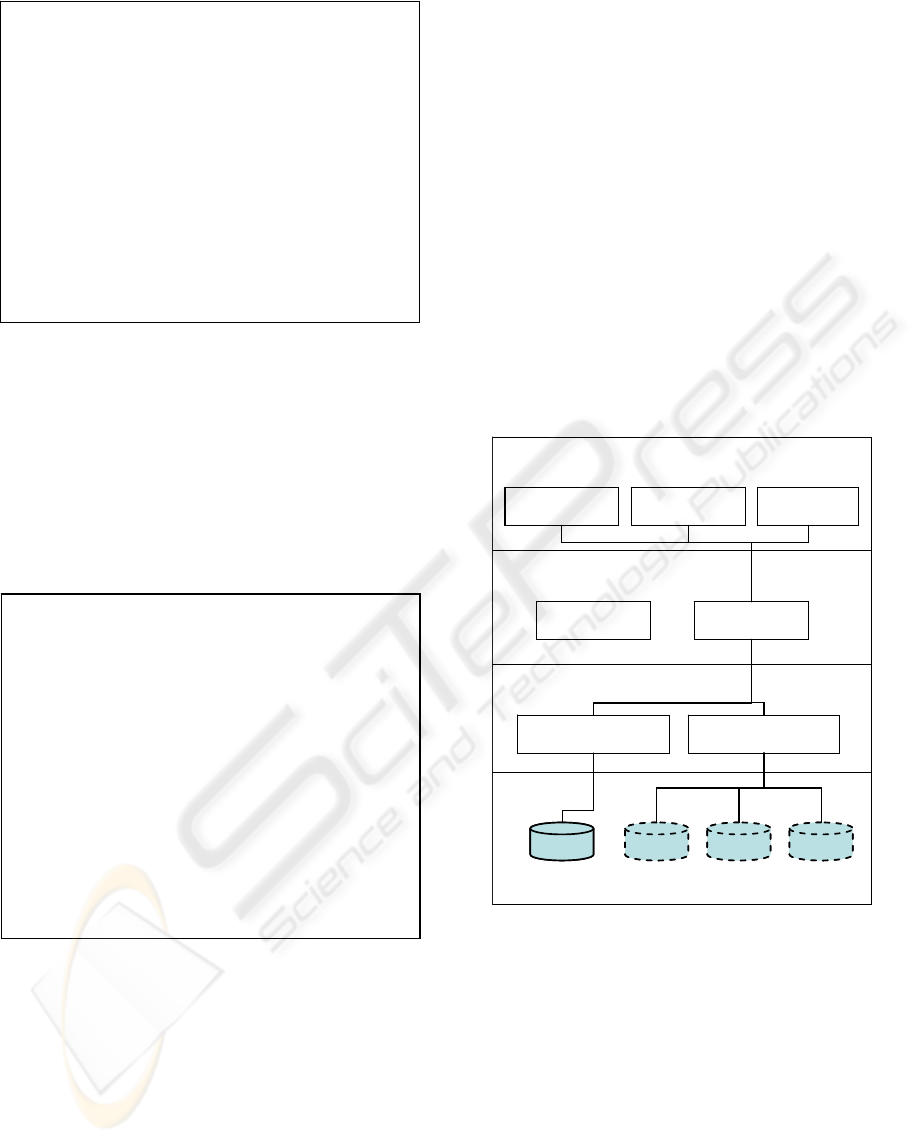
The RTS has a modular architecture, organized
in layers. The presentation layer encapsulates the
RTS web interfaces, which consisting in two web
portals, one to health care institutions professionals
(RTS_PRO) and other to the patients (RTS_UTE).
The web portal to the monitoring toolkit (RTS_REP)
also exists in this presentation layer.
The integration layer encapsulates the RTS
integration engine (RTS_IE) and important utilities
as the object conversion from Data Access Objects
to Data Transformed Objects (RTS_DTS).
The service layer encapsulates the gates to the
network services, which are the catalogue
(RTS_Catalogue) and the Wrappers
(RTS_Wrappers). The catalogue is the pointers
database to the information spread along the
network, and the wrappers get the clinical
information from the sources.
The persistent layer encapsulates the catalogue
and clinical data sources databases, the system
architecture end-points.
Presentation Layer
Integration Services Layer
Distributed Data Access Layer
Persistence Layer
RTS_Catalogue RTS_Wrappers
RTS_DTS RTS_IE
RTS_CIT RTS_PRO RTS_REP
Hosp. i Hosp. j
Primary
Care k
RTS
Catalogue
Presentation Layer
Integration Services Layer
Distributed Data Access Layer
Persistence Layer
RTS_Catalogue RTS_Wrappers
RTS_DTS RTS_IE
RTS_CIT RTS_PRO RTS_REP
Hosp. i Hosp. j
Primary
Care k
RTS
Catalogue
Figure 2: Rede Telemática da Saúde functional
architecture.
The Monitoring Toolkit introduced a complete new
reporting module in presentation layer, which
implements the web site to access the monitoring
functionalities.
This module communicates with service layer
through the integration engine, which is the module
responsible to process the network information and
processes.
To make integration engine able to analyse the
new sensors info, new methods has been added to
this module. Also, in service layer, the sensors were
Sensor1
Construct a list of available sources
For each source {
Sensor 2
Call non-intrusive elements to get
information
Sensor 3
Wait for source response
For each patient which information {
Sensor 4
Integrate information into the catalogue
}
}
store sensors information into the database.
construct a list of available sources
while exists sources without a selected patient
{
select the last integrated patient in the
catalogue
verify in which sources that patient has
episodes
select that patient to the identified sources
continue to next patient in the catalogue
}
for each patient
for each patient source selection
run the integration process
HEALTHINF 2009 - International Conference on Health Informatics
302
added to the processes code, to extract information
from the system.
Finally, new tables were inserted in the database,
to store the sensors information, and make
persistence layer able to map the new relational
objects into the services layer.
4 RESULTS
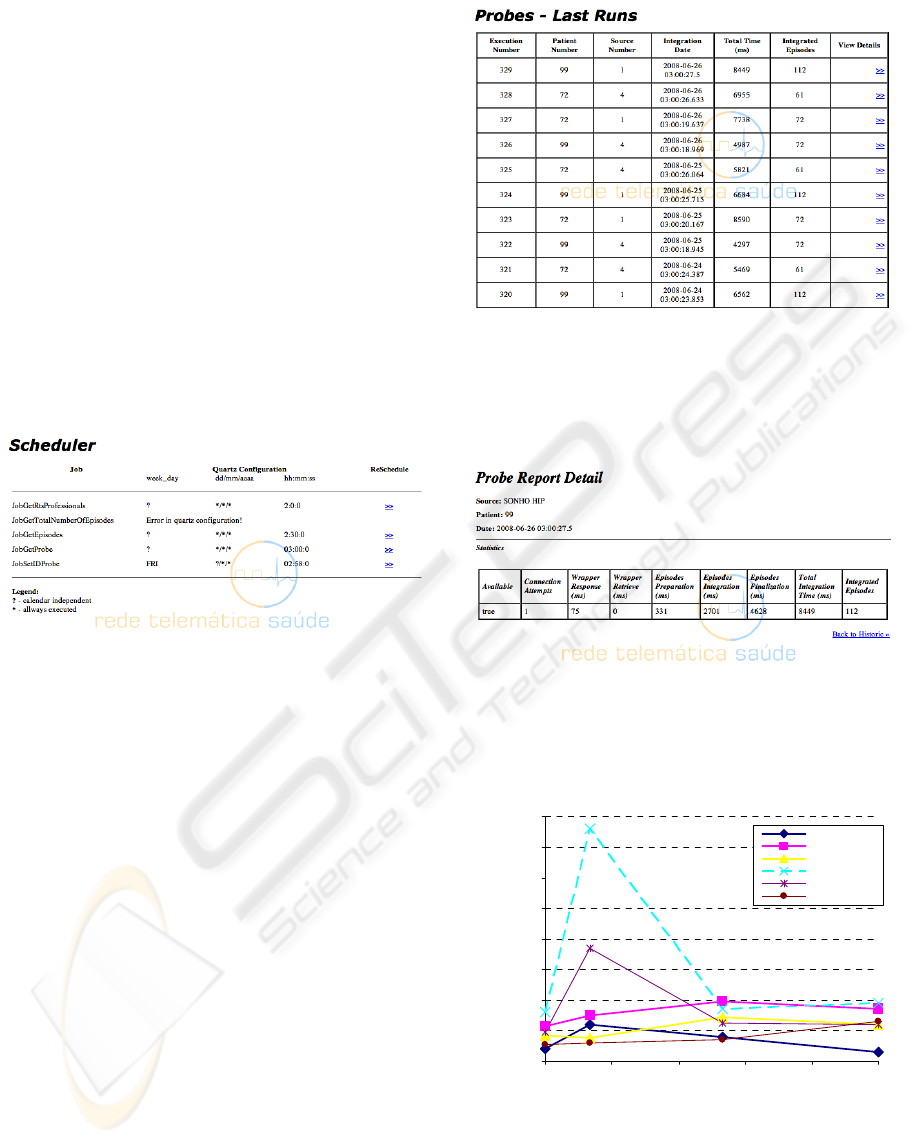
4.1 Scheduling the Distributed
Integration Processes
The first step is to use the tool to schedule the
processes we want to run, indicating the
chronometer time to fire them, as shown in Figure 3.
Figure 3: Scheduler Graphical Interface.
This interface shows the job to be scheduled and the
time configuration to each one of them. It shows the
day of week, hour, minute and second and day of the
year; all of these parameters are configurable.
Once processes are scheduled, using the web
interface, the system ensures that they are triggered
at the proper time, using the Quartz java library.
4.2 Sources Availability Probe results
The Figure 4 shows the tabular results view. This
table display, for each probe process, the patient
used to test the network, the source tested, the test
date, the total process time and the patient integrated
episodes. The last measure is used to calculate
relative times, as averages, to allow a regular
comparative analysis between sources. However, the
sub-processes aren’t shown here.
Figure 4: Tabular results interface.
The detailed view can be accessed through the
graphical interface, to allow an exhaustive process
analysis, as shown in
Figure 5.
Figure 5: Probe execution detail (first line in Figure 4).
Besides the tabular view, charts are also available.
The chart in Figure 6 depicts the probe process
execution results, for all sources in the network.
0
10000
20000
30000
40000
50000
60000
70000
80000
18-05-08 21-05-08 24-05-08 27-05-08 30-05-08 02-06-
0
Total time (ms)
S1@HIP
S1@HDA
S2@CS-Ilh
S2@CS-Vgs
S2@CS-Alb
S2@CS-Avr
Figure 6: Probe execution results (chart view), comparing
sources responses.
This graphic allows extracting network information:
it is clear that the source represented with dashed
line is taking more time than the others to execute
A MONITORING TOOLKIT FOR A DISTRIBUTED CLINICAL DATA INTEGRATION ENGINE
303
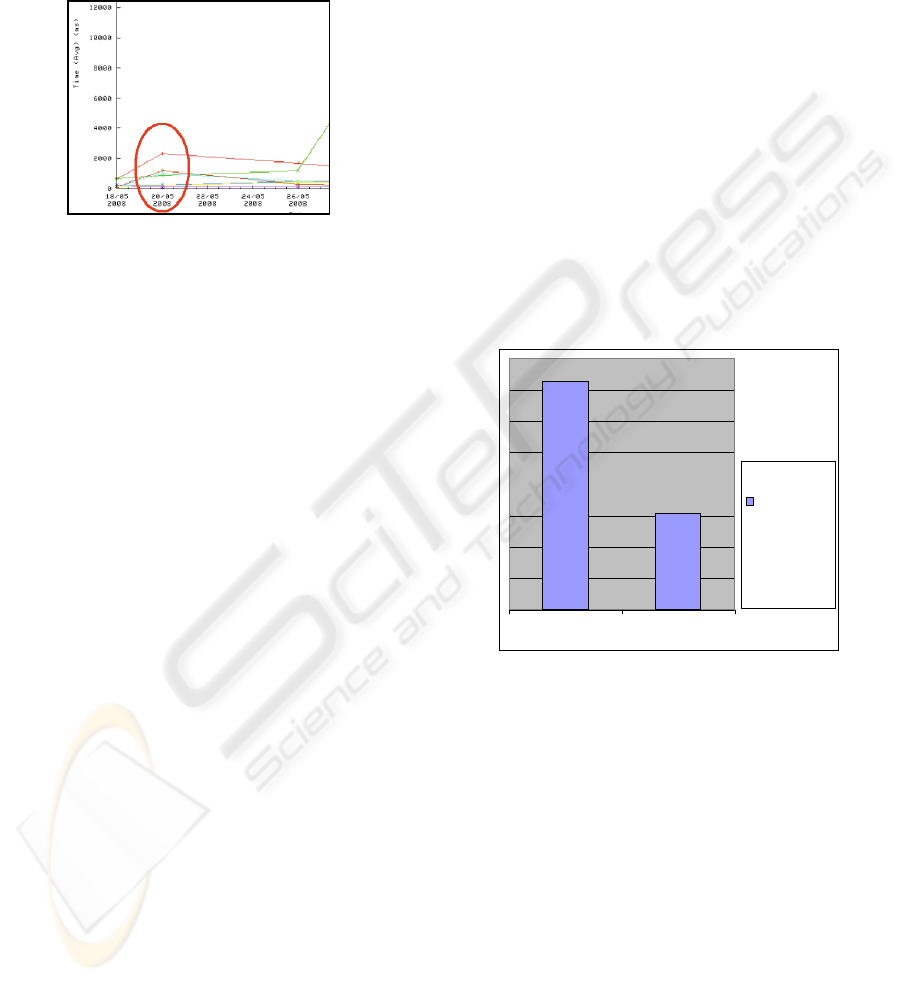
the probe test. This can be explained by looking at
Figure7, a relative measure graphic, which relates
the integration episode time to each source. This
measure is calculated dividing the total integrated
episodes by the total integration time, providing
comparable normalized values.
Figure 7: Comparison between sources performance,
taking into account the workload.
Figure 7 details the view of the day 20/05
executions. We can see that the reason why the
source was taking more time to execute the process
isn’t related to probe sub-process. We can see that
the source had a regular execution. So, the problem
is in the physical network, which made the
information to travel along the network more slowly
than other days.
This is an example of how this tool can be used.
There where problems in the network, which we are
able to identify, to know the reason and when they
happened.
4.3 Catalogue Integration Probe
Results
This process has a similar aim as sources availability
and network connectivity probe. This one aims to
sense the catalogue integration performance and
produce data to support decisions making about the
process. This process was executed over two
different algorithm approaches to the same
integration problem: the first one was a sub-optimal
and beta algorithm and the second one was an
improved version.
The first algorithm reconstructs the patient data
catalogue each time the source integration occurred.
This is a sub-optimal solution, because some data
already stored could be kept or updated, but ensures
that the catalogue gets the most recent view of
available patient data.
The second algorithm implements a strategy to
decide which data should be integrated, updated or
kept. Using this strategy, only the clinical data
changed in the sources is written into the catalogue:
other clinical data is kept and doesn’t need to be
reloaded. This incremental strategy allows a
performance optimization: only the data which is
effectively in need to be integrated flows in the
network reducing network traffic and the data
processing time.
The catalogue integration probe was expected to
reveal the differences between both algorithms and
show them in a useful way. As expected, we were
able to see the time differences, the process
performance and monitor the network behavior.
Figure 8 shows one of the results obtained: the
total catalogue integration time in both tested cases.
The integration time was reduced about 59% (about
10 hours). The time indicated was shown by the
monitoring toolkit, and the conclusion is that the
improved algorithm has a better performance than
the first version. The consequent decision was to
introduce this new version in the production
environment, to improve the total system
performance.
17:30
7:22
Full replace Incremental
Time spent
in a periodic
catalogue
update (in
hours)
Figure 8: Results obtained in monitoring toolkit, allowing
comparing integration time for each strategy.
5 CONCLUSIONS
The Monitoring Toolkit herein presented has proved
to be a valuable tool to control the network
availability and the processes which live on it. As
the system grows, the number of processes will grow
too, which implicates heavier system loads. The tool
is able to collect monitoring data to assist finding
performance bottlenecks and present these results
and trends through charts.
Unlike other general purpose system health
monitoring tools, for instance JMeter (by Apache
Jakarta Project, 2008), the RTS monitoring toolkit
herein present uses domain semantics to devise
HEALTHINF 2009 - International Conference on Health Informatics
304

monitoring work units. As an example, information
sources performance is established by running a
probing pre-defined patient cases integration job.
This tool is now running in production
environment, assisting the operations of the RTS
telematic health network. The next step is to
transform this monitoring tool in a real-time process,
endowing it of an intelligent failure recover process,
to minimize the data lose and to predict possible
system failures.
ACKNOWLEDGEMENTS
We would like to thank the active collaboration of
RTS consortium partners (Hospital Infante D. Pedro,
Hospital Distrital de Águeda and Sub-região de
Saúde de Aveiro). A special acknowledge is due to
Dr. Telmo Costa for is close engagement.
The presented work was financed by the “Aveiro
Digital” programme of the “Portugal Digital”
initiative and POSI programme of the Portuguese
Government.
REFERENCES
Tanenbaum, Andrew & Marteen van Steen, “Distributed
Systems: Principles and Paradigms”, 2002, Prentice
Hall.
Team, M.D., “MedCom -the Danish Health Care Data
Network”, M.o. Health, T.N.B.o Health, and D. Net,
Editors. 1999.
Petersen, M.E. and H.B. Jensen, “Danish national health
net and portal for citizens and professionals, in
European Comission Information Society and Media”.
2006
Katehakis, D.G., et al., “An Environment for the Creation
o an Integrated Electronic Health Record in
HYGEIAnet, the Rehional Telematics Network of
Crete”. 16th Annual Towards an Electronic Patient
Record Conference & Exhibition, 2000.
João Paulo Silva Cunha et al, “The RTS Project:
promoting secure and effective clinical telematic
information within the Aveiro Region”, 2006, eHealth
High Level Conference, Malaga (Spain)
Cunha, J.P. “RTS Network: Improving Regional Health
Services through Clinical Telematic Web-based
Communication System” in eHealth Conference 2007.
Berlin
Apache Jakarta Project, 2008, cited in 21-07-2008:
http://commons.apache.org/jelly/libs/quartz/tags.html
Apache Jakarta Project, 2008, cited in 27-10-2008:
http://jakarta.apache.org/jmeter/
A MONITORING TOOLKIT FOR A DISTRIBUTED CLINICAL DATA INTEGRATION ENGINE
305
