
GENETIC OPTIMIZATION OF CEPSTRUM FILTERBANK FOR
PHONEME CLASSIFICATION
Leandro D. Vignolo, Hugo L. Rufiner, Diego H. Milone
Grupo de Investigaci´on en Se˜nales e Inteligencia Computacional
Departamento de Inform´atica, Facultad de Ingenier´ıa y Ciencias H´ıdricas
Universidad Nacional del Litoral, CONICET, Argentina
John C. Goddard
Departamento de Ingenier´ıa El´ectrica, Iztapalapa
Universidad Aut´onoma Metropolitana, M´exico
Keywords:
Automatic speech recognition, Evolutionary computation, Phoneme classification, Cepstral coefficients.
Abstract:
Some of the most commonly used speech representations, such as mel-frequency cepstral coefficients, in-
corporate biologically inspired characteristics into artificial systems. Recent advances have been introduced
modifying the shape and distribution of the traditional perceptually scaled filterbank, commonly used for fea-
ture extraction. Some alternatives to the classic mel scaled filterbank have been proposed, improving the
phoneme recognition performance in adverse conditions. In this work we propose an evolutionary strategy as
a way to find an optimal filterbank. Filter parameters such as the central and side frequencies are optimized.
A hidden Markov model classifier is used for the evaluation of the fitness for each possible solution. Experi-
ments where conducted using a set of phonemes taken from the TIMIT database with different additive noise
levels. Classification results show that the method accomplishes the task of finding an optimized filterbank for
phoneme recognition.
1 INTRODUCTION
Automatic speech recognition (ASR) systems require
a preprocessing stage to emphasize the key features
of the phonemes, thereby allowing an improvement
in classification results. This task is usually accom-
plished using one of several different signal process-
ing techniques such as filterbanks, linear prediction or
cepstrum analysis (Rabiner and Juang, 1993). Many
advances have been conducted in the development of
alternative noise-robust feature extraction techniques
that are useful in ASR systems. Most popular fea-
ture representation currently used for speech recog-
nition is mel-frequency cepstral coefficients (MFCC)
(Davis and Mermelstein, 1980). MFCC is based on
a linear model of voice production together with the
codification on a psychoacoustic scale. This biologi-
cally inspired representation was hand-tunned during
several years of experimentation with ASR systems.
However, the question arises if they are really optimal
for this task. In this sense, Skowronski and Harris
(Skowronski and Harris, 2002; Skowronski and Har-
ris, 2003) introduced some modifications to the mel
scaled filterbank and reported experiments showing
considerable improvements over the MFCC feature
extraction technique.
A genetic algorithm (GA) is an optimization tech-
nique also inspired in the nature, so in this work we
will use it in order to find a better speech representa-
tion. We propose a new approach, called genetically
optimized cepstral coefficients (GOCC), in which a
GA is employed to optimize the filterbank used to
calculate the cepstral coefficients. To evaluate the
fitness of each individual, we incorporate a hidden
Markov model (HMM) as phoneme classifier. In this
HMM, the observations for each state are represented
by Gaussian mixtures (GM). The GOCC approach
is schematically outlined in Figure 1. The proposed
179
D. Vignolo L., L. Rufiner H., H. Milone D. and C. Goddard J. (2009).
GENETIC OPTIMIZATION OF CEPSTRUM FILTERBANK FOR PHONEME CLASSIFICATION.
In Proceedings of the International Conference on Bio-inspired Systems and Signal Processing, pages 179-185
DOI: 10.5220/0001552401790185
Copyright
c
SciTePress

Figure 1: General scheme of the proposed method.
method aims to find an optimal filterbank. A filter-
bank is optimal if it results in a better speech sig-
nal parameterization, improving phoneme classifica-
tion results. Similar approaches have been applied for
other tasks such as speaker verification (Charbuillet
et al., 2007a; Charbuillet et al., 2007b). With a sim-
ilar goal in mind, in (Vignolo et al., 2006) an opti-
mization strategy was also introduced in order to find
an optimal wavelet packet decomposition.
This paper is organized as follows. First we intro-
duce some basic concepts about GAs and give a brief
description of mel-frequency cepstral coefficients.
Next, we give the details of the proposed method and
explain its implementation. In the last sections, we
give the results of some conducted phoneme recogni-
tion experiments, a discussion about the recognition
results, the general conclusions, and finally some pro-
posals for future work.
1.1 Genetic Algorithms
Genetic algorithms (Holland, 1975) provide the flex-
ibility and robustness required to find satisfactory so-
lutions in complex search spaces (Goldberg, 1989).
This kind of algorithm also presents an implicit paral-
lelism that may be implemented in a number of ways
in order to increase the computational speed. Usu-
ally a GA consist of three operators: selection, ge-
netic operation and replacement (Tang et al., 1996).
The population is made up of a group of individu-
als whose information is coded in so-called chromo-
somes, and from which the candidates are selected
for the solution of a problem. Each individual perfor-
mance is represented by its fitness. This value is mea-
sured calculating the objective function in a decoded
form (called the phenotype). This function simulates
the selective pressure of the environment. A particu-
lar group of individuals (the parents) is selected from
the population to generate the offspring by using the
genetic operators. The present population is then re-
placed by the offspring. The GA cycle is repeated
until a desired termination criterion is reached (for ex-
ample, a predefined number of generations, a desired
fitness value, etc). After the evolution process the best
individual in the population is the desired solution for
the problem.
1.2 Cepstral Coefficients
The mel frequency cepstral coefficients are the most
commonly used alternative to represent speech sig-
nals, mainly because this technique finds uncorrelated
features appropriated for the HMM parameter estima-
tion. Moreover, MFCCs provide superior noise ro-
bustness in comparison with linear prediction based
feature extraction techniques (Jankowski et al., 1995).
Cepstral coefficients are obtained by taking the in-
verse Fourier transform (IFT) of the logarithmic spec-
trum of a signal:
c(n) = IFT{log
e
|FT{x(n)}|} (1)
Considering that the argument of the IFT is a real
sequence, the computation can be simplified by re-
placing the IFT with the cosine transform. In order
to combine the properties of cepstrum and the re-
sults about human perception of pure tones, it is usual
to band integrate the spectrum of a signal accord-
ing to mel scale before applying the cosine transform
(Deller et al., 1993). The mel scale is a perceptual
scale of fundamental frequencies judged by listeners
to be equal in distance from one another (Rabiner and
Juang, 1993). Figure 2 shows the mel scaled filter-
bank with 26 filters in the frequency range from 0 to
8kHz.
2 MATERIALS AND METHODS
This section describes the speech data, the prepro-
cessing method and the optimization strategy that is
proposed in this paper. The first subsection gives de-
tails about the cepstral coefficients computation and
the speech corpus used. In the next subsection the
GOCC method is explained.
2.1 Speech Corpus and Processing
For experimentation, phonetic speech data from the
TIMIT database (Garofalo et al., 1993) was used.
Speech signals were selected randomly from all di-
alect regions and phonetically segmented to obtain
individual files with the temporal signal of every
phoneme occurrence. Frames where extracted using a
Hamming window of 512 samples and a step-size of
256 samples. All possible frames within a phoneme
occurrence were extracted and padded with zeros if
necessary.
BIOSIGNALS 2009 - International Conference on Bio-inspired Systems and Signal Processing
180

0 1000 2000 3000 4000 5000 6000 7000 8000
0
0.2
0.4
0.6
0.8
1
Frequency [Hz]
Gain
Figure 2: Mel scaled filterbank in the frequency range from 0 to 8kHz.
Each individual in the GA population represents a
filterbank and the GOCCs are computed using them.
First, the frame spectrum is band integrated according
to the triangular filters, then the discrete CT is com-
puted from the log energy of these coefficients. Al-
though the number of filters in each filterbank is not
fixed, we take the first 16 DCT coefficients. Except
for a filterbank with less than 16 filters, in that case
the number of output coefficients would be equal to
the number of filters.
2.2 Genetically Optimized Cepstral
Coefficients
The mel scaled filterbank shown in Figure 2, and
used to compute cepstral coefficients, reveals that the
search for an optimal filterbank can involve adjusting
several of its parameters, such as: the shape, ampli-
tude, position and size of each filter. However, try-
ing to optimize all of these parameters at once turns
out to be extremely complex, so we decided to main-
tain some of these parameters fixed. We carried out
the optimization by considering non-symmetrical tri-
angular filters, determined by three parameters each.
These three parameters correspond to the frequency
values where the triangle for the filter begins, where
the triangle reaches its maximum, and finally where
it ends. We also optimize the number of filters in the
filterbank by adding one more gene to the chromo-
some. Hence, the length of each chromosome equals
the maximum number of filters allowed in a filter-
bank, multiplied by three, plus one. This last element
in the chromosome indicates the number of active fil-
ters. In other approaches (Charbuillet et al., 2007b),
polynomial functions were used to encode the param-
eters which were optimized. Here, in contrast, all
the parameters are directly coded in the chromosome.
This way the search is simpler and the parameters are
directly related to the features being optimized.
Each chromosome represents a different filter-
bank, and they are initialized with a random num-
ber of active filters. In the initialization, the position
of the active filters in a chromosome is also random
and follows a uniform distribution over the frequency
bandwidth from 0 to 8000 Hz. The position, deter-
mined in this way, sets the frequency where the trian-
gle of the filter reaches its maximum. Then, a Gaus-
sian distribution centered on this position is used to
initialize the other two free parameters of the filter.
Although the search space could be further reduced
by restricting the size and overlap between filters, in
our approach these features are left unrestricted. Be-
fore genetic operators are applied, the filters in ev-
ery chromosome are sorted by increasing order with
respect to their central position. A chromosome is
coded as a string of integers and the range of values is
determined by the number of samples in the frequency
domain.
The GA uses the roulette wheel method of selec-
tion, and elitism is incorporated into the search in or-
der to reduce the convergence time. The elitist strat-
egy consists in maintaining the best individual from
one generation to the next without any perturbation.
The genetic operators used in the GA are mutation
and crossover, and they were implemented as follows.
Mutation of a filter consists in the random displace-
ment of one of its frequency parameters, and this
modification is made using a Gaussian distribution.
The standard deviation of this distribution is reduced
as the evolution progresses. It should be noted that
the mutation operator can also change, with the same
probability, the number of filters composing a filter-
bank. A one-point crossover operator interchanges
complete filters between different chromosomes.
The selection of individuals is also conducted by
considering the filterbank represented by the chromo-
some. The selection process should assign greater
probability to the chromosomes providing the better
signal representations, and these will be those that
obtain better classification results. The proposed fit-
GENETIC OPTIMIZATION OF CEPSTRUM FILTERBANK FOR PHONEME CLASSIFICATION
181
0 1000 2000 3000 4000 5000 6000 7000 8000
0
0.2
0.4
0.6
0.8
1
Frequency [Hz]
Gain
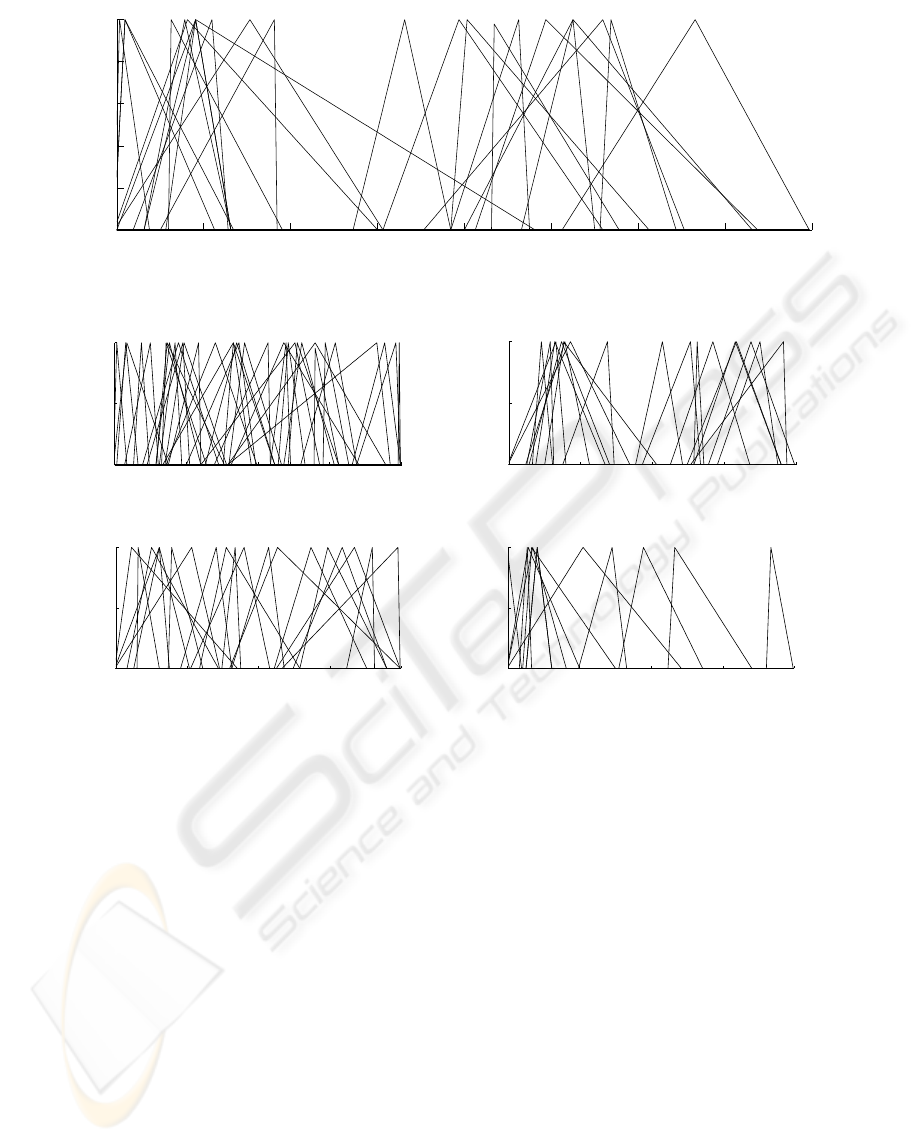
Figure 3: Best optimized filterbank (23 filters).
0 2000 4000 6000 8000
0
0.5
1
Frequency [Hz]
Gain
(a) OFB 1 (35 filters).
0 2000 4000 6000 8000
0
0.5
1
Frequency [Hz]
Gain
(b) OFB 2 (18 filters).
0 2000 4000 6000 8000
0
0.5
1
Frequency [Hz]
Gain
(c) OFB 3 (19 filters).
0 2000 4000 6000 8000
0
0.5
1
Frequency [Hz]
Gain
(d) OFB 4 (12 filters).
Figure 4: Optimized filterbanks.
ness function consists of a phoneme classifier, and the
recognition rate is the fitness value for the evaluated
individual. In order to compare the results to those of
state of the art speech recognition systems, we used
a phoneme classifier based on HMM with Gaussian
mixtures. This fitness function uses tools from the
HMM Toolkit (Young et al., 2000) for building and
manipulating hidden Markov models. These tools
rely on the Baum-Welch algorithm (Jelinek, 1999)
that is used to find the unknown parameters of an
HMM and on the Viterbi algorithm (Huang et al.,
1990) for finding the most likely state sequence given
the observed events.
3 RESULTS AND DISCUSSION
In the experiments, the English phonemes /b/, /d/,
/eh/, /ih/ and /jh/ from TIMIT corpus were considered.
The occlusive consonants /b/ and /d/ are included be-
cause they are very difficult to distinguish in different
contexts. The phoneme /jh/ presents special features
of the fricative sounds. The vowels, /eh/ and /ih/ are
commonly chosen because they are close in the for-
mant space. This group of phonemes was selected
because they compose a set of classes which is diffi-
cult to classify (Stevens, 2000).
For the experiments, the number of states in the
HMM was fixed to three, and the number of Gaus-
sians was set to four. The optimization was carried
out using a training set of 400 examples per phoneme
class and a test set of 100 examples per phoneme
class. These sets where chosen randomly from all
the dialect regions included in the TIMIT database.
In order to obtain general results, the best filterbanks
found were further tested using ten different parti-
tions of 1000 (training) and 300 (testing) examples
per class. Optimized filterbanks were trained and
tested ten times using different data partitions, and
BIOSIGNALS 2009 - International Conference on Bio-inspired Systems and Signal Processing
182
average classification results were obtained. For the
GA, the population size was set to 100 individuals
while crossover and mutation rates were set to 0.7 and
0.09 respectively. The maximum number of filters in
a filterbank was fixed to 36.
Different optimizations were performed using
data with ∞ dB (clean data) and 0 dB of signal to
noise ratio (SNR). After evolution selected filterbanks
were tested in the classification of signals with differ-
ent levels of noise. These tests included data with ad-
ditive white noise for −5 dB, 0 dB, 20 dB, 50 dB and
∞ dB of SNR.
The best optimized filterbank (OFB) was obtained
when training with 0 dB SNR data and has 23 filters
(Figure 3). It gave a classification rate of 77.2% on
the test data set used during evolution, while a stan-
dard mel scaled filterbank gave a classification rate
of 75.4% for the same data set. This filterbank was
found in only 10 generations and the evolution was
terminated after 110 generations by the convergence
criterion.
Figure 4 shows four different filterbanks that
where obtained training with clean speech in the op-
timization. As we can see, one feature they all have
in common is the grouping of a relatively high num-
ber of filters in the frequency band from 0 Hz to 3000
Hz. Another common feature of the optimized filter-
banks is the wider bandwidth of most of the filters,
compared with the mel scaled filterbank. This coin-
cides with the study in (Skowronski and Harris, 2004)
about the effect of wider filter bandwidth on noise ro-
bustness.
Table 1 shows confusion matrices for 0 dB and ∞
dB SNR comparing the best filterbank obtained with
the mel scaled filterbank. These results were obtained
from a cross validation using ten different data parti-
tions. It is noticeable that for both cases the phonemes
are similarly confused, but there is a large difference
between the classification rates for phoneme /b/ at 0
dB SNR. In these confusion matrices, each value in-
dicates the number of classified phonemes, instead of
percentages. Here, as we used ten sets of 300 pat-
terns for testing, the maximum classification value per
phoneme is 3000.
It is remarkable that the different optimized filter-
banks achieved similar performance despite the no-
ticeable difference in the number of filters. As we can
see from Table 2, the OFB 5 (Figure 3) outperforms
the mel scaled filterbank for all SNR considered in
the experiments. Moreover, OFB 1 and OFB 3 out-
perform OFB 5 for 20 dB SNR and ∞ dB SNR re-
spectively. It is important to note that, in these exper-
iments, the filterbank that was optimized for signals
with noise performed better than the ones that were
optimized for clean speech.
Table 2 lists average classification rates from test-
ing the filterbanks in Figures 3 and 4 over ten different
data partitions. This table also compares results ob-
tained with standard mel scaled filterbank and LPC.
The reference (mel scaled filterbank) consisted of 26
filters and the order for LPC was set at 14. These val-
ues where chosen because they gave the best results.
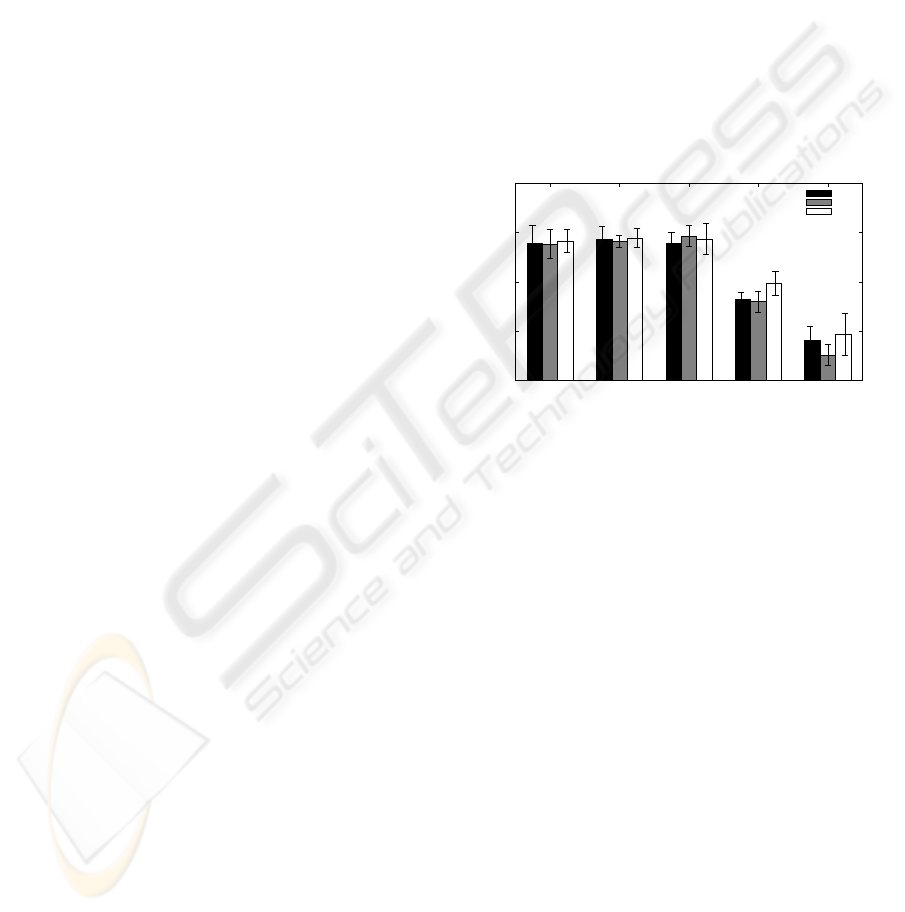
Figure 5 shows the average classification rates
comparing the performanceof OFB 1 and OFB 5 with
the performance of the mel scaled filterbank. The
variance on the classification rate is indicated, allow-
ing to appreciate the improvements of OFB 5 over the
mel scaled filterbank for 0 dB SNR. On the performed
tests, the optimized filterbanks and the mel scaled fil-
terbank gave similar variance on the classification rate
for every data partition.
Clean data 50 dB SNR 20 dB SNR 0 dB SNR −5 dB SNR
65
70
75
80
85
Noise level
Percent correct
MFCC
OFB 1
OFB 5
Figure 5: Performance of OFB 1 and OFB 5 compared with
the mel scaled filterbank.
In order to evaluate the statistical significance of
these results, we have estimated the probability that a
given filterbank is better than the mel scaled filterbank
(reference). To perform this test we have assumed the
statistical independence of the classification errors for
each phoneme and we have approximated the bino-
mial distribution of the errors by means of a Gaussian
distribution. This is possible because we have a large
number of phonemes in the test set (15000 patterns,
if we take into account all the test partitions). In the
case of 20 dB SNR, the probability that OFB 1 per-
forms better than the mel scaled filterbank is higher
than 94.15%. And, in the case of 0 dB SNR, the prob-
ability that OFB 5 performs better than the mel scaled
filterbank is higher than 99.85%.
4 CONCLUSIONS AND FUTURE
WORK
A new method has been proposed for optimizing a
filterbank, in order to produce a cepstral representa-
tion that improves the classification of speech signals.
GENETIC OPTIMIZATION OF CEPSTRUM FILTERBANK FOR PHONEME CLASSIFICATION
183
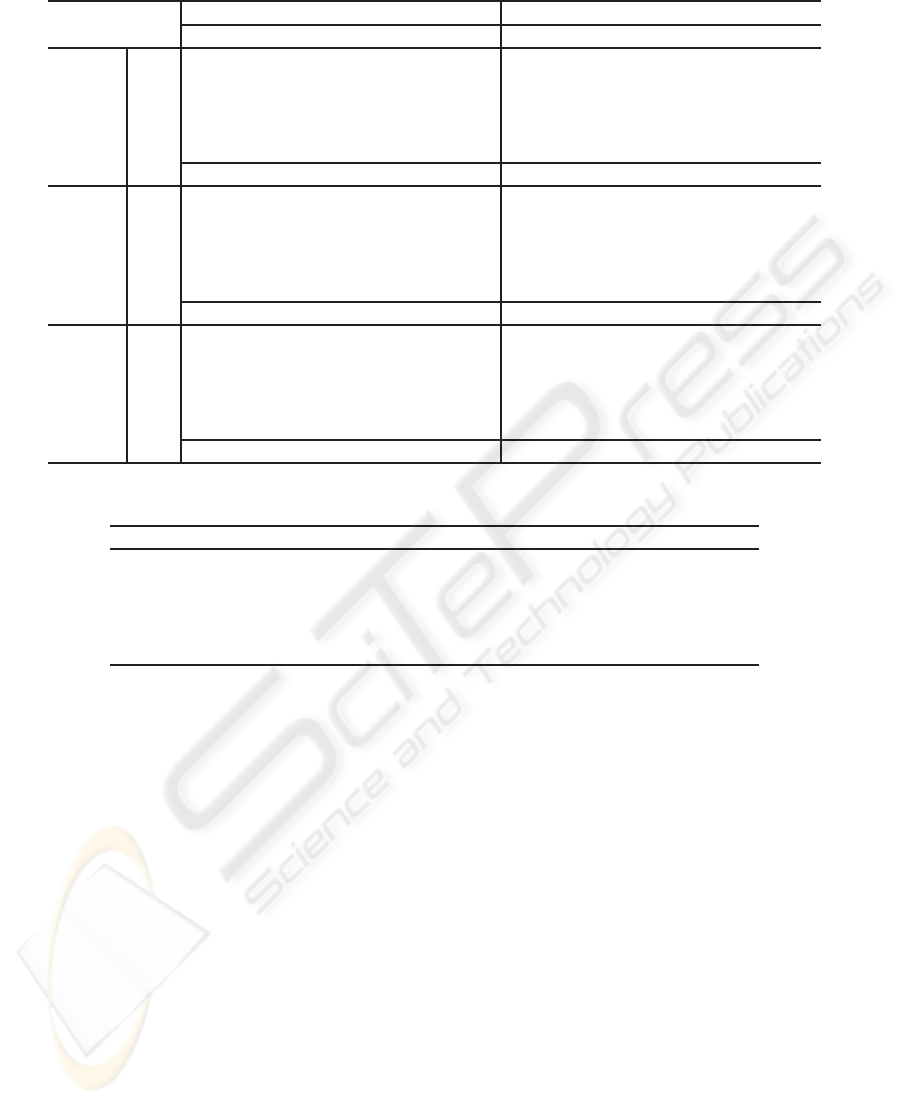
Table 1: Confusion matrices for SNR ∞, 0 and −5 dB. Number of classified patterns.
Mel scaled filterbank (Fig. 2) Best OFB (Fig. 3)
/b/ /d/ /eh/ /ih/ /jh/ /b/ /d/ /eh/ /ih/ /jh/
∞ dB
/b/ 2432 549 7 5 7 2431 526 22 8 13
/d/ 636 2125 3 22 214 702 2076 4 35 183
/eh/ 4 19 2323 650 4 10 14 2423 553 0
/ih/ 8 67 716 2202 7 16 12 813 2159 0
/jh/ 7 222 0 12 2759 11 199 2 7 2781
Total: 78.94% Total: 79.13%
0 dB
/b/ 2105 810 14 38 33 2317 627 27 15 14
/d/ 755 1928 3 17 297 773 1942 1 19 265
/eh/ 0 50 2209 728 13 13 49 2173 764 1
/ih/ 2 131 698 2132 37 11 151 624 2209 5
/jh/ 8 334 3 42 2613 12 373 2 28 2585
Total: 73.25% Total: 74.84%
−5 dB
/b/ 1866 973 15 56 90 2018 851 15 39 77
/d/ 809 1740 4 24 423 769 1797 2 21 411
/eh/ 0 37 2082 835 46 1 61 2015 905 18
/ih/ 2 92 725 2069 112 0 136 759 2046 59
/jh/ 10 287 52 56 2595 12 327 48 43 2570
Total: 69.01% Total: 69.64%
Table 2: Average recognition rates (%) from ten data partitions.
MFCC LPC OFB 1 OFB 2 OFB 3 OFB 4 OFB 5
∞ dB SNR 78.94 71.20 78.85 78.49 79.43 79.41 79.13
50 dB SNR 79.31 71.39 79.10 78.33 79.27 78.39 79.46
20 dB SNR 78.96 76.09 79.67 77.80 79.54 78.13 79.33
0 dB SNR 73.25 72.23 73.00 70.59 71.08 68.26 74.84
−5 dB SNR 69.01 65.68 67.56 62.59 64.10 62.03 69.64
This technique provides a new alternative to classical
approaches, such as those based on a mel scaled fil-
terbank or linear prediction, and may prove useful in
automatic speech recognition systems.
The results of the experiments conducted show
that the proposed approach meets the objective of
finding a more robust signal representation. This sig-
nal representation facilitates the task of the classifier
because it properly separates the phoneme classes,
thereby improving the classification rate. Moreover,
the use of this optimal filterbank improves the perfor-
mance of an ASR system with no additional compu-
tational cost. These results also suggest that there is
more room for improvement over the psychoacoustic
scaled filterbank.
In future work, the utilization of other search
methods, such as particle swarm optimization and
scatter search will be studied. Different genetic op-
erators can also be considered as a way to improve
the results of the GA. Moreover, the search for an
optimal filterbank could be carried out by optimiz-
ing different parameters. In this sense, for example,
the position and length of the filters could be fixed
as a mel scaled filterbank, while performing the op-
timization on the individual filter gain. Clearly, the
optimization of the gain of individual filters can also
be combined with the optimization that we carried
out in the present approach, however, this results in
a more complex search. Phoneme classification re-
sults could be further improved computing delta and
acceleration coefficients for the different filterbanks
(Lai et al., 2006).
ACKNOWLEDGEMENTS
The authors wish to thank the support of: the Univer-
sidad Nacional de Litoral (with UNL-CAID 012-72),
the Agencia Nacional de Promoci´on Cient´ıfica y Tec-
nol´ogica (with ANPCyT-UNL PICT 11-25984 and
ANPCyT-UNER PICT 11-12700) and the Consejo
Nacional de Investigaciones Cient´ıficas y T´ecnicas
(CONICET) from Argentina. The authors are also
grateful to the Mexican Council of Science and Tech-
BIOSIGNALS 2009 - International Conference on Bio-inspired Systems and Signal Processing
184

nology (CONACYT) and the Argentinian Ministry of
Science and Technology (SECYT) for their support to
the project ME/PA03-EXI/031.
REFERENCES
Charbuillet, C., Gas, B., Chetouani, M., and Zarader, J.
(2007a). Complementary features for speaker veri-
fication based on genetic algorithms. In Acoustics,
Speech and Signal Processing, 2007. ICASSP 2007.
IEEE International Conference on, volume 4, pages
IV–285–IV–288.
Charbuillet, C., Gas, B., Chetouani, M., and Zarader, J.
(2007b). Multi Filter Bank Approach for Speaker Ver-
ification Based on Genetic Algorithm, pages 105–113.
Davis, S. V. and Mermelstein, P. (1980). Comparison
of parametric representations for monosyllabic word
recognition in continuously spoken sentences. IEEE
Transactions on Acoustics, Speech and Signal Pro-
cessing, 28:57–366.
Deller, J. R., Proakis, J. G., and Hansen, J. H. (1993).
Discrete-Time Processing of Speech Signals. Macmil-
lan Publishing, NewYork.
Garofalo, J. S., Lamel, L. F., Fisher, W. M., Fiscus, J. G.,
Pallett, D. S., and Dahlgren, N. L. (1993). Darpa
timit acousticphonetic continuous speech corpus cd-
rom. Technical report, U.S. Dept. of Commerce,
NIST, Gaithersburg, MD.
Goldberg, D. E. (1989). Genetic Algorithms in Search, Op-
timization, and Machine Learning. Addison-Wesley
Professional.
Holland, J. H. (1975). Adaptation in natural and artificial
systems: An introductory analysis with applications to
biology, control, and artificial intelligence. University
of Michigan Press.
Huang, X. D., Ariki, Y., and Jack, M. A. (1990). Hidden
Markov Models for Speech Recognition. Edinburgh
University Press.
Jankowski, C. R., Vo, H. D. H., and Lippmann, R. P. (1995).
A comparison of signal processing front ends for auto-
matic word recognition. IEEE Transactions on Speech
and Audio Processing, 4(3):251–266.
Jelinek, F. (1999). Statistical Methods for Speech Recogni-
tion. MIT Press, Cambrige, Masachussets.
Lai, Y.-P., Siu, M., and B., M. (2006). Joint optimiza-
tion of the frequency-domain and time-domain trans-
formations in deriving generalized static and dynamic
mfccs. Signal Processing Letters, IEEE, 13:707–710.
Rabiner, L. and Juang, B.-H. (1993). Fundamentals of
Speech Recognition. Prentice Hall PTR.
Skowronski, M. and Harris, J. (2002). Increased mfcc fil-
ter bandwidth for noise-robust phoneme recognition.
Proceedings of the IEEE International Conference on
Acoustics, Speech, and Signal Processing (ICASSP),
1:I–801–I–804.
Skowronski, M. and Harris, J. (2003). Improving the filter
bank of a classic speech feature extraction algorithm.
In Proceedings of the 2003 International Symposium
on Circuits and Systems (ISCAS), volume 4, pages IV–
281–IV–284.
Skowronski, M. and Harris, J. (2004). Exploiting indepen-
dent filter bandwidth of human factor cepstral coeffi-
cients in automatic speech recognition. The Journal of
the Acoustical Society of America, 116(3):1774–1780.
Stevens, K. N. (2000). Acoustic Phonetics. Mit Press.
Tang, K., Man, K. F., Kwong, S., and He, Q. (1996). Ge-
netic algorithms and their applications. IEEE Signal
Processing, 13(6):22–29.
Vignolo, L., Milone, D., Rufiner, H., and Albornoz, E.
(2006). Parallel implementation for wavelet dictio-
nary optimization applied to pattern recognition. In
Proceedings of the 7th Argentine Symposium on Com-
puting Technology, Mendoza, Argentina.
Young, S., Kershaw, D., Odell, J., Ollason, D., Valtchev, V.,
and Woodland, P. (2000). HMM Toolkit. Cambridge
University.
GENETIC OPTIMIZATION OF CEPSTRUM FILTERBANK FOR PHONEME CLASSIFICATION
185
