
MEDICAL DEVICE PERFORMANCE IN IEEE 802.11 NETWORKS
Evaluating IEEE P11073.1.1 Use Case Scenarios in Wireless LANs
Amjad Soomro and Ruediger Schmitt
Philips Research North America, 345 Scarborough Road, Briarcliff Manor, NY 10510, U.S.A.
Keywords:
IEEE 802.11, IEEE P11073, IEEE P11073.1.1, 11073, 11073.1.1, WLAN, Wi-Fi, Medical use cases.
Abstract:
We study in this paper use of IEEE 802.11 wireless technologies for medical devices. The simulated use cases
are derived from the ones specified in IEEE P11703.1.1 document. We consider the use cases where a WLAN
using IEEE 802.11 is providing connectivity to medical, voice (VoIP) and IT applications simultaneously. This
use case is interesting to hospitals because it provides potential cost savings. We model IEEE 802.11e QoS
features and we use a wireless channel model with high and stable SNR to observe MAC protocol behavior.
Our results indicate that QoS of medical and VoIP devices is met when they operate in dedicated channels, that
is, without any IT and in good channel conditions. The inclusion of background IT load, affects QoS of both
medical devices and VoIP. We quantify the performance improvement for medical devices when using IEEE
802.11 voice category and compare it with using best-effort category. The power consumption of wireless
devices is not considered in this work.
1 INTRODUCTION
Use of wireless networking technologies in medical
environments is attractive due to the benefits it pro-
vides to patients, hospitals and care providers. For ex-
ample, it alleviates the need for healthcare providers
to be near patients, enable ambulation of patients for
faster recovery and regular and frequent monitoring
of patient’s vital signs. The wireless technologies
also enable integration of patient data in electronic
health records. It is attractive for hospitals to use
wireless technologies because it gives them flexibil-
ity to place and use medical equipment while reduc-
ing the chances of error due to increasing wire clut-
ter around patients. In home care scenarios it pro-
vides the convenience of connecting patient moni-
toring data to care givers while providing ease-of-
use. Furthermore, ubiquitous availability of wire-
less technologies makes it possible to provide health-
care services anytime, anywhere (IEEE Std P11073-
00101/D04, 2008; Istepanian et al., 2004).
However, unlike in wired communications where
typical available bandwidths are far in excess of needs
of medical equipment, a wireless network capacity is
often much lower and dependent on the wireless sig-
nal strength and signal-to-noise ratio (SNR) within a
coverage area. The dynamic nature of wireless chan-
nels affects the quality-of-service (QoS) provided to
medical equipment and it is critical to satisfy QoS for
life-critical medical applications, such as telemetry.
Also, whereas, in the past, bandwidths for medical ap-
plication were typically isolated and reserved by us-
ing VLAN (virtual local area network) technologies
and dedicated infrastructure, the wireless channel is
often used, or desired to be used and shared, by non-
medical applications such as email and web access. A
motivation for sharing the existing installed wireless
technologies with medical applications is significant
cost savings achieved by doing so (Soomro and Cav-
alcanti, 2007).
Due to the fact that different medical applications
have different QoS requirements and service level
agreements (SLA) requirements, the dynamic nature
of capacity/throughput of a wireless channel and va-
riety of non-medical applications with varying data
traffic characteristics, it is a non-trivial task to esti-
mate whether a given network would be able to sup-
port, in terms of QoS, a set of medical applications,
with a given wireless technology and channel condi-
tions and in presence of some set of non-medical IT
applications. The theoretical analysis provides some
insight (Mangold et al., 2003), however, the assumed
network traffic conditions to arrive at the analytical
results do not correspond well with the expected use
case scenarios (Cavalcanti et al., 2007). Whereas,
311
Soomro A. and Schmitt R. (2009).
MEDICAL DEVICE PERFORMANCE IN IEEE 802.11 NETWORKS - Evaluating IEEE P11073.1.1 Use Case Scenarios in Wireless LANs.
In Proceedings of the International Conference on Health Informatics, pages 311-316
DOI: 10.5220/0001552603110316
Copyright
c
SciTePress

an experimental setup can also provide insights, it
is costly, labor intensive and it usually takes much
longer time than simulations. For example, it takes a
large amount of effort to assemble and configure large
number of terminals to use a particular set of applica-
tions. Moreover, it is often a non-trivial task to mea-
sure QoS parameters, such as delays and throughput
from live terminals. Therefore, we study the perfor-
mance in selected scenarios through network simula-
tions and compare the results. We use OPNET Mod-
eler software to do the wireless network simulations.
In this article, we first give an overview of the
use case scenarios considered in IEEE P11073.1.1
standard - Guidelines for the Use of RF Technology
(IEEE Std P11073-00101/D04, 2008). We focus on
802.11 (Wi-Fi) technologies and its performance, and
therefore, we will cover in greater detail the use cases
which are expected to use WLAN technology and
stress the network. In section 2 we give a summary
of uses cases described in the IEEE P11073.1.1 stan-
dard. An overview of IEEE 802.11 technology and
different features which could provide capabilities to
differentiate medical traffic and provide the needed
QoS is also given in this section. In section 3 we
describe the simulation model and scenarios that we
used to study and compare the performance achieved
with different 802.11 protocol modes, the number of
devices and the simulated medical and non-medical
applications. In section 4 we present and discuss our
simulation results. Finally, we end the paper with
concluding remarks in section 5.
2 IEEE P11073.1.1 USE CASE
SCENARIOS
IEEE P11073 group has undertaken effort to develop
guidelines for the use of RF wireless technologies
for point-of-care medical devices and it will be avail-
able as IEEEP1073.1.1 document (IEEE Std P11073-
00101/D04, 2008). The goal of the document is to
provide better understanding among all stake hold-
ers, for example, hospitals, care givers and patients
by having common view of the wireless technologies.
A review of the available and emerging wireless tech-
nologies, their capabilities and limitations, the ways
to configure/specify each, the relevant medical de-
vices and applications for each technology, and costs
and drawbacks are covered in the document. More-
over, the document includes several generic models
of typical healthcare use cases which could be used
to analyze, evaluate, compare and optimize differ-
ent wireless technologies and modes, or parameters
within each, for the intended use cases.
2.1 Use Case Overview
The IEEE P11073.1.1 standard has outlined several
use case scenarios which highlight the data charac-
teristics and QoS needs of the medical applications,
the number and type of such and network configura-
tions in which they are expected to be served. The
standard lists nine use case scenarios and they are:
1) Personal (Home/Mobile) Monitoring; 2) Sub-acute
cases involving telemetry and basic vital signs moni-
toring for a single patient in a room; 3) and 4) Increas-
ing complexity compared with (2) and ambulatory pa-
tients; 5) Cardiac patient moving through three areas;
6) Critical burn patient tracked from MedEvac to ER
to ICU through recovery; 7) Rescue and MedEvac;
8) Ancillary; and 9) Maternity. The reader is referred
to Appendix A in (IEEE Std P11073-00101/D04,
2008) for more details of these scenarios.
In this article we focus on the wireless local
area networking (WLAN) technologies, that is, IEEE
802.11 wireless networking, and, therefore, would
present the use cases where this technology is ex-
pected to be used. Among the use cases given in
(IEEE Std P11073-00101/D04, 2008), the use case 4
stresses the network most and in this case it is ex-
pected that trends of performance achievable in dif-
ferent IEEE 802.11 modes of the operation would be
easily observed. Therefore, we describe the use case
4 in detail next.
In the use case 4 there are sixteen patients and
each patient has some medical devices connected to
it. A patient is outfitted with a ambulatory monitoring
device, PWD (patient worn device), which transmits
5 ECG vectors. In addition to ECG, episodic SpO
2
and blood pressure measurements are transmitted rel-
atively infrequently; 1 and 15 min intervals, respec-
tively. There are wrist RFID (radio frequency identifi-
cation) tags, Nurse PDA, laptop PCs and VoIP (voice-
over-IP) phones expected to operate in the scenario
as well. Since, we consider IEEE 802.11 networks
only; we exclude RFID and other technologies using
non WLAN networking from the scenarios we have
simulated. The QoS requirement for PWD is max-
imum latency of less than 500 ms and for VoIP the
max latency should be less than 100 ms. Our objec-
tive in the simulation runs is to estimate the expected
performance and QoS when WLAN is operating in
the offered load environment. Since, applications like
episodic SpO
2
and blood pressure measurements have
very low throughput requirements, we do not include
these in our simulation; doing so, does not affect the
general observations we make about the performance
HEALTHINF 2009 - International Conference on Health Informatics
312
obtained in the scenarios.
2.2 Brief overview of IEEE 802.11
The IEEE 802.11 standard (IEEE Std. 802.11, 2007),
also known as Wi-Fi, specifies a single medium ac-
cess control (MAC) protocol and multiple physical
layer (PHY) modes. The 802.11 b and g modes op-
erate in the 2.4 GHz band at data rates up to 11 Mb/s
and 54 Mb/s, respectively, whereas the 802.11a PHY
mode supports up to 54 Mb/s in the 5 GHz band. The
legacy standard works by using CSMA/CA protocol
in which the stations sense the channel before trans-
mitting a packet. This is implemented by a Dis-
tributed Coordination Function (DCF) and most cur-
rent IEEE 802.11 products use this mode. If multi-
ple transmissions overlap, the stations retry after ran-
domly selected backoff periods.
Subsequently, the 802.11e amendment (IEEE Std.
802.11e, 2005) has been proposed to enable QoS
support in 802.11. The 802.11e amendment de-
fines two basic mechanisms for QoS support, namely:
Enhanced Distributed Channel Access (EDCA) and
Hybrid Coordination Function Controlled Channel
Access (HCCA). In this work we consider the
EDCA mechanism, which provides prioritized QoS
by defining four access categories: voice (AC VO),
video (AC VI), best-effort (AC BE) and background
(AC BK) traffic. Up to four backoff entities operate
independently in a singe station, and each has its own
MAC layer queue. Each backoff entity is associated
with an access category and contends for the channel
with different priorities. The different access priori-
ties are realized by setting the following MAC layer
parameters: i) arbitration interframe space (AIFS),
which is the interval of time the medium has to be
idle before a backoff entity initiates a frame trans-
mission or starts counting down its backoff-counter;
ii) minimal and maximal contention window (CWmin
and CWmax), which determines the initial and max-
imum range of random backoff counter, respectively;
and iii) transmission opportunity limit (TXOP limit),
which is the duration during which the TXOP holder
maintains uninterrupted control of the medium.
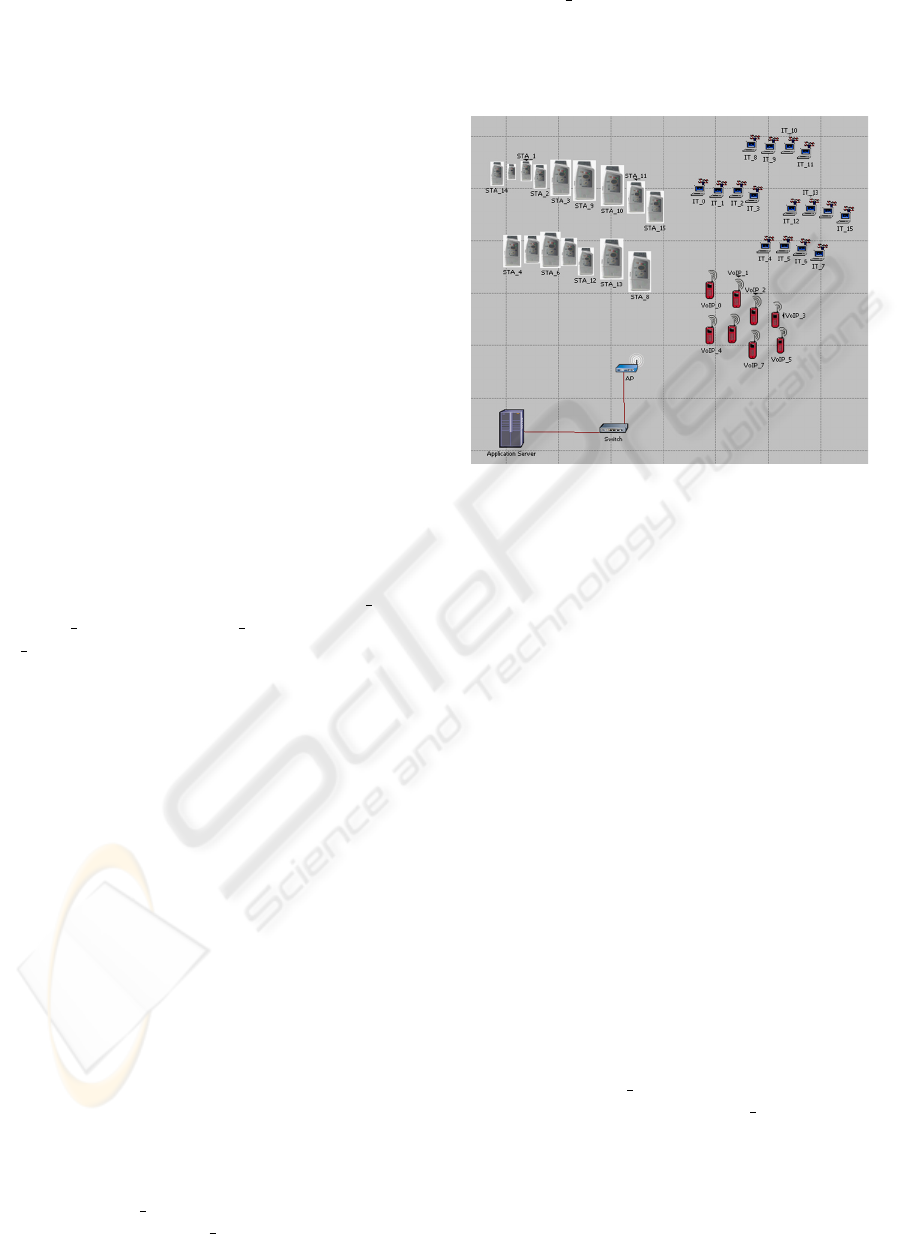
3 SIMULATION ENVIRONMENT
We have simulated wireless networking scenarios us-
ing a customized 802.11e OPNET Modeler simula-
tion model. Figure 1 shows the simulated wireless
network configured as in scenario 3. In the model,
the terminals ‘STA x’ represent PWDs and VoIP ter-
minals are labeled as ‘VoIP x’. The terminals repre-
sented as ‘IT x’ run IT applications, such as, email
clients, web access clients, telnet sessions and are en-
gaged in file transfers using FTP protocol. The wire-
less access point is labeled as ‘AP’ and it is connected
to the application server through an ethernet switch.
Figure 1: Simulated network configured as in scenario 3.
3.1 Applications and Scenarios
Table 1 lists the applications, the transport layer pro-
tocol used, the size of the respective transmitted ob-
jects, the objects’ inter-arrival times (IAT), the appli-
cation data rate and the traffic direction (UP: client
to server, DN: server to client). As can be seen, the
medical application, PWD, which includes one uplink
traffic flow from the client device to a medical server,
which is connected to the WLAN through an ethernet
switch. The VoIP traffic is modeled after VoIP phones
running the commonly used G.711 voice codec. For
IT traffic, we have considered a mix of FTP, E-mail,
HTTP, and Telnet applications. Thus, each IT station
used in our simulations includes all four applications
that form the IT profile.
There are eight different simulation scenarios
which are summarized in Table 2. A set of four sce-
narios labeled 1 through 4 is run at the 802.11b PHY
rates 5.5 Mbps, labeled ‘a’ and 11 Mbps, labeled ‘b’.
The respective PHY rates are used by all wireless
nodes in a particular scenario. Throughout the sim-
ulations the VoIP traffic always uses the EDCA voice
access category (AC VO) and the IT traffic always
uses best effort access category (AC BE). The medi-
cal traffic uses either the EDCA voice category or the
EDCA best effort category or DCF when using legacy
IEEE 802.11. The IEEE 802.11 parameters used in
simulations are given in Table 3.
Scenario 1 serves as a baseline scenario for PWD
MEDICAL DEVICE PERFORMANCE IN IEEE 802.11 NETWORKS - Evaluating IEEE P11073.1.1 Use Case Scenarios
in Wireless LANs
313

Table 1: Simulated Applications.
APP LINK
TRANS-
PORT
OBJECT
SIZE
(bytes)
IAT*
(ms)
RATE
(kbps)
PWD UP UDP Packet 312 125 20
VoIP
G.711
UP/
DN
UDP Packet 33 20 64
FTP
UP/
DN
TCP File 10
6
80 N/A
Email
UP/
DN
TCP Email 2000 20 N/A
HTTP DN TCP
Page 10k+
PIC 5×
(10–4000)
10 N/A
Telnet
UP/
DN
TCP
Cmd
60-up/
25-down
30 N/A
* IAT: Inter-arrival time.
Table 2: Simulated scenario number description.
No.
Rate PWD VoIP IT
(Mbps) Units AC Units AC Units AC
1a 5.5
16 DCF 0 - 0 -
1b 11
2a 5.5
16 VO 8 VO 0 -
2b 11
3a 5.5
16 VO 8 VO 16 BE
3b 11
4a 5.5
16 BE 8 VO 16 BE
4b 11
traffic running over 802.11b without other traffic con-
tending for the medium. In scenario 2 PWD shares
the spectrum with VoIP and in scenarios 3 and 4 we
add IT traffic. The difference between scenario 3 and
4 is the access category used by the PWD traffic.
For all simulations the wireless nodes are non-
mobile and the SNR is greater than 25 dB, the min-
imum recommended SNR for VoIP in 802.11b net-
works (Cisco Doc-ID: 70442, 2008). In addition,
Cisco (Cisco 7920 Design Guide, 2005) recommends
maximum of eight VoIP calls at 60 % of WLAN band-
width. Note, that real world WLAN deployments in-
volve many radio frequency (RF) challenges such as
physical obstructions, interference and multipath ef-
fects which impact the channel capacity. These ef-
fects are not accounted for in our simulations.
Table 3: 802.11 parameters used in simulations.
PHY Parameters
PHY rate (Mbit/sec) 5.5/11
DCF
DIFS (µsec) 50
CW
min
31
AC BE
AIFS (µsec) 70
CW
min
31
TXOP Limit* 0
AC VO
AIFS (µsec) 50
CW
min
7
TXOP Limit (msec) 3.264
* A TXOP Limit value of 0 indicates that a single data or management
frame may be transmitted during each TXOP.
4 RESULTS
In this section, we present and discuss the simulation
results. The performance metrics selected for applica-
tions within each profile are described in Table 4. The
focus of the following performance evaluation is on
the end-to-end performance of each application, and
all performance metrics are measured at the applica-
tion layer. The data loss rate and end-to-end delay
are used as performance metrics only for streaming
applications that run over the UDP protocol, which
includes PWD and the VoIP applications. The data
loss rate for each application is calculated as the dif-
ference between all transmit and receive packets for
each application type (voice and PWD). The IT ap-
plications are evaluated by their throughput and the
average response time, which is the average time it
takes to download/upload a complete object such as
an email or file.
In scenarios 1 and 2 where only the PWDs and
the VoIP phones share the network in the same ac-
cess category both 5.5 Mbps and 11 Mbps PHY rates
are able to deliver adequate QoS with the average de-
lays of below 2 ms and the maximum jitter of 0.16 ms.
Note, that the channel quality in these two scenarios
was good with a minimum SNR of 36 dB.
In scenario 3 IT traffic was added and the PWD
traffic operated in the voice access category. We see
that the QoS for the VoIP applications is severely
compromised when the PHY rate of 5.5 Mbps is used
(scenario 3a). The VoIP data loss rate is close to 5 %
and the average delay reaching up to 200 ms. At the
same time, although the PWD traffic uses the same
access category as the VoIP traffic, the PWD perfor-
mance is acceptable with no data being lost and the
maximum delay of 5.3 ms.
HEALTHINF 2009 - International Conference on Health Informatics
314
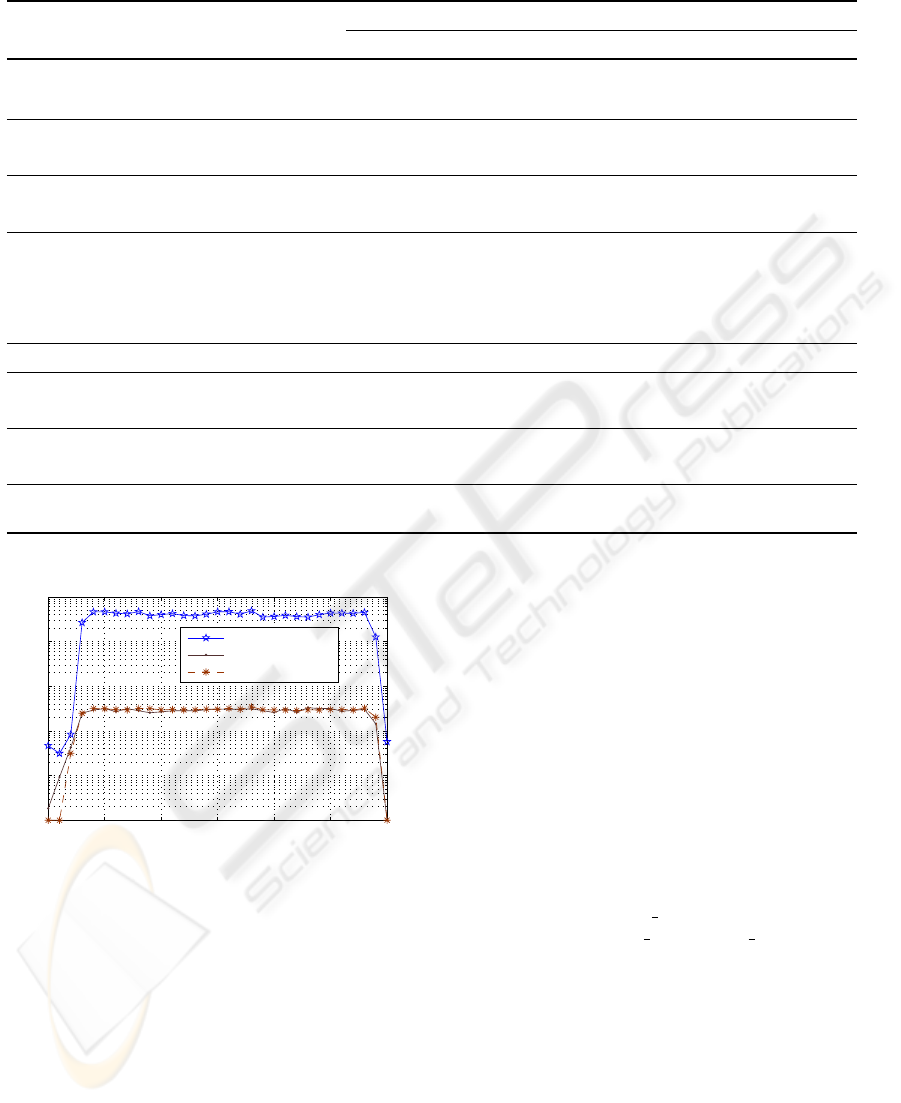
Table 4: Summary of results.
METRIC APPLICATION
SCENARIO
1a 1b 2a 2b 3a 3b 4a 4b
Average delay (ms)
PWD 1.0 0.6 2.0 1.0 5.3 3.0 507.6 23.1
VoIP - - 2.0 1.27 191.3 3.8 182.7 3.7
Jitter (ms)
PWD 0.04 0.02 0.13 0.05 0.63 0.29 248.6 10.4
VoIP - - 0.16 0.03 30.74 0.5 37.0 0.35
Loss rate (%)
PWD 0.0 0.0 0.0 0.0 0.0 0.0 0.31 0.2
VoIP - - 0.0 0.0 4.9 0.0 2.4 0.0
Throughput (kbps)
FTP - - - - 0.9 987.7 0.9 721.0
Email - - - - 31.6 38.0 23.5 40.3
HTTP - - - - 62.7 97.7 64.4 93.9
Telnet - - - - 0.3 0.3 0.3 0.3
Response Time (sec) Telnet - - - - 7.7 0.3 17.4 0.3
Upload Response
Time (sec)
FTP - - - - 267.5 18.1 N/A 125.6
Email - - - - 27.0 1.2 58.2 1.6
Download Response
Time (sec)
FTP - - - - N/A* N/A N/A N/A
Email - - - - 63.3 4.51 55.1 3.36
Page Response
Time (sec)
HTTP - - - - 6.2 4.2 5.4 4.8
* N/A: Transactions did not complete in simulation time.
0 50 100 150 200 250 30
0
10
−5
10
−4
10
−3
10
−2
10
−1
10
0
Simulation Time (sec)
MAC Delay (sec)
AP (avg=387.6 ms)
PWD (avg=2.9 ms)
VoIP (avg= 2.8 ms)
Figure 2: MAC delays at AP, VoIP and PWD stations.
In scenario 3a, upon closer inspection one can see
that the high packet loss rate and delay is experienced
by the downlink VoIP traffic only. Figure 2 shows that
the MAC delay for the VoIP traffic transmitted by the
AP is very high (387.6 ms) compared to the MAC de-
lays of a randomly chosen PWD (2.9 ms) and VoIP
phone (2.8 ms). The AP is contending for access to
the channel with the same priority as the VoIP phones
and PWDs, however it has to deliver a disproportion-
ately high traffic load of 8 downlink VoIP streams and
is unable to do so. The new automatic power save de-
livery (APSD) mechanism defined in IEEE 802.11e
could reduce this problem, as the AP would deliver a
downlink VoIP packet without having to contend for
the channel. The problem could also be mitigated if
the AP voice category used a higher channel access
priority than the non AP’s voice category.
When the physical data rate increased to 11 Mbps
the network capacity increases enough to provide ad-
equate QoS for VoIP and PWD traffic with no packets
lost and an average delay of 3.8 ms and 3.0 ms respec-
tively. As expected, the IT traffic benefits from the
higher network capacity at 11 Mbps than at 5 Mbps re-
sulting in higher throughput and lower response times
as can be seen in Table 4.
Finally, in scenario 4, the PWD traffic uses the
best effort category (AC BE) while VoIP and IT traf-
fic continue to use AC VO and AC BE. In scenario
4a, as we have see in scenario 3a, the traffic load ex-
ceeds the channel capacity at 5.5 Mbps. As a result,
both VoIP and PWD experience severe QoS degrada-
tion. While moving the PWD traffic to a lower ac-
cess category slightly improved the VoIP traffic per-
formance, the average delay is still unacceptably high
at 182.7 ms and so is the loss rate at 2.4 %. Figure 3 il-
lustrates the problems of delivering 800 VoIP packets
per second (the number of packets for eight calls in
one second) in the scenarios with PWD and IT traf-
fic and a PHY rate of 5.5 Mbps. The performance
of the PWD application worsened dramatically with
MEDICAL DEVICE PERFORMANCE IN IEEE 802.11 NETWORKS - Evaluating IEEE P11073.1.1 Use Case Scenarios
in Wireless LANs
315

0 50 100 150 200 250 300
0
100
200
300
400
500
600
700
800
900
Simulation Time (sec)
VoIP Packets Received (pkts/sec)
Scenario 3a
Scenario 4a
Figure 3: VoIP packets received in scenarios 3a and 4a.
the average delay rising to 507.6 ms and a loss rate of
0.31 %.
5 CONCLUSIONS
Our findings can be summarized as follows:
1) As a network becomes more congested the chan-
nel access category used by a node such as a PWD
becomes more important for guaranteeing the re-
quired QoS. We recommend putting the medical
traffic in the highest priority access category; and,
2) When the wireless nodes experience poor chan-
nel quality and lower their transmission rate the
channel capacity is reduced and the recommended
VoIP capacity for 802.11b can no longer be sup-
ported by the network.
In this paper we have estimated the QoS lev-
els achieved by applications, specifically IEEE
P11073.1.1 use case scenarios, while sharing a wire-
less channel. The knowledge gained by this work
would help in designing an IEEE 802.11 wireless net-
work in medical environments, for example, in hospi-
tals, and estimating the QoS in the designed system.
In the scenarios that we examined good channel
conditions were assumed. However, in real-world
situations, some safety marigns are included in the
design specifications because: i) the channel is dy-
namic due to multipath fading; ii) the portable de-
vices are mobile and channel conditions deteriorate
at the fringes of the coverage areas; and, iii) there
are vendor-to-vendor and device-to-device variations.
Another interesting metric, which we did not consider
in this paper, is the power consumption of the PWD
devices. The power consumption of PWD in power
save mode will increase as the network load reaches
the channel capacity and more retransmissions oc-
cur due to contention increase. Because of the above
stated reasons and prudent safeguards for life-critical
applications, a network may have to be operated much
below the capacity obtained in our simulations.
ACKNOWLEDGMENTS
The authors would like to thank Phil Raymond, Dale
Wiggins, Jan Wittenber and reviewers for their com-
ments and suggestions.
REFERENCES
Cavalcanti, D., Schmitt, R., and Soomro, A. (2007).
Achieving energy efficiency and QoS for low-rate ap-
plications with 802.11e. In Proc. IEEE WCNC ’07.
Cisco 7920 Design Guide (October 2005). Cisco 7920
Wireless IP Phone Design and Deployment Guide.
Cisco Doc-ID: 70442 (July 2008). Cisco Spectralink Phone
Design and Deployment Guide.
IEEE Std. 802.11 (2007). Wireless LAN Medium Access
Control (MAC) and Physical Layer (PHY) Specifica-
tion. Number 802.11. IEEE, Piscataway, NJ. Revision
of IEEE Std 802.11-1999.
IEEE Std. 802.11e (2005). Wireless LAN Medium Access
Control (MAC) and Physical Layer (PHY) specifica-
tions: Medium Access Control (MAC) Quality of Ser-
vices Enhancements. IEEE, Piscataway, NJ.
IEEE Std P11073-00101/D04 (May 2008). Draft Health
Informatics - Point-of-Care Medical Device Commu-
nications - Technical Report - Guidelines for the Use
of RF Wireless Technology. IEEE, Piscataway, NJ.
Istepanian, R., Jovanov, E., and Zhang, Y. (2004). Guest
editorial introduction to the special section on m-
health: Beyond seamless mobility and global wire-
less health-care connectivity. IEEE Trans. Info. Tech.
Biomedicine, 8(4):1255–1275.
Mangold, S., Choi, S., Hiertz, G., Klein, O., and Walke, B.
(2003). Analysis of IEEE 802.11e for QoS support
in wireless LANs. IEEE Wireless Com. Mag., pages
1255–1275.
Soomro, A. and Cavalcanti, D. (Feb 2007). Opportunities
and challenges in using WPAN and WLAN technolo-
gies in medical environments. IEEE Communications
Magazine, pages 114–122.
HEALTHINF 2009 - International Conference on Health Informatics
316
