
DISCRIMINATION OF HEART SOUNDS USING CHOAS ANALYSIS
IN VARIOUS SUBBANDS
D. Kumar, P. Carvalho, M. Antunes
†
, J. Henriques, A. S´a e Melo
†
and J. Habetha
‡
Centre for Informatics and Systems, University of Coimbra, Portugal
†
University Hospital of Coimbra, Portugal
‡
Philips Research Laboratories, Aachen, Germany
Keywords:
Heart sound analysis, Wavelet decomposition, Chaos analysis, Phase reconstruction, Lyapunov exponents,
Correlation dimension, Mechanical valve.
Abstract:
Discrimination among different types of heart sounds has a significant impact in designing pHealth systems
based upon this bio-signal, since (i) it enables the optimal selection and tuning of the analysis algorithms
and (ii) it may be applied as a first level strategy for heart dysfunction diagnosis. In this paper we introduce
an algorithm for heart sound type discrimination into three classes: healthy heart sounds, heart sounds with
murmur produced by native heart valves and heart sounds produced by prosthetic mechanical heart valves.
The algorithm is based on a nonlinear dynamical model of phase space reconstruction for various frequency
bands. For each frequency sub-band the chaotic nature and the complexity of the signal is assessed using the
largest Lyapunov exponents (LLE) and the correlation dimension (CD). The effectiveness of the method has
been tested with heart sounds of 45 subjects (15 subjects of each class). It was concluded that LLEs and the
CDs exhibit complementary significance in the discrimination among different classes of heart sounds.
1 INTRODUCTION
Auscultation has been a popular technique to exam-
ine the mechanical status of the heart. Its capacity to
assess the cardiac mechanical state is comparable to
the electrocardiogram in assessing the cardiac elec-
trical state. It has been proven to be a noninvasive,
inexpensive and effective method for the early detec-
tion of many cardiac disorders (Xiao et al., 2002),
such as prosthetic and native heart valve disorder di-
agnosis and heart failure decompensation assessment.
Besides these more conventional diagnosis functions,
heart sounds may be applied for assessing several im-
portant cardiac reserve parameters for long-term pa-
tient surveillance. For instance, heart sounds may
be applied as the source signal to estimate surrogate
measures of continuous blood pressure, cardiac out-
put and heart contractility as well as to measure the
systolic heart time intervals. Due to its non-invasive
and low intrusive nature it is an interesting bio-signal
for designing systems to support pHealth applications
for continuous and long-term use in several types of
coronary and heart disease management tasks.
Heart sound signals are significantly more com-
plex compared to other bio-signals such as the ECG
or PPG. Their main sources of origin are the move-
ments of the atrio-ventricular valves. However, other
more subtle phenomena such as blood turbulence and
heart wall vibration may contribute to the heart sound
signal. These phenomena are highly correlated to
specific heart dysfunctions and diseases and hence it
is fundamental to design appropriate analysis algo-
rithms that are able to adequately identify and extract
these diagnosis features. A typical heart sound anal-
ysis algorithm pipeline encompasses several stages
related to non-cardiac sound detection and removal,
heart sound segmentation, diagnostic feature extrac-
tion and classification (see Figure 1). The degree
of complexity and tuning of the required algorithms
in each stage varies considerably according to the
characteristics of the underlying heart sound. For
instance, the segmentation of a heart sounds with
systolic or diastolic murmur is considerably more
complex and computationally expensive compared to
the segmentation of a heart sound without murmur
(see, for instance (Kumar et al., 2006a)(Kumar et al.,
2006b)). On the other hand, some of the analysis
stages are only required if some specific disease is
known (or at least suspected) to exist. These issues
are central in designing systems for personnel Health
(pHealth) applications, where low power electronics
369
Kumar D., Carvalho P., Antunes M., Henriques J., Sá e Melo A. and Habetha J. (2009).
DISCRIMINATION OF HEART SOUNDS USING CHOAS ANALYSIS IN VARIOUS SUBBANDS.
In Proceedings of the International Conference on Bio-inspired Systems and Signal Processing, pages 369-375
DOI: 10.5220/0001554003690375
Copyright
c
SciTePress
are a typical design constraint and therefore limit the
amount of computation that is available. For these
reasons, it is observed that the discrimination among
different types of heart sounds has a significant im-
pact in designing pHealth systems, since it enables
the optimal selection and tuning of the analysis algo-
rithms and (ii) it may be applied as a first level of heart
dysfunction diagnosis strategy. In this paper we intro-
duce an algorithm for heart sound type discrimination
into three types of classes: healthy heart sounds, heart
sounds with murmur produced by native heart valves
and heart sounds produced by prosthetic mechanical
heart valves (see Figure 1).
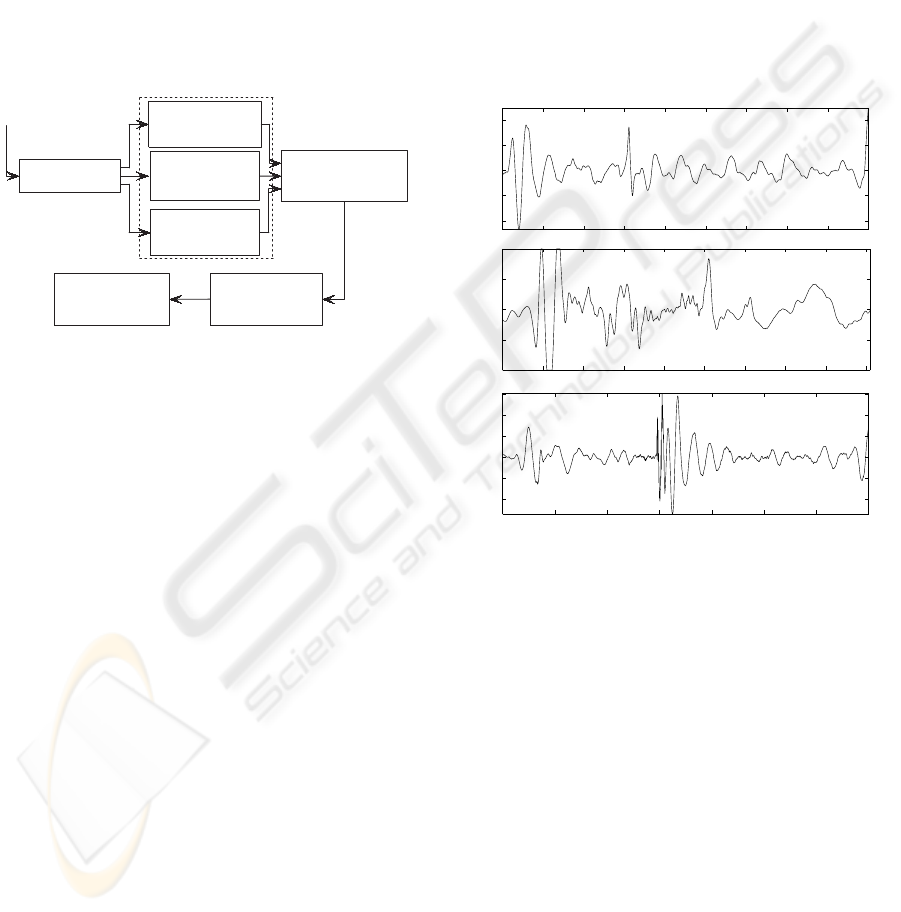
Heart Sound produced
by native valve
Heart sound with
murmur produced by
native valve
Heart sound
produced by
mechanical valve
Feature extraction
Suitable segmentation
algorithm for the class
of heart sounds
non-cardiac sound
removal
In case of heart sound
with murmur :
murmur classification
Heart Sound
Figure 1: Main blocks for heart sound analysis framework
where blocks under dotted square is for discrimination for
the three groups of sounds.
In the best knowledge of the authors, no work has
been proposed thus far that has attempted to solve
the addressed problem in this paper. However, heart
sounds with murmurs classification and heart sounds
produced by mechanical valve have been separately
investigated in the literature. Nevertheless, heart mur-
mur classification provides insights for the addressed
problem. Heart murmur segmentation and its recog-
nition involves feature extraction and classification.
Some of the recent works on heart murmur classifica-
tion are based upon decision tree methods (Pavlopou-
los et al., 2004), nonlinear dynamic methods using
recurrent statistic analysis (Ahlstrom et al., 2006)
and using features from nonlinear dynamical system
(chaos and correlation dimension) analysis (Delgado
et al., 2007).
This paper presents chaos and complexity mea-
surement in different frequency bands of heart sounds
in order to achieve the best distinction among three
classes of heart sounds. Considering the range of fre-
quency spectrum in each group, the signals are de-
composed into 6 successive signals in decreasing fre-
quency bands based on the wavelet decomposition
technique. For each band, the phase space is recon-
structed using one of the nonlinear times series meth-
ods, i.e. time delay embedding method. The chaos
and complexity features are measured in the form of
the largest Lyapunov exponents (LLE) and the corre-
lation dimension (CD). Consequently, statistical anal-
ysis is performed to test the features’ potential in dis-
tinction of these three groups of heart sounds.
The paper is structured as follows: section 2
presents a brief introduction of the applied method
using phase space features, Lyapunov exponents and
correlation dimension is presented. Section 3 contains
the details of the method. In section 4 the achieved
results using the test database composed by heart
sounds of 45 subjects are presented and discussed. Fi-
nally, in section 4 some main conclusions and future
working directions are outlined.
2.2 2.3 2.4 2.5 2.6 2.7 2.8 2.9 3 3.1
−0.4
−0.2
0
0.2
0.4
Amplitude (Unit)
0.3 0.35 0.4 0.45 0.5 0.55 0.6 0.65 0.7 0.75
−1
−0.5
0
0.5
Amplitude (Unit)
0.8 0.9 1 1.1 1.2 1.3 1.4 1.5
−0.2
−0.1
0
0.1
0.2
0.3
Amplitude (Unit)
Time (Sec.)
Figure 2: Three classes of heart sounds: a) Heart sound
without any known cardiac disorder. b) Heart sound with
systolic murmur, c) Heart sound collected from a heart with
a mechanical valve implant.
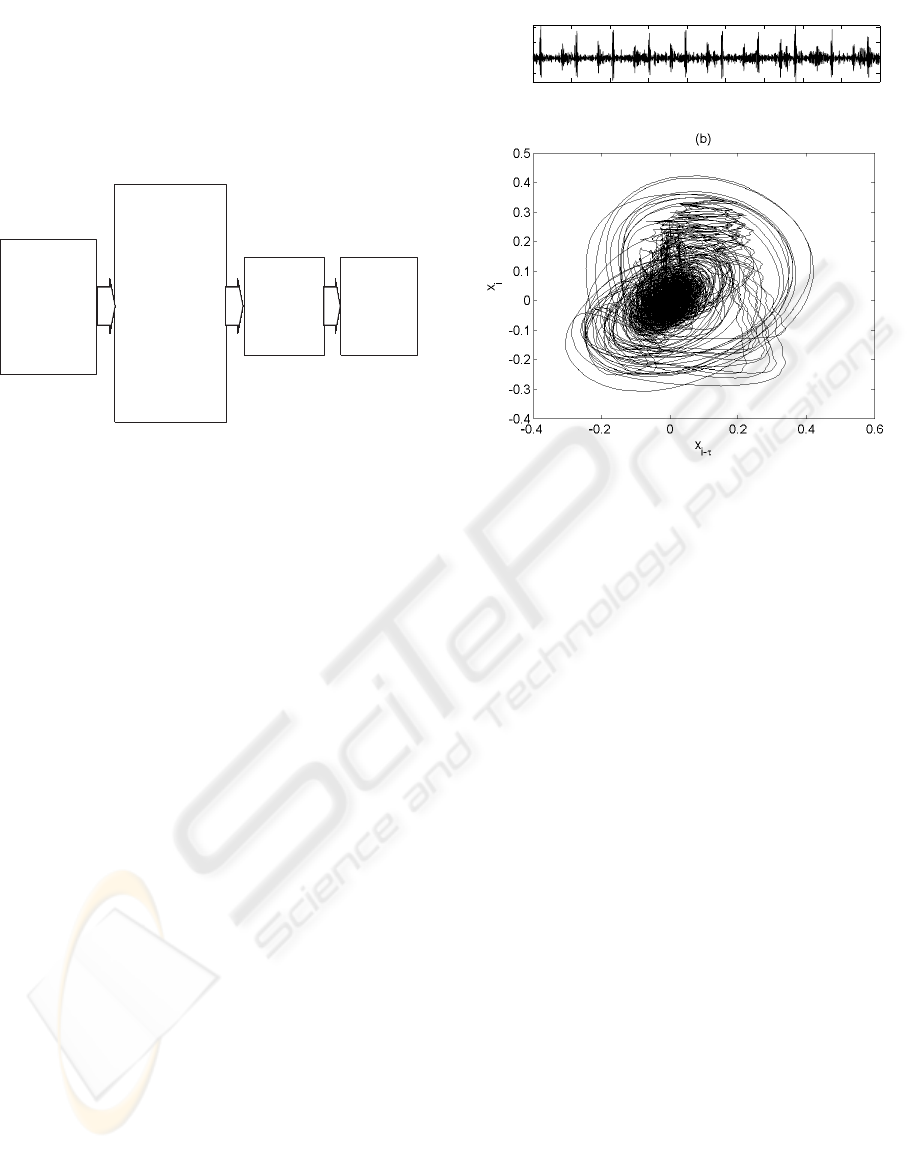
2 METHOD
The proposed method for the discrimination between
different classes of heart sounds is composed by three
main steps, as it is summarized in Figure 3: 1) sig-
nal decomposition into different subbands using the
wavelet transform technique, 2) chaos and complex-
ity feature extraction using the nonlinear dynamic
approach of phase reconstruction and 3) relevance
assessment of the results using statistical analysis.
Wavelet decomposition is chosen to decompose heart
sound signal over the traditional Fourier transform
based band-pass filter bank due to its advantage of
time-frequency localization, multirate filtering and
scale-space analysis. For computational efficiency
BIOSIGNALS 2009 - International Conference on Bio-inspired Systems and Signal Processing
370
the discrete wavelet transform with dyadic scales and
translations is chosen. Mathematical background of
the technique is out of the scope of the paper. How-
ever, an introductory explanation of nonlinear dynam-
ical systems features is provided in this section, which
will be further applied on the original as well as on the
decomposed signals.
Heart Sound
1- without murmur
produced by Native Valve
2- with murmur produced
by Native Valve
3- produced by Mechanical
Valve
Original Signal
x
(25Hz -22.5kHZ )
Wavelet Decomposition
ca6 (25Hz -344Hz )
cd6 (0.3- 0.6kHz )
cd5 (0.6- 1.3kHz )
cd4 (1.3- 2.7kHz )
cd3 (2.7- 5.5kHz )
cd2 (5.5.- 11kHz )
cd1 (11-22.5 kHz)
Phase
Reconstruction
Largest Lyapunov
Exponents
Correlation
Dimension
Statistical
Analysis
for the Potential
discrimination
between the groups
Figure 3: Workflow for the chaos analysis in the three
groups of heart sounds.
2.1 Phase Space Reconstruction
In order to see the structures in chaotic behavior of
a dynamical system through the time series produced
by itself, a method of attractor reconstruction is ap-
plied. Attractor is a distribution of points in the phase
or the state space that is characterized by the density
of points. Suppose the heart is considered as a non-
linear dynamical system which state space is given as
X = [X
1
, X
2
, X
3
....., X
P
]
T
, (1)
where X
i
is the state of the system at discrete time
i, that generates the N-point heart sound time series
{x
1
, x
2
, ...x
N
}. A method of delay is applied to recon-
struct the attractor in the multidimensional space or
embedding space P, i.e.
X
i
= [x
i
, x
i−τ
, ....., x
i+(m−1)τ)
] ∈ IR
m
(2)
where i = 1, 2, 3...P and X
i
are row vectors of the em-
bedding matrix X of size P × m. Application of an
(m, τ) window to a time series of N data points results
in a sequence of P = N−(m−1) vectors. In the phase
space reconstruction, it is important that the two inte-
ger parameters (m, τ) are suitably estimated. The τ
parameter is estimated as the time lag where the first
minimum occurs in the mutual information between
data vector {x
1
, x
2
, ...x
N
} and time lagged data vec-
tor X
i
. Using the estimated τ, the embedded matrix
dimension m is estimated by utilizing Cao’s method
(Cao, 1997). The method exhibits invariance with re-
spect to the data length (Cao, 1997). An example of
reconstructed phase space using in murmur include
heart sound is shown in Figure 4.
1 2 3 4 5 6 7 8 9
−0.2
0
0.2
0.4
(a)
unit
Sec.
Figure 4: (a) A heart sound signal with murmur. (b) Recon-
structed phase space with τ = 195 and embedding dimen-
sion m = 4.
In order to know the attractor’s behaviors in the
phase space, two significant incidents can be ob-
served: the first one is the rate of divergence or con-
vergence of the trajectories and the second one is the
geometry of the attractor. These can be quantified
by the Lyapunov exponents and the correlation di-
mension. The fundamental reason of choosing Lya-
punov exponents and correlation dimension for the
time series characterization is to enhance the knowl-
edge about the underlying system rather than simply
compressing many measurements into a number. This
can not be achieved by many statistics measurements.
A quantity which can serve this objective must be
independent of measurement procedure, coordinates
chosen, noise, etc. According to their definition, cor-
relation dimensions and Lyapunov exponents nearly
fulfil these criteria.
2.2 Lyapunov Exponents
In a phase space plot, it is observed that the trajecto-
ries diverge over a course of time very slowly in peri-
odic time series. Chaos is thought to be present only
if divergence is exponentially fast. The averaged ex-
ponents of increase or decrease of separation quanti-
fies the strength of chaos, which is known as the Lya-
punov exponents (Kantz and Schreiber, 1997). One
of the most robust and computationally fast methods
is the one introduced by Rosentein (Rosenstein et al.,
1993) is adopted.
DISCRIMINATION OF HEART SOUNDS USING CHOAS ANALYSIS IN VARIOUS SUBBANDS
371

There are many Lyapunov exponents for the at-
tractor, only the largest is computed that is significant
to represent the level of chaos in heart sound signals.
The largest Lyapunov exponent (LLE) may have neg-
ative, positive or zero value. Time series from a dis-
sipative system may yield LLE negative values, while
marginally stable systems zero LLE. Positive value of
LLE denotes chaos in the system.
2.3 Correlation Dimension
Correlation dimension is a measure of self-similarity
(geometry of the attractor) in the time series. This
quantity is computed through correlation sum C(r),
that is a fraction of all possible pairs of points which
are closer than a given radial distance r in a particu-
lar norm. The sum counts the pair whose distance is
smaller than r. Since at large number of points corre-
lation sum follows power law, correlation dimension
can be defined with the logarithmic change in correla-
tion sum with respect to the logarithm of the distance
r. More mathematical explanation can be found in
(Kantz and Schreiber, 1997).
3 APPLICATION AND RESULTS
3.1 Data Collection
Heart sounds containing murmurs produced by na-
tive heart valve as well as heart sounds produced by
heart with a mechanical valve implant, were collected
from the Cardiothoracic Surgery Center of the Uni-
versity Hospital of Coimbra. Heart sounds produced
by mechanical valves were recorded 2-3 weeks af-
ter valve surgery and do not exhibit murmurs. Some
heart sound samples of healthy subjects (who did
not have any kind of CVD) were collected from re-
searchers at the University of Coimbra and Philips
Research Laboratories. For this purpose, a quiet loca-
tion was chosen where subjects were asked to avoid
movements during measurements. In most cases, the
supine position was adopted as the best auscultation
position for the subjects and the best auscultation site
(near to the second or the third intercostal space) was
selected based on the loudness of the heart sounds.
The prepared database was categorized into the three
groups: group H; heart sounds produced by native
valve, group M; heart sounds with murmur produced
by native valves, and group V; heart sounds produced
by mechanical valve.
Data acquisition was performed with an electronic
stethoscope from Meditron. The stethoscope presents
excellent signal to noise ratio characteristic and an ex-
tended frequency range (20 - 20,000 Hz). The normal
amplitude can be regulated up to a maximum of 93
dB. Sound samples can be sampled up to a maximum
sampling rate of 44.1kHz and digitized with a 16-bit
ADC. All collected heart sound samples were sam-
pled at the rate of 44.1kHz for at most one minute.
Later, only 9 seconds length of heart sounds of each
subject is applied for the discrimination test.
3.2 Pre-processing and Wavelet
Decomposition
All collected heart sounds are first preprocessed using
a 4th order Butterworth high pass filter with a cut-off
frequency of 25Hz in order to eliminate low frequen-
cies produced by muscle and stethoscope movements.
The resultant heart sounds are decomposed into
seven frequency bands with the range of 25Hz-
22.5kHz. It should be noticed that various frequency
bands are present in heart sounds produced by native
or mechanical valve. For instance, mechanical valve
produces frequency up to 50kHz (Zhang et al., 1998),
whereas the heart sounds produced by native valves,
even with murmurs, fall into a frequency range of
25Hz-600Hz (Erickson, 2003).
As it has already been mentioned, the heart sounds
are decomposed using the wavelet decomposition
technique. Given the Daubechies wavelet’s properties
related to the suppression of the instrumental defects
( i.e. polynomial components) and the absence of the
Gibbs phenomenon (no ripple in frequency response)
(Strang and Nguyen, 1996), it is chosen to correlate
with the heart sound signals.
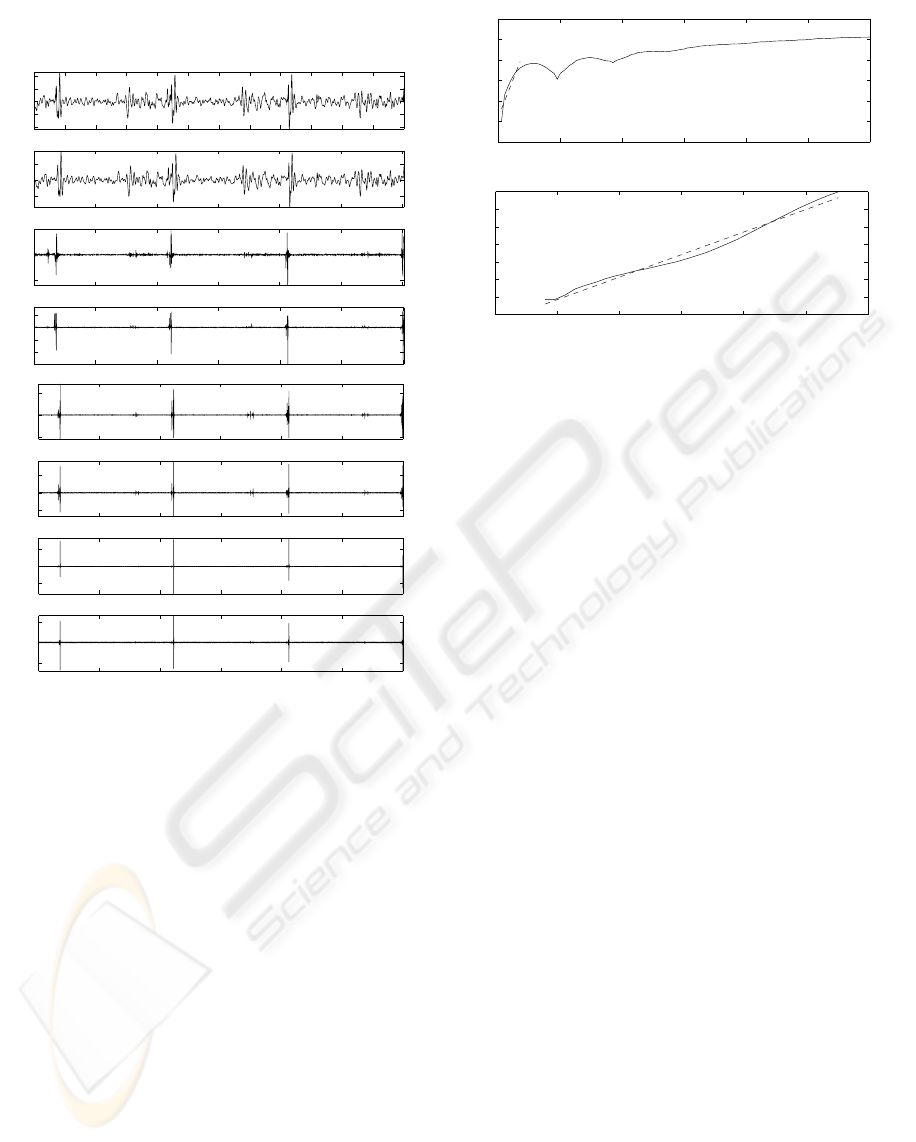
The heart sound signals are subjected to 6 decom-
position level using 6
th
- order Daubechies wavelet
transform. The band limited (25Hz-22.5kHz) heart
sounds, x, are decomposed into two frequency bands
signals: ca1 that contains frequency bands (25Hz-
11.025kHz), and cd1 (11.025-22.5kHz). The ca1
is further decomposed into band limited signals ca2
(25Hz-5.5kHz) and cd2 (5.5-11kHz). The approach
is repeated until four following frequency band sig-
nals : cd3 (2.7-5.5kHz), cd4 (1.3-2.7kHz), cd5 (0.6-
1.3kHz), cd6 (0.3-0.6kHz) and ca6 (25-344Hz), as
can be seen in Figure 5. The subbands signals
ca6, cd6, cd5, cd4, cd3, cd2 and cd1 reconstruct the
original signal. The differences in the subbands ex-
hibit physiological significance. For instance, heart
sounds produced by healthy hearts should have their
energy concentrated mainly in ca6 band, while heart
sounds with murmur typically exhibits a signifi-
cant amount of energy in the cd6 or even in cd5
band. Heart sounds produced by prosthetic mechan-
BIOSIGNALS 2009 - International Conference on Bio-inspired Systems and Signal Processing
372
ical heart valve usually exhibit high frequency con-
tents.
0.5 1 1.5 2 2.5 3 3.5 4 4.5 5 5.5
−0.4
−0.2
0
0.2
0.4
x
0.5 1 1.5 2 2.5 3
−2
0
2
ca6
0.5 1 1.5 2 2.5 3
−0.1
0
0.1
cd6
0.5 1 1.5 2 2.5 3
−0.2
−0.1
0
0.1
cd5
0.5 1 1.5 2 2.5 3
−0.1
0
0.1
cd4
0.5 1 1.5 2 2.5 3
−0.02
0
0.02
cd3
0.5 1 1.5 2 2.5 3
−0.02
0
0.02
cd2
0.5 1 1.5 2 2.5 3
−0.01
0
0.01
cd1
Time (Sec.)
Figure 5: Level 6 decomposition of a Heart sound with
murmur sound samples using Daubechies 6
th
order (where,
x = ca6+
∑
6
k=1
cd
k
).
3.3 Attractor Reconstruction and
Chaotic Features Computation
The required parameters for the attractor reconstruc-
tion (τ, m) are estimated for each heart sound in each
group. The time delay parameter, τ, is computed as
the first local minimum in the plot of the mutual infor-
mation. The embedding dimension is obtained using
the well known Cao’s method (Cao, 1997).
The Lyapunov exponents are computed based on
well known Wolf’s (Rosenstein et al., 1993) method.
The single largest Lyapunov exponent (LLE) of the
heart sound is computed using least square fit in the
plot of logarithm of divergence over increasing time
steps, as depicted in Figure (6). The slope of the line
fitted to the data is computed as the largest Lyapunov
exponent.
In the correlation dimension computation, the
only crucial variable is the radial distance (r) for the
0 20 40 60 80 100 120
−1
0
1
2
3
4
5
(a)
time step
divergence
−3 −2 −1 0 1 2 3
−16
−14
−12
−10
−8
−6
−4
−2
(b)
ln(r)
ln(C(r))
linear fit
Figure 6: Embedding features computation by linear least
square fitting : (a) Largest Lyapunov exponent (b) Correla-
tion dimension.
identification of the number of neighbors of the refer-
ence point. In case of a very small radius not enough
points are captured. On the other hand, in case of
a large value, most of the available points are cap-
tured. Both situations mislead the correlation dimen-
sion computation. Care must be taken in choosing
the value, which led to experiment with range of r,
i.e. 5%-25% of the attractor size. This range of ra-
dius enables the fair estimate values of CD, which do
not predominantly vary from each other. In our im-
plementation, we have chosen experimentally a 8%
distance value (r) for further statistical analysis. The
CD is nothing but a slope of the line which can be ap-
proximately fit with the logarithm of correlation sum
(C(r)). In the Figure 6(b), the CD is computed using
the plot of correlation sum over distance.
3.4 Statistical Analysis
The computation of the features based on the embed-
ded matrix of the heart sound samples have been pre-
sented in the previous section. It has been applied
to all the 45 data samples of the three groups, where
each group contains 15 heart sound samples from dif-
ferent subjects. The average value of LLE and CD of
the original and decomposed signal are listed in Table
1. The values are not monotonically increasing or de-
creasing in the descending frequency subbands in ei-
ther of these groups. Instead, some values are nearly
overlapping among the groups. Therefore, there is a
risk to apply a hard threshold to these measures in dis-
tinction between the groups.
From the LLE values in Table 1, it can be observed
that the original heart sound signals and the subband
signals of each group differ significantly. The LLE
DISCRIMINATION OF HEART SOUNDS USING CHOAS ANALYSIS IN VARIOUS SUBBANDS
373
of the original signal of the group V (0.123) is signifi-
cantly higher than those of group M (0.073)and group
H (0.073). The values are found to be lower for sub-
band cd1 and cd2 in group V (0.233 and 0.249 ) than
in group H (0.042 and 0.073), though the difference
is not considerably high, whereas in the other sub-
bands the values are higher in group V than in group
M and H. Hence, it can be deduced that heart sounds
of group V is more chaotic in nature than the other
groups in the original band signal and the subbands
ca6, cd6, cd4, and cd3. That can be explained based
upon the single-tilting disk mechanical valve closing
which produces a vast frequency range (up to 50kHz)
of sound. However, it is more chaotic than the group
H but less than the group M in the subbands cd2 and
cd1. The most interesting observation is to find that
the values of the group M higher than those of group
H in all subbands. The attractor of the healthy heart
sound is less chaotic compared to the attractors ob-
tained from heart sounds produced by hearts with dis-
orders.
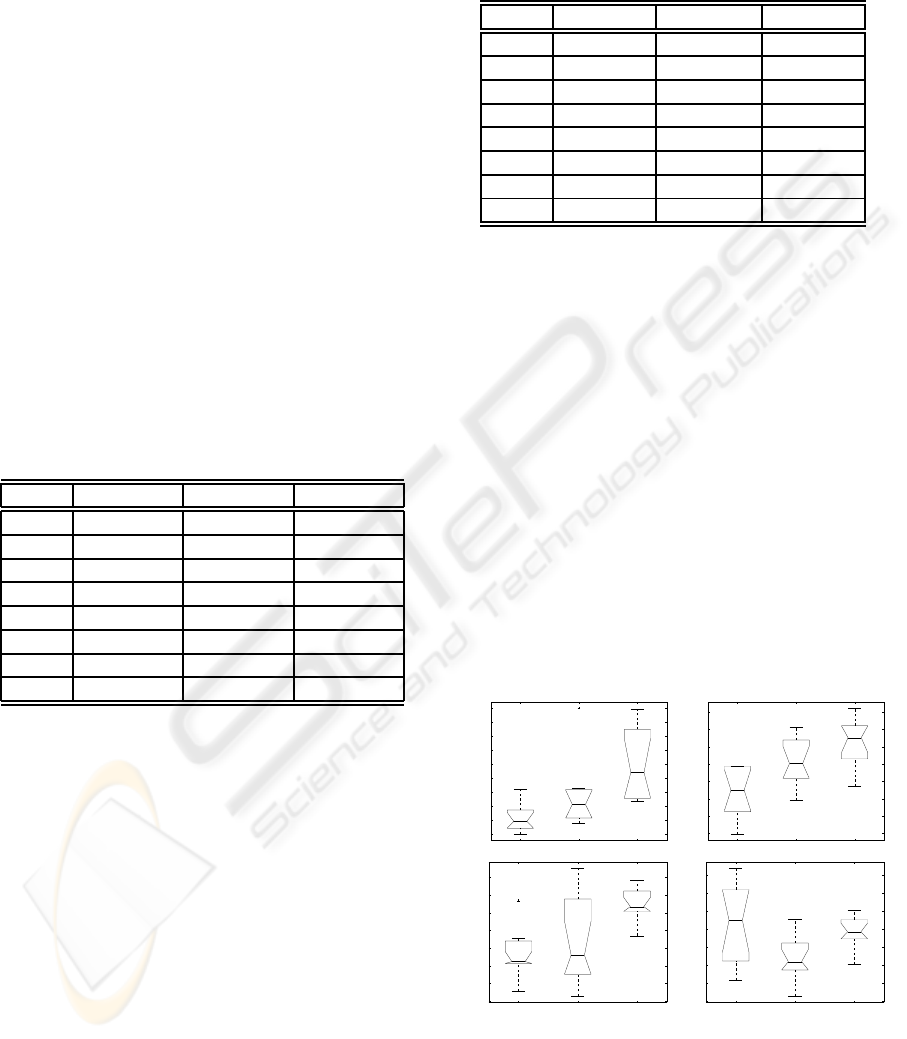
Table 1: Averaged Largest Lyapunov Exponents (LLE) val-
ues for all three data groups. Standard deviations are in
parenthesis.
Signal Group H Group M Group V
x 0.042 (0.018) 0.073 (0.048) 0.123 (0.049)
ca6 0.215 (0.080) 0.246 (0.115) 0.308 (0.116)
cd6 0.279 (0.100) 0.331 (0.139) 0.489 (0.132)
cd5 0.236 (0.101) 0.269 (0.141) 0.431 (0.207)
cd4 0.178 (0.110) 0.259 (0.134) 0.366 (0.111)
cd3 0.170 (0.071) 0.249 (0.065) 0.305 (0.067)
cd2 0.242 (0.117) 0.304 (0.198) 0.249 (0.094)
cd1 0.222 (0.059) 0.302 (0.189) 0.233 (0.126)
From the CD values in Table 2, it can be observed
that the original band limited heart sounds, x, of all the
groups do not exhibits considerable difference among
each other. This implies that the complexity in non-
linear dynamics of the attractors is almost the same
for all heart sounds. The subbands ca6, cd6, cd5, cd4
and cd3 yield almost similar values of CD in each
group. The values suggest moderate variation in com-
plexity of the groups in these subbands. However, in
subband cd2, the group V (4.18) appears to be sig-
nificantly higher compare to the group H (3.66) and
reasonably above the value of group M (3.97). Fur-
thermore, subband cd1 also yields a larger value of
CD for the group V (4.43) than for group M and H. It
indicates increased complexity of the group V, which
may be used in the discrimination of the group.
In the further discussion about the yielded values
of LLE, a significance analysis is performed using
one-way variance analysis (ANOVA) with 99% con-
Table 2: Averaged Correlation Dimension (CD) values for
all three data groups using 8% distance of the attractor for
neighbor search from the reference point. Standard devia-
tions are in parenthesis.
Signal Group H Group M Group V
x 4.25 (0.44) 3.88 (0.21) 4.12 (0.23)
ca6 3.94 (0.36) 3.65 (0.65) 3.89 (0.31)
cd6 3.70 (0.27) 3.46 (0.42) 3.80 (0.32)
cd5 3.63 (0.64) 3.58 (0.49) 3.60 (0.36)
cd4 3.68 (0.66) 3.87 (1.19) 3.75 (0.31)
cd3 3.72 (0.81) 3.95 (0.72) 3.89 (0.60)
cd2 3.66 (0.88) 3.97 (0.88) 4.18 (0.62)
cd1 3.19 (0.73) 3.42 (0.92) 4.43 (0.59)
fidence level. Let α be the confidence level at which
the null hypothesis (similar averaged value groups)
can be rejected, variance in the values of LLE and
CD is searched greater to 99% (α = 0.01) when F-
statistic is below 0.001. The achieved results exhibit
the same results as it has already been presented in
Table 1. It can be seen in Figure 7(a) that LLE of
the original sounds of group H, group M and group
V can be discriminated from the original heart sounds
(F=0.0006689). However, band cd3 (F = 0.0000952)
has better potential to discriminate all the three groups
from each other, see Figure 7(b). The cd2 is able to
distinct group V from group H and group M.
On the other hand, it can be seen in Figure 7(c)
that the CD values of cd6 are able to discriminate
group V from group H and M (F=0.0000952). Fur-
thermore, CD values of ca6 are able to discriminate
group M from group H and group V (F=0.00066896),
see in Figure 7(d).
H M V
0.02
0.04
0.06
0.08
0.1
0.12
0.14
0.16
0.18
0.2
Values
(a)
H M V
0.05
0.1
0.15
0.2
0.25
0.3
0.35
0.4
Values
(b)
H M V
1
1.5
2
2.5
3
3.5
4
4.5
Values
(c)
H M V
3.4
3.6
3.8
4
4.2
4.4
4.6
4.8
Values
(d)
Figure 7: Confidence interval plots of LLE ((a) original
heart sound, (b) cd3) and CD ((c) cd6, (d) ca6) value of
in all the groups.
BIOSIGNALS 2009 - International Conference on Bio-inspired Systems and Signal Processing
374

4 CONCLUSIONS AND FUTURE
WORKS
Chaos and complexity analysis in seven frequency
subbands (ca6, cd6, cd5, cd4, cd3, cd2, cd1) of three
groups of heart sounds were computed in order to dis-
criminate these groups of heart sounds. The three
groups of heart sounds are heart sounds produced
by native valve, heart sounds with murmur produced
by native valve and heart sounds produced by me-
chanical valves. These are compared with respect to
their degree of chaos which was quantified as largest
Lyapunov exponents (LLE) as well as complexity in
the form of the correlation dimension (CD). These
quantities were computed for seven frequency bands,
which were achieved by applying a wavelet decompo-
sition. Then statistical analysis was performed to test
the method’s effectiveness. The LLE values of sub-
band cd3 is found to be the best for group discrimi-
nation from each other and CD values of subband ca6
are found to be the best signals to discriminate heart
sound with murmur produced by native valves from
the rest of the two groups.
The decomposition of the original heart sound
into seven subbands alters the original phase space,
and exhibit different chaotic and complex behaviors.
Observing the results, one may conclude that only
LLE can discriminate among the three groups of heart
sounds. However, it is observed that CD can be used
to discriminate one group of heart sound from the rest
of the two groups in the specific bands with greater
confidence level. Therefore, it can be concluded that
heart dynamics are not spread out equally across the
spectrum of heart sounds, but instead, are limited to
certain frequency band.
In the near future, work will include testing the
method with large database as well as the fine tuning
of the frequency bands for analysis.
ACKNOWLEDGEMENTS
This work was performed under the IST FP6 project
MyHeart (IST-2002-507816) supported by the Euro-
pean Union, and is being continued under the Sound-
ForLife project (PTDC/EIA-68620/2006)financed by
FCT.
REFERENCES
Ahlstrom, C., Hult, P., Rask, P., Karlsson, J., and Nylander,
E. (2006). Feature extraction for systolic heart mur-
mur classification. Annals of Biomedical Engineering,
34(11):1666–1677.
Cao, L. (1997). Practical method for determining the mini-
mum embedding dimension of a scalar time series. in
the J. Physica, 110:43–50.
Delgado, E., Jaramillo, J., Quiceno, A. F., and Castellanos,
G. (2007). Parameter tuning associated with nonlinear
dynamics techniques for the detection of cardiac mur-
murs by using genetic algorithms. In in Proc. IEEE
Computers in Cardiology 2007, pages 403–406.
Erickson, B. (2003). Heart Sound And Murmurs: Across
the Lifespan. 4th edition, Mosby, Inc.
Kantz, H. and Schreiber, T. (1997). Nonlinear Time Series
Analysis. Cambridge University Press.
Kumar, D., Carvalho, P., Antunes, M., Henriques, J., Euge-
nio, L., Schmidt, R., and Habetha, J. (2006a). Detec-
tion of s1 and s2 heart sounds by high frequency sig-
natures. In in Proc. of 28th EMBS Annual Int. Conf.,
pages 1410–1416.
Kumar, D., Carvalho, P., Antunes, M., Henriques, J., Euge-
nio, L., Schmidt, R., and Habetha, J. (2006b). Wavelet
transform and simiplicity based heart murmur detec-
tion. In Proc. of 33rd Int. Conf. Computers in Cardi-
ology, pages 173–176.
Pavlopoulos, S. A., Stasis, A. C., and Loukis, E. N. (2004).
A decision tree based method for the differential diag-
nosis of aortic stenosis from mitral regurgitation using
heart sounds. BioMedical Engineering OnLine, pages
1–15.
Rosenstein, M. T., Collins, J. J., and Luca, C. J. D. (1993).
A practical method for calculating largest lyapunov
exponents from small data sets. Physica D, 65:117–
134.
Strang, G. and Nguyen, T. (1996). Wavelets and Filter
banks. CWellesley-Combridge Press, Wellesley.
Xiao, S., Wang, Z., and Hu, D. (2002). Studying cardiac
contractility change trend to evaluate cardiac reserve.
in Mag. of IEEE EMBS, pages 74–76.
Zhang, X., Durand, L. G., Senhadji, L., Lee, H. C.,
and Coartrieux, J. (1998). Analysis-synthesis of
the phonocardiogram based on the matching pursuit
method,. IEEE Trans. on Biomedical Engineering,
45(8):962–971.
DISCRIMINATION OF HEART SOUNDS USING CHOAS ANALYSIS IN VARIOUS SUBBANDS
375
