
CLASSIFYING AYURVEDIC PULSE SIGNALS VIA CONSENSUS
LOCALLY LINEAR EMBEDDING
Amod Jog, Aniruddha Joshi, Sharat Chandran
Dept. of Computer Science and Engineering, Indian Institute of Technology Bombay, Powai, Mumbai- 400076, India
Anant Madabhushi
Dept. of Biomedical Engineering, Rutgers University, Piscataway, NJ 08854, U.S.A.
Keywords:
Pulse diagnosis, Nonlinear dimensionality reduction, Time series analysis, C-LLE, LLE, Isomap, Mutual
information, Relative entropy.
Abstract:
In this paper, we present a novel method for analysis of Ayurvedic pulse signals via a recently developed non-
linear dimensionality reduction scheme called Consensus Locally Linear Embedding (C-LLE). Pulse Based
Diagnosis (PBD) is a prominent method of disease detection in Ayurveda, the system of Indian traditional
medicine. Ample anecdotal evidence suggests that for several conditions, PBD, based on sensing changes in
the patient’s pulse waveform, is superior to conventional allopathic diagnostic methods. PBD is an inexpen-
sive, non-invasive, and painless method; however, a lack of quantification and standardization in Ayurveda,
and a paucity of expert practitioners, has limited its widespread use. The goal of this work is to develop
the first Computer-Aided Diagnosis (CAD) system able to distinguish between normal and diseased patients
based on their PBD. Such a system would be inexpensive, reproducible, and facilitate the spread of Ayurvedic
methods. Digitized Ayurvedic pulse signals are acquired from patients using a specialized pulse waveform
recording device. In our experiments we considered a total of 50 patients. The 50 patients comprised of two
cohorts obtained at different frequencies. The first cohort comprised 24 patients that were normal or diseased
(slipped disc (backache), stomach ailments) while the second consists of a set of 26 patients who were nor-
mal or diseased (diabetic, with skin disorders, slipped disc (backache) and stress related headaches). In this
study, we consider the C-LLE scheme which non-linearly projects the high-dimensional Ayurvedic pulse data
into a lower dimensional space where a consensus clustering scheme is employed to distinguish normal and
abnormal waveforms. C-LLE differs from other linear and nonlinear dimensionality reduction schemes in that
it respects the underlying nonlinear manifold structure on which the data lies and attempts to directly estimate
the pairwise object adjacencies in the lower dimensional embedding space. A major contribution of this work
is that it employs non-Euclidean similarity measures such as mutual information and relative entropy to esti-
mate object similarity in the high-dimensional space which are more appropriate for measuring the similarity
of the pulse signals. Our C-LLE based CAD scheme results in a classification accuracy of 80.57% using rela-
tive entropy as the signal distance measure in distinguishing between normal and diseased patients for the first
cohort, based on their Ayurvedic pulse signal. For the 500Hz data we got a maximum of 88.34% accuracy
with C-LLE and relative entropy as a distance measure. Furthermore, C-LLE was found to outperform LLE,
Isomap, PCA across multiple distance measures for both cohorts.
1 INTRODUCTION
Diagnosis of bodily disorders by the analysis of
the arterial pulse techniques has been practised in
Ayurveda, a system of traditional Indian medicine. It
is believed that the functioning of the human body
is governed by three humors, vata, pitta and kapha,
together known as Tridosha. The Tridosha is ana-
lyzed by obtaining the pulse waveform observed at
the three positions on the wrist. The imbalances in
Tridosha pressure waveforms are sensed by the prac-
titioner who then identifies the presence and location
of the disorders in the body (Lad, 2005). Anecdotal
evidence strongly suggests that traditional Ayurvedic
pulse diagnosis is able to identify certain ailments,
such as stomach disorders and maladies in some preg-
388
Jog A., Joshi A., Chandran S. and Madabhushi A. (2009).
CLASSIFYING AYURVEDIC PULSE SIGNALS VIA CONSENSUS LOCALLY LINEAR EMBEDDING.
In Proceedings of the International Conference on Bio-inspired Systems and Signal Processing, pages 388-395
DOI: 10.5220/0001554903880395
Copyright
c
SciTePress

nant women, more easily compared to conventional
allopathic techniques. Pulse based diagnosis also has
the advantage of being inexpensive, non-invasive,and
painless. The practitioners ‘feel’ for a certain pattern
in the pulse which forms the basis of their diagno-
sis. This technique requires a high degree of exper-
tise. The paucity of expert Ayurvedic practitioners
has limited the more widespread use and popularity
of the Ayurvedic technique.
The goal of this work is to develop a computer
aided diagnosis (CAD) system for the automated, re-
producible analysis of Ayurvedic pulse signals. To
the best of our knowledge, this work represents the
first attempt at CAD of Ayurvedic pulse signals.
Since the Ayurvedic pulse signal is a time series,
pattern recognition methods that have been previously
applied to analysis of other time series data (ECG,
EMG) might seem appropriate for CAD of PBD.
Pattern recognition in electrocardiogram (ECG) has
been applied to QRS/PVC recognition and classifica-
tion, the recognition of ischemic beats and episodes,
and the detection of atrial fibrillation using nonlin-
ear transformations and neural networks (Maglav-
eras et al., 1998). In (Maglaveras et al., 1998), a
model-based approach for classification of ECG stud-
ies based on previously defined signatures of normal
and diseased ECG signals was employed. Given that
this is a first CAD attempt at Ayurvedic PBD, quan-
titative signatures for normal and diseased patterns
haveyet to be studied and modelled. We consequently
explore a domain independent scheme for classifica-
tion of the pulse data via dimensionality reduction.
Dimensionality reduction (DR), is a transforma-
tion of the original high-dimensional feature space
to a space of eigenvectors which are capable of de-
scribing the data in far fewer dimensions. DR also
permits the visualization of individual data classes
and identification of possible subclasses within the
high dimensional data. The most popular method for
DR is Principal Component Analysis (PCA) which
attempts to find orthogonal eigenvectors accounting
for the greatest amount of variability in the data.
PCA assumes that the data is linear and the embed-
ded eigenvectors represent low-dimensional projec-
tions of linear relationships between data points in
high-dimensional space. However, our previous re-
search has strongly suggested that biomedical data
is highly nonlinear in nature (Lee et al., 2008) and
that nonlinear DR schemes such as Isometric Map-
ping (Isomap) (Tenenbaum et al., 2000), Locally Lin-
ear Embedding (LLE), (Roweis and Saul, 2000) are
more appropriate for projection and subsequent clas-
sification of high-dimensional data including protein,
gene-expression, and spectroscopic data. LLE and
Isomap assume that the high dimensional data on a
high-order curve that is highly nonlinear and hence
object distances measured on this nonlinear manifold
should be geodesic as opposed to Euclidean. Nonlin-
ear methods attempt to map data along this nonlinear
manifold by assuming only neighboring points (deter-
mined via geodesic proximity) to be similar enough to
be mapped linearly with minimal error. The nonlinear
manifold can then be reconstructed based on these lo-
cally linear assumptions.
NLDR schemes like LLE determine the neighbor-
ing locations on the manifold (via Euclidean distance)
and map the neighborhood associated with each ob-
ject into the reduced dimensional embedding space.
The size of the local neighborhood within which LLE
assumes local linearity is however determined by a
free parameter κ. Optimal estimation of κ is still an
open problem. In (Tiwari et al., 2008) a new NLDR
scheme, C-LLE, that is able to handle the limitations
of LLE by avoiding the κ estimation, focusing instead
on optimally determining pairwise object distances in
the low dimensional embeddingspace, was presented.
Another limitation of LLE is that it traditionally
employs the Euclidean distance measure to deter-
mine neighbors within local patches on the manifold.
While the Euclidean distance measure is appropriate
for measuring the distance between objects character-
ized by discrete attributes, it is less appropriate for
measuring pulse signal similarity. Non-Euclidean dis-
tance measures such as mutual information (MI), en-
tropy correlation coefficient (ECC), and the relative
entropy (RE) have been shown to be more appropri-
ate for measuring the similarity between signals com-
pared to the L2 norm (Tononi et al., 1996). In this
paper, the C-LLE algorithm is employed in conjunc-
tion with such signal similarity measures as MI, ECC,
and RE to embed Ayurvedic pulse signals in a lower-
dimensional embedding space. Prior to embedding,
the pulse signals are first aligned with respect to each
other so that the pulse peaks for the different studies
are in concordance. A consensus clustering (Strehl
and Ghosh, 2002) algorithm is then employed to dis-
criminate between the normal and diseased pulse sig-
nals in the lower dimensional embedding space. The
major contributions of this work are:
• To the best of our knowledge, this is the first
CAD system for classification and analysis of tra-
ditional Indian Ayurvedic pulse medicine.
• Our CAD approach employs the C-LLE algo-
rithm that we have previously shown to outper-
form LLE, Isomap.
• We introduce the use of non-Euclidean distance
measures (MI, ECC, RE) geared specifically
to determining signal similarity for identifying
CLASSIFYING AYURVEDIC PULSE SIGNALS VIA CONSENSUS LOCALLY LINEAR EMBEDDING
389

neighbors in the high dimensional space. Our hy-
pothesis is that the use of these distance measures
will result in a more meaningful, accurate low di-
mensional embedding for pulse signal data.
The remainder of the paper is organized as follows.
Section 2 gives a brief review of dimensionality re-
duction methods used and the motivation for C-LLE.
Section 3 provides an overview of the CAD system.
Section 4 describes our experimental design and gives
a detailed description of C-LLE. In Section 5 we
present the qualitative and quantitative results of our
CAD system and concluding remarks, future direc-
tions are presented in Section 6
2 CONSENSUS LOCALLY
LINEAR EMBEDDING (C-LLE)
2.1 Limitations of Nonlinear
Dimensionality Reduction (NLDR)
Methods
NLDR schemes such as LLE (Roweis and Saul,
2000) and Isomap (Tenenbaum et al., 2000) assume
that an object in high-dimensional space can be de-
scribed by linear relationships with its nearest neigh-
bors. Both LLE and Isomap attempt to map ob-
jects c, d ∈ S that are adjacent (via geodesic dis-
tance) in high-dimensional space to nearby points in
the low-dimensional embedding, P(c), P(d), where
P(c), P(d) represent the Eigenvectors associated with
c, d ∈ S. LLE attempts to solve this problem by
defining a locally linear neighborhood for each c ∈ S,
the size of the neighborhood being determined by κ,
parameter controlling the size of the neighborhood
within which local linearity is assumed. LLE then at-
tempts to non-linearly project each c to P(c) so that
the κ neighborhood of c ∈ S is preserved. While
Roweis and Saul (Roweis and Saul, 2000) have sug-
gested that the lower dimensional embeddings are
greatly robust to κ values, our own experiments have
indicated otherwise (Lee et al., 2008). Note that,
Roweis and Saul’s experiments were performed on
dense, synthetic datasets that are very different from
highly noisy, nonlinear real world datasets considered
in this work. It is our contention that in general it is
not possible to find a global κ value that optimally fits
all parts of the high-dimensional data.
2.2 Motivation for Consensus Locally
Linear Embedding
One of the solutions to enable for LLE to work op-
timally and generally on real world data, κ needs to
be locally estimated in different regions in the data
space. While some researchers have recently begun
to explore approaches to locally and adaptively esti-
mate κ, (Tong and Zha, 2008) (Wang et al., 2004),
the C-LLE scheme aims to estimate the pair-wise ob-
ject adjacency
ˆ
W(i, j) in the low dimensional em-
bedding between two objects c
i
, c
j
∈ S, where i, j ∈
{1, ··· , |S|}. We formulate the problem of estimating
object distances
ˆ
W(i, j) as a Maximum Likelihood
Estimation problem (MLE) from multiple approxima-
tionsW
κ
(i, j) obtained by varying κ. The spirit behind
C-LLE is that it combines multiple low dimensional
data representations obtained via LLE for different
κ values to provide a stable embedding representing
the true class relationship between objects in the high
dimensional space. Analogous to constructing Bag-
ging classifier ensembles (Breiman, 1996), the idea
behind C-LLE is to combine multiple weak embed-
dings so that the strong final embedding accurately re-
flects low-dimensional relationships. In addition, C-
LLE allows for incorporation of non-Euclidean simi-
larity measures in the original pulse space. Our con-
tention is that these pulse signal similarity measures
are more appropriate compared to the L2 norm. In
(Tiwari et al., 2008), the utility of C-LLE in identi-
fying and classifying prostate cancer using the Mag-
netic Resonance Spectroscopic Imaging (MRSI) data
was demonstrated.
3 SYSTEM OVERVIEW
Our CAD system for Ayurvedic pulse signal classi-
fication (Figure 1) involves obtaining the Ayurvedic
pulse signals in digital form, after which they are
noise filtered and baseline corrected. The pulse sig-
nals are aligned with respect to each other based on
their peaks. The aligned pulse data is embedded in a
lower dimensional sub-space via C-LLE. The signals,
in their reduced low-dimensional representation, are
then classified into distinct classes via consensus
k-means clustering (Strehl and Ghosh, 2002).
Data Description. The two cohorts of 24 and 26
Ayurvedic pulse signals acquired at different frequen-
cies are briefly described in Table 1. The data was
collected by a pulse waveform acquiring device (Joshi
et al., 2007) that records the pressure felt by the sen-
sors at three different points. Although the device
BIOSIGNALS 2009 - International Conference on Bio-inspired Systems and Signal Processing
390
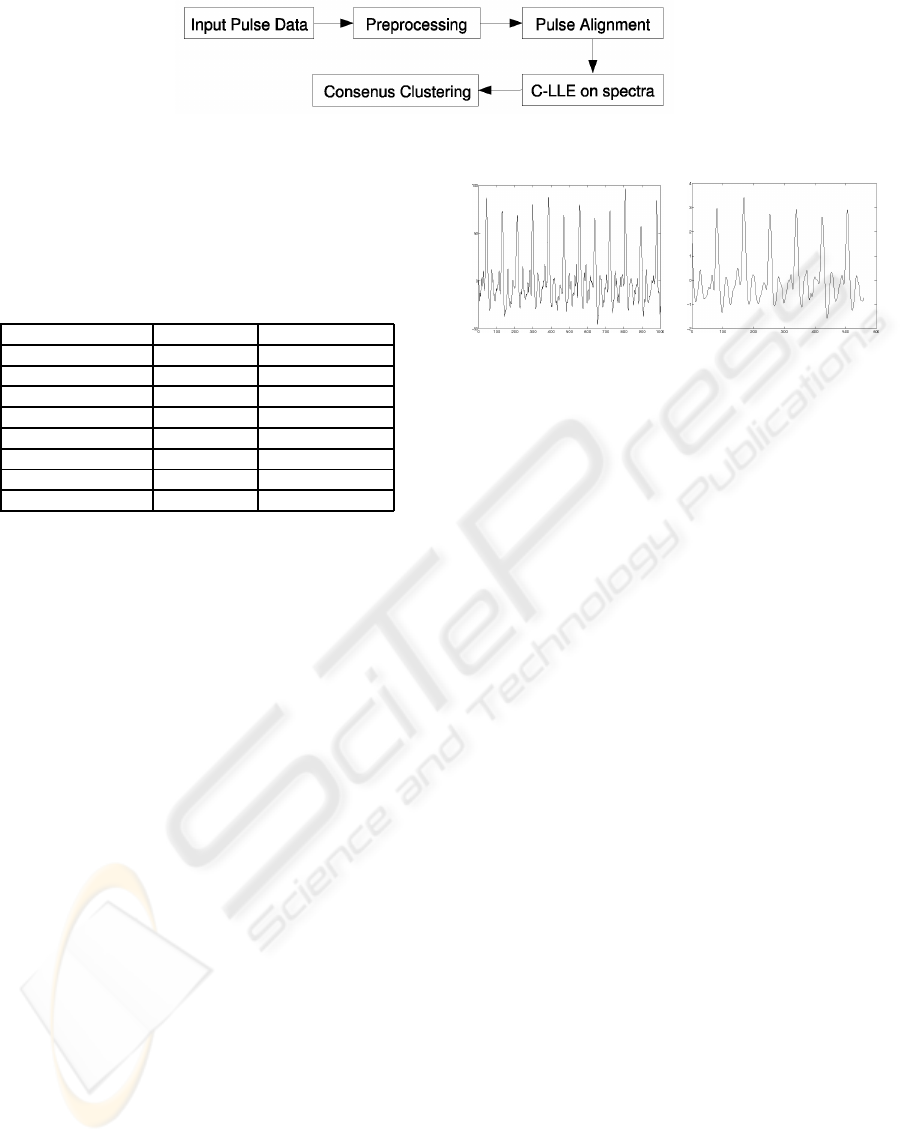
Figure 1: Flow diagram showing the different components of our C-LLE based Ayurvedic pulse diagnosis CAD system.
records all three pulse waveforms, we have used only
the Vata pulse for the purposes of this investigation.
The true condition for each patient was determined
by an expert Ayurvedic pulse practitioner.
Table 1: Description of patient database.
Condition Frequency No. of samples
Normal 100 10
Slipped disk 100 8
Stomach ailment 100 6
Normal 500 4
Diabetes 500 7
Slipped disk 500 5
Headaches 500 3
Stomach ailments 500 7
4 EXPERIMENTAL DESIGN
4.1 Pre-processing
For each patient study c ∈ S, there is an associated
D-dimensional valued pulse vector F(c) = [ f
t
(c) | t ∈
{1, ··· , D}] where f
t
(c) is the scalar pressure inten-
sity recorded at every instant. We denote via ∆ =
{LLE, Isomap, C-LLE} the set of dimensionality re-
duction techniques considered in this paper. For each
study c and associated pulse vector F(c), initial pre-
processing involves the following:
1. Respiration and artifact motion during pulse
waveform acquisition can introduce baseline wan-
der, which can be removed via the adaptive base-
line wander removal method described in (Xu
et al., 2002).
2. Each time series F(c) is filtered to remove high
frequency noise via a soft thresholding wavelet
scheme (Novak et al., 2000).
3. Each of the signals F(c), c ∈ S, is then centered on
the mean and normalized. Figure 2 shows a pulse
signal F(u) (a) prior to and (b) following noise
and baseline correction and pulse signal normal-
ization.
(a) (b)
Figure 2: The pulse signal (a) prior to and (b) following
noise and baseline correction and pulse signal normaliza-
tion.
4.2 Pulse Signal Alignment
Pulse signal alignment is a necessary prerequisite to
computing similarity between data points and identi-
fying neighbors in the high-dimensional pulse signal
space. For instance, if the Euclidean metric is em-
ployed to measure pulse signal similarity, an offset of
even a single time point can result in an incorrect dis-
tance value.
Each time-signal F(c) is characterized by a cer-
tain periodic pattern of peaks. A simple peak detec-
tion algorithm (Billauer, 2004) was used to find the
dominant peaks in F(c), ∀c ∈ S. The first occurrence
of a dominant peak in F(c) was identified on all c ∈ S
which were then aligned with respect to each other.
Note that while additional anchor points (additional
modes) could also have been used for the pulse signal
alignment, Figure 3(b) suggests that a single anchor
point (in this case the first dominant peak) resulted
in reasonable alignment. The pulse signal alignment
method is analogous to an intensity standardization
scheme that we previously presented (Madabhushi
and Udupa, 2005) to correct for nonlinear intensity
artifacts in MRI. Figure 3 shows the different signals
(a) prior to and (b) following alignment.
4.3 Similarity Measures
LLE, Isomap identify object neighbors as those that
are in proximity of each other in terms of the Eu-
clidean distance metric. The L2 norm is not however
optimally suited for measuring pulse signal similar-
ity. Consequently we consider several non-Euclidean
metrics (described in sections 4.3.1 - 4.3.4) that are
more appropriate for measuring signal similarity.
CLASSIFYING AYURVEDIC PULSE SIGNALS VIA CONSENSUS LOCALLY LINEAR EMBEDDING
391
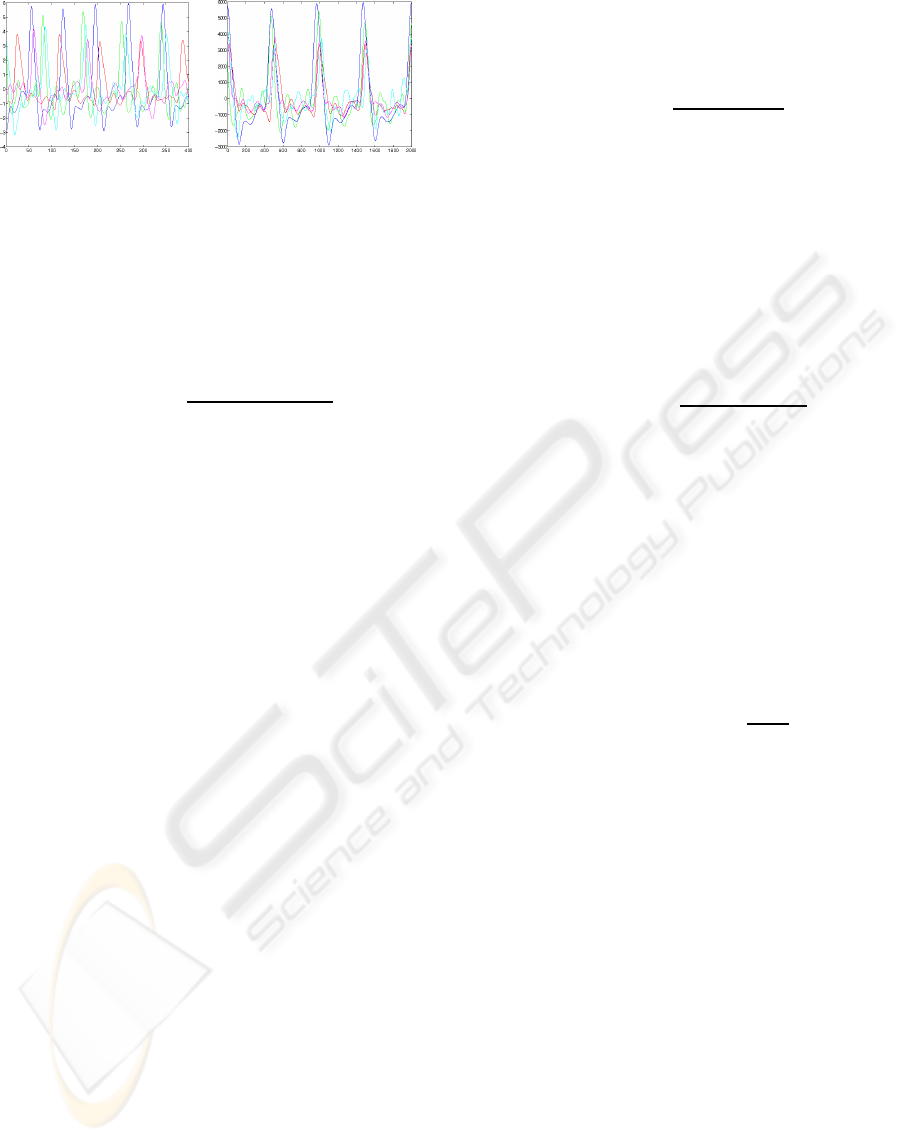
(a) (b)
Figure 3: Five pulse signals superimposed (a) before and
(b) after pulse signal alignment. Notice that the signals are
more aligned.
4.3.1 Euclidean Distance
Consider the two pulse signal vectors F(c) and F(d)
for c, d ∈ S. The Euclidean distance between them is
defined as
Γ
Eu
(c, d) =
r
∑
t
( f
t
(c) − f
t
(d))
2
(1)
where t ∈ {1, ..., D}. The Euclidean distance met-
ric requires the existence of an orthogonal coordi-
nate system. Since the individual components of F(c)
(f
t
(c), t ∈ {1, ··· , D}) do not constitute an orthogo-
nal basis, Euclidean distance is perhaps a sub-optimal
measure for determining signal similarity.
4.3.2 Normalized Mutual Information
In information theory, the Shannon entropy or infor-
mation entropy is a measure of the uncertainty asso-
ciated with a random variable. The vector of values
F(c), associated with a signal takes can be thought
of as a random variable. From a signal we can de-
rive the probability distribution of these values. These
probability distributions p(x
i
) are used to define the
information entropy of a discrete random variable
X = {x
1
, ··· , x
n
} as,
H(X) = −
n
∑
i=1
p(x
i
)log p(x
i
) (2)
Considering two random variables X and Y, their joint
entropy is defined to be
H(X, Y) = −
∑
x,y
p
x,y
log p
x,y
(3)
where p
x,y
is the probability density function for the
joint distribution of X and Y. The mutual information
(MI) between these two random variables is defined
to be
I(X, Y) = H(X) + H(Y) − H(X, Y) (4)
MI measures the dependence of one variable on the
other which is a similarity measure, is used widely
in medical image registration (Pluim et al., 2003). A
normalized variant of MI is defined as follows (Pluim
et al., 2003).
NMI(X, Y) =
H(X) + H(Y)
H(X, Y)
(5)
When the two variables X and Y are completely iden-
tical, NMI(X, Y) = 2. Thus, we define the distance
metric Γ
NMI
= 2− NMI.
4.3.3 Entropy Correlation Coefficient (ECC)
Another measure which can be directly calculated
from the entropy values is the Entropy Correlation
Coefficient (ECC) and is defined as follows (Pluim
et al., 2003):
ECC(X, Y) = 2−
2H(X, Y)
(H(X) + H(Y))
(6)
Therefore, ECC = 1 if the two distributions are iden-
tical and ECC = 0 if they are completely indepen-
dent. This allows us to define the distance metric
Γ
ECC
= 1− ECC.
4.3.4 Relative Entropy
Relative Entropy (RE), or the Kullback-Leibler Dis-
tance (Cover and Thomas, 1991), used for measuring
the distance between probability distributions is de-
fined as follows:
RE(X, Y) =
∑
i
p(x
i
)log
p(x
i
)
p(y
i
)
(7)
or in other words
RE(X, Y) = C(X, Y) − H(X) (8)
where C(X, Y) is defined as the cross entropy of the
two variables. Note that while the Euclidean, MI, and
ECC measures are both symmetric and reflexive, the
RE measure is only reflexive.
4.4 Consensus Locally Linear
Embedding Framework
The spirit behind C-LLE is that it combines multiple
low-dimensional data representations obtained via
LLE for different κ values to provide a stable embed-
ding representing the true class relationship between
objects in the high dimensional space. Analogous to
constructing Bagging classifier ensembles (Breiman,
1996), the idea behind C-LLE is to combine multiple
weak embeddings so that the strong final embedding
accurately reflects low-dimensional relationships.
BIOSIGNALS 2009 - International Conference on Bio-inspired Systems and Signal Processing
392

Step 1. Generating multiple lower dimen-
sional embeddings by varying the parameter κ:
We generate a set of multiple embeddings S
κ
(c)
for c ∈ S, by varying the neighborhood parameter
κ ∈ {2, . . . , K} using LLE. The distance between
any two objects c
i
, c
j
∈ S and i, j ∈ {1, . . . , |S|} is a
function of κ. Thus ||S
κ
(c
i
) − S
κ
(c
j
)||
ψ
will vary as a
function of κ, where ψ is the distance measure.
Step 2. Obtain MLE of pairwise object adja-
cency:
A confusion matrix W
κ
∈ ℜ
|S|×|S|
representing the
adjacency between any two time series c
i
, c
j
∈ S and
i, j ∈ {1, . . . , |S|} in the lower dimensional embedding
S
κ
(c) is calculated as:
W
κ
(i, j) = D
κ
(c
i
, c
j
) =
S
κ
(c
i
) − S
κ
(c
j
)
ψ
, (9)
where κ ∈ {2, ··· , K}. MLE of D
κ
(c
i
, c
j
) is estimated
as the mode of all adjacency values in
ˆ
D
κ
(i, j) over
all κ. This
ˆ
D for all c ∈ S is then used to obtain the
new confusion matrix
ˆ
W.
Step 3. Multidimensional scaling (MDS):
We apply multidimensional scaling (Venna and
Kaski, 2006) (MDS) to
ˆ
W to achieve the final stable
embedding
˜
S(c), for all c ∈ C. MDS is implemented
as a linear method that preserves the Euclidean
geometry between each pair of objects c
i
, c
j
∈ S, i,
j ∈ {1, ..., |S|}. This is done by finding optimal posi-
tions for the data points c
i
, c
j
in lower-dimensional
space through minimization of the least squares error
in the input pairwise Euclidean distances in
ˆ
W. After
the application of LLE in Step:1, we have essentially
embedded the points in a linear subspace, where the
L2 norm is appropriate.
4.5 Consensus k-means Clustering on
the Embedding
Let Q be the set of all low dimensions we are rang-
ing over for embedding. The output of MDS is an
embedding location
˜
S(c), ∀c ∈ S which spans Q ∈
{3, ··· , 15}. This set can be represented by a |S| × q
matrix where each row is an embedding in q dimen-
sional space of the original point in q dimensions
where q ∈ Q. The next step on acquiring the embed-
ding in lower dimensions is to group all c ∈ S points
into two clusters (normal and abnormal). For the
first cohort consisting of 100Hz data, we are group-
ing the points into normal and abnormal cluster. This
grouping is done using consensus k-means clustering
algorithm (Strehl and Ghosh, 2002). To overcome
the instability associated with centroid based cluster-
ing algorithms like k-means clustering, we generate
multiple weak clusterings V
1
a
, V
2
a
, a ∈ {1, . . . A} by
repeated application of k-means clustering on
˜
S(c),
∀c ∈ S, a total of A times. Each cluster is a set of ob-
jects assigned the same label V
1
a
, V
2
a
, by the k-means
algorithm. As the number of objects in a cluster keep
on changing, we calculate a co-association matrix H
with the assumption that points belonging to a natu-
ral cluster are very likely to be co-located in the same
cluster for each iteration a. Co-occurrences of pairs
of points c
i
, c
j
∈ S are taken as votes for their asso-
ciation. H(i, j) thus is the number of times c
i
and c
j
were found in the same cluster over A iterations. If
H(i, j) = A, it is highly likely that c
i
and c
j
belong to
the same cluster. MDS to H followed by a final un-
supervised classification using k-means clustering is
used to obtain the final stable clusters
˜
V
1
and
˜
V
2
.
5 RESULTS
5.1 Qualitative Results
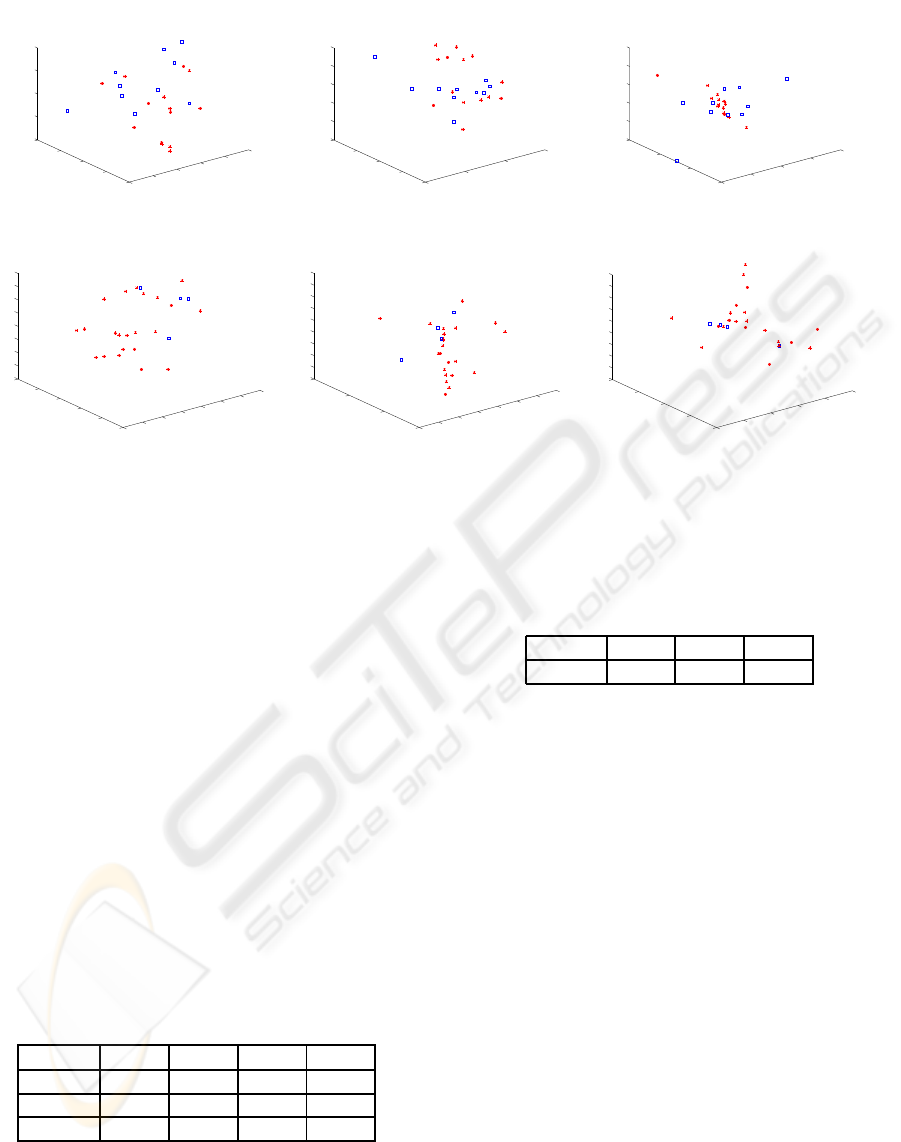
Figure 4 (a) (d) show the low-dimensional embedding
representation of the 100Hz and 500Hz data respec-
tively obtained via C-LLE. Figures 4 (b) (c) show the
corresponding embedding results obtained with LLE
and PCA for the 100Hz cohort and figures 4 (e) (f)
for LLE and Isomap embeddings the 500Hz data. In
each case, the blue squares represent the normal stud-
ies and red stars represent diseased cases. The embed-
ding results in Figures 4(a)-(c) were all obtained by
projecting the aligned pulse data into 3 dimensions
via the relative entropy similarity measure. In com-
paring Figures 4(a)-(c), and Figures 4 (d)-(f) it is ap-
parent that the greatest separation between the normal
and diseased studies is obtained via C-LLE. LLE per-
forms marginally better compared to PCA in terms of
separating the pulse signals, reinforcing further that
NLDR schemes outperform linear DR schemes for
biomedical data.
5.2 Quantitative Results
In order to quantitatively evaluate the different ap-
proaches, the following experiments were performed:
(a) C-LLE was compared against other NLDR meth-
ods (LLE, Isomap) in terms of classification accuracy
and for different similarity measures (b) the effect of
pulse signal alignment of the data on the results of
NLDR was analyzed for the 100Hz signal. For the
500Hz signal we compare the performance of C-LLE
over different similarity measures.
CLASSIFYING AYURVEDIC PULSE SIGNALS VIA CONSENSUS LOCALLY LINEAR EMBEDDING
393
−0.3
−0.2
−0.1
0
0.1
0.2
−0.4
−0.2
0
0.2
0.4
−0.2
−0.1
0
0.1
0.2
−1
−0.5
0
0.5
−0.4
−0.2
0
0.2
0.4
−0.6
−0.4
−0.2
0
0.2
0.4
−5
0
5
10
15
x 10
4
−5
0
5
10
x 10
4
−6
−4
−2
0
2
4
x 10
4
(a) (b) (c)
−0.4
−0.3
−0.2
−0.1
0
0.1
0.2
0.3
−0.6
−0.4
−0.2
0
0.2
0.4
−0.4
−0.3
−0.2
−0.1
0
0.1
0.2
0.3
0.4
−0.6
−0.4
−0.2
0
0.2
0.4
0.6
0.8
−0.5
0
0.5
1
−0.4
−0.3
−0.2
−0.1
0
0.1
0.2
0.3
0.4
0.5
−0.6
−0.4
−0.2
0
0.2
0.4
−0.2
−0.1
0
0.1
0.2
−0.25
−0.2
−0.15
−0.1
−0.05
0
0.05
0.1
0.15
0.2
(d) (e) (f)
Figure 4: Low-dimensional embedding of 100Hz pulse data obtained via (a) C-LLE, (b) LLE, and (c) PCA after alignment,
and the same for 500Hz data using (d) C-LLE, (e) LLE (f) Isomap. The red asterisks represent diseased pulse samples whereas
the blue squares represent normal.
5.2.1 Comparison of C-LLE with other DR
Methods for Different Similarity Measures
We compare the classification accuracy as obtained
by C-LLE with LLE and Isomap over the 4 simi-
larity measures Γ
Eu
, Γ
NMI
, Γ
ECC
and Γ
Re
. Table 2
clearly indicates that C-LLE achieves a higher classi-
fication accuracy than LLE and Isomap for all 4 simi-
larity measures for the 100Hz cohort normal vs abnor-
mal classification. C-LLE with Γ
Re
as the similarity
measure yields a classification accuracy of 80.57%,
significantly higher compared to LLE and Isomap.
With the exception of Γ
Eu
, all C-LLE results are over
70%. The classification accuracy for Γ
Eu
is the lowest
among all similarity measures for all the 3 methods.
Table 2: Classification accuracy in (%) of DR methods for
100Hz data for normal vs abnormal classification after pulse
alignment.
∆|Γ Γ
Re
Γ
NMI
Γ
ECC
Γ
Eu
C-LLE 80.57 72.20 70.83 60.08
LLE 64.16 60.83 61.67 41.66
Isomap 46.36 21.00 58.82 48.67
For the 500Hz signal, we obtained the follow-
ing results for C-LLE across 3 similarity measures.
We observe that Γ
Re
provides the highest accuracy of
classification of 88.34%.
Table 3: Classification accuracy (in %) of C-LLE for 500Hz
data for normal vs abnormal classification.
∆|Γ Γ
Re
Γ
NMI
Γ
Eu
C-LLE 88.34 71.15 76.92
5.2.2 Effect of Pulse Signal Alignment on
Classification Accuracy of C-LLE and
LLE over 4 Different Similarity Measures
Table 4 lists the classification accuracy obtained via
C-LLE and LLE over different similarity measures
with and without pulse signal alignment for the
100Hz data set for normal vs abnormal classification.
The columns ‘w’ indicate with alignment, ‘w/o’ is
without alignment. As the results in Table 4 clearly
reveal, the classification accuracy results obtained fol-
lowing pulse signal alignment are consistently higher
compared to the results obtained without pulse sig-
nal alignment, independent of the NLDR method and
similarity measure employed.
6 CONCLUDING REMARKS AND
FUTURE WORK
In this paper we have presented a novel nonlinear di-
mensionality reduction technique (Consensus Locally
BIOSIGNALS 2009 - International Conference on Bio-inspired Systems and Signal Processing
394

Table 4: Effect of Pulse Signal Alignment on the Classification Accuracy (in %) for the 100Hz data.
∆|Γ Γ
Eu
Γ
NMI
Γ
Re
Γ
ECC
– w w/o w w/o w w/o w w/o
C-LLE 60.08 50.59 72.20 32.74 80.57 32.73 70.83 50.00
LLE 41.66 54.50 60.83 55.35 64.16 52.38 61.67 52.97
Isomap 55.35 61.16 21.00 52.97 46.36 31.67 58.82 32.91
Linear Embedding) for the classification and analy-
sis of Ayurvedic pulse signals. To the best of our
knowledge, this is the first CAD system for analysis
of traditional Ayurvedic pulse signals. Another im-
portant contribution of the paper is the use of non-
Euclidean similarity measures that are more appro-
priate for measuring pulse signal similarity. These
measures (Mutual Information, Relative Entropy, and
Entropy Correlation Coefficient) were all found to
consistently result in better classification compared
to the L2 norm, independent of the NLDR method
used. Additionally, C-LLE consistently outperformed
LLE and Isomap for all 4 similarity measures consid-
ered. C-LLE with relative entropy as a distance mea-
sure provided a maximum accuracy of 80.57% for the
100Hz data, and a maximum of 88.34% for the 500Hz
data. In future work, we will explore in greater detail
the pulse signals that were misclassified by our CAD
scheme. We will also explore alternative representa-
tions of the data such as independent components and
H¨older exponents for feature selection. Finally, we
will be looking to evaluate our methods on a larger
data cohort.
REFERENCES
Billauer, E. (2004). peakdet: Peak detection using matlab.
Breiman, L. (1996). Bagging predictors. Machine Learn-
ing, 24(2):123–140.
Cover, T. M. and Thomas, J. A. (1991). Elements of Infor-
mation Theory. John Wiley & Sons, Inc.
Joshi, A., Kulkarni, A., Chandran, S., Jayaraman, V. K., and
Kulkarni, B. D. (2007). Nadi tarangini: A pulse based
diagnostic system. In IEEE Engineering in Medicine
and Biology Society, pages 2207–2210.
Lad, V. (2005). Secrets of the the pulse: The ancient art of
ayurvedic pulse diagnosis. Motilal Banarasidass.
Lee, G., Rodriguez, C., and Madabhushi, A. (2008). Investi-
gating the efficacy of nonlinear dimensionality reduc-
tion schemes in classifying gene and protein expres-
sion studies. IEEE/ACM Transactions on Computa-
tional Biology and Bioinformatics, 5(3):368–384.
Madabhushi, A. and Udupa, J. (2005). Evaluating inten-
sity standardization and inhomogeneity correction in
magnetic resonance images. IEEE Transactions on of
Medical Imaging, 24(5):561–576.
Maglaveras, N., Stamkopoulos, Diamantaras, T., C., P., and
Strintzis, M. (1998). Ecg pattern recognition and clas-
sification using non-linear transformations and neural
networks: A review. International Journal of Medical
Informatics, 52(1-3):191–208.
Novak, D., Eck, C., Perez-Cortes, J. V., and Andreu-Garcia,
G. (2000). Denoising electrocardiographic signals us-
ing adaptive wavelets. In BIOSIGNAL.
Pluim, J., Maintz, P. W., and Viergever, M. (2003). Mutual-
information-based registration of medical images: A
survey. IEEE Transactions on Medical Imaging.
Roweis, S. and Saul, L. (2000). Nonlinear dimensionality
reduction by locally linear embedding. Science, v.290,
pages 2323–2326.
Strehl, A. and Ghosh, J. (2002). Cluster ensembles – a
knowledge reuse framework for combining multiple
partitions. Journal on Machine Learning Research
(JMLR), 3:583–617.
Tenenbaum, J. B., de Silva, V., and Langford, J. C. (2000).
A global geometric framework for nonlinear dimen-
sionality reduction. Science.
Tiwari, P., Rosen, M., and Madabhushi, A. (2008). In MIC-
CAI, volume 5242, pages 330–338.
Tong, L. and Zha, H. (2008). Riemannian manifold learn-
ing. IEEE Transactions on Pattern Analysis and Ma-
chine Intelligence, 30:796–809.
Tononi, G., Sporns, O., and Edelman, G. M. (1996). A
complexity measure for selective matching of signals
by the brain. PNAS, 93(8):3422–3427.
Venna, J. and Kaski, S. (2006). Local multidimensional
scaling. Neural Networks, 19:889–899.
Wang, J., Zhang, Z., and Zha, H. (2004). Adaptive manifold
learning. NIPS.
Xu, L., Zhang, D., and Kuanquan, W. (2002). Adaptive
baseline wander removal in the pulse waveform. pages
143–148.
CLASSIFYING AYURVEDIC PULSE SIGNALS VIA CONSENSUS LOCALLY LINEAR EMBEDDING
395
