A BIOMETRIC IDENTIFICATION SYSTEM BASED ON THYROID
TISSUE ECHO-MORPHOLOGY
∗
José C. R. Seabra
Instituto de Sistemas e Robótica, Instituto Superior Técnico, Av. Rovisco Pais, Torre Norte 6
o
piso, 1049-001 Lisboa, Portugal
Ana L. N. Fred
Instituto de Telecomunicações, Instituto Superior Técnico, Av. Rovisco Pais, Torre Norte 10
o
piso, 1049-001 Lisboa, Portugal
Keywords:
Biometrics, Thyroid gland, Ultrasound, Acoustic impedance, Texture, Diagnosis.
Abstract:
This paper proposes a biometric system based on features extracted from the thyroid tissue accessed through
2D ultrasound. Tissue echo-morphology, which accounts for the intensity (echogenicity), texture and structure
has started to be used as a relevant parameter in a clinical setting. In this paper, features related to texture,
morphology and tissue reflectivity are extracted from the ultrasound images and the most discriminant ones
are selected as an input for a prototype biometric identification system. Several classifiers were tested, with
the best results (90% identification rate) being achieved with the maximum a posteriori classifier. Another
classifier which only takes into account the reflectivity parameter achieved a reasonable identification rate of
70%. This suggests that the acoustic impedance (reflectivity) of the tissue is a good parameter to discriminate
between individuals. This paper shows the effectiveness of the proposed classification, which can be used not
only as a new biometric modality but also as a diagnostic tool.
1 INTRODUCTION
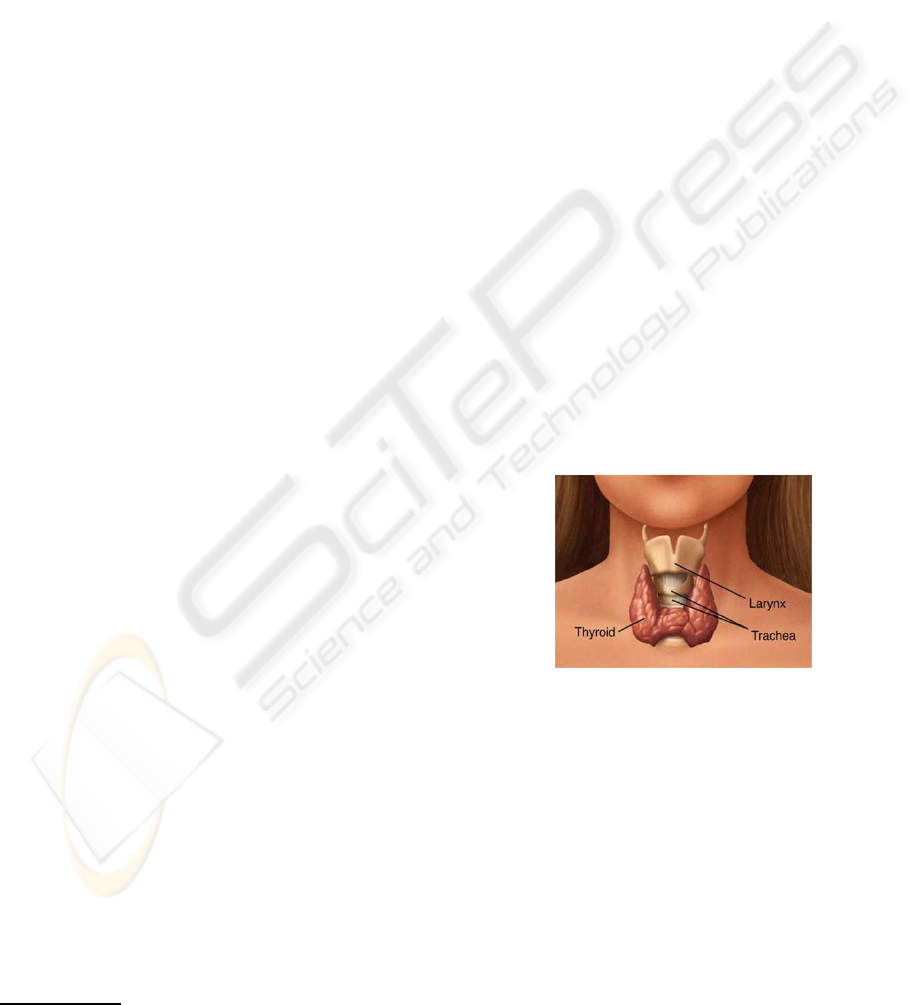
The thyroid is one of the largest endocrine glands in
the body (see Fig.1). It controls how quickly the body
burns energy, makes proteins and how sensitive the
body should be to other hormones (Tor00). Thyroid
ultrasonography is a non-invasive diagnostic exam,
which provides immediate information on the struc-
ture and the characteristics of thyroid glands. This
imaging modality is widely used in clinical practice
because it combines low cost, short acquisition time,
absence of ionizing radiations and sensitivity in ascer-
taining the morphology of the thyroid gland, as well
as the size and number of thyroid nodules.
The ultrasound images usually present a low sig-
nal to noise ratio (SNR) and are characterized by a
type of multiplicativenoise called speckle that accom-
panies all coherent imaging modalities. It appears
when images are obtained by using coherent radiation
and is the result of the constructiveand destructive in-
terference of the echoes scattered from heterogeneous
tissues and organs (AT79).
∗
Partially supported by FCT, under ISR/IST plurianual funding
Figure 1: Anatomy of the thyroid gland.
The characteristic granular speckle pattern present
in the ultrasound images makes the diagnostic task
harder, whereas the subjectivity involved in their in-
terpretation can be regarded as their major drawback.
A framework which could provide explicit features
extracted from the images would lead to a more re-
liable medical diagnosis, providing the experts with a
second opinion and reducing the misdiagnosis rates.
Some studies have been developed which aim at
characterizing the thyroid tissue using ultrasound im-
age processing and analysis. Image intensity infor-
mation has been used for the identification of thyroid
Hashimoto disease (MBSE86), for the detection of
186
C. R. Seabra J. and L. N. Fred A. (2009).
A BIOMETRIC IDENTIFICATION SYSTEM BASED ON THYROID TISSUE ECHO-MORPHOLOGY.
In Proceedings of the International Conference on Bio-inspired Systems and Signal Processing, pages 186-193
DOI: 10.5220/0001556501860193
Copyright
c
SciTePress
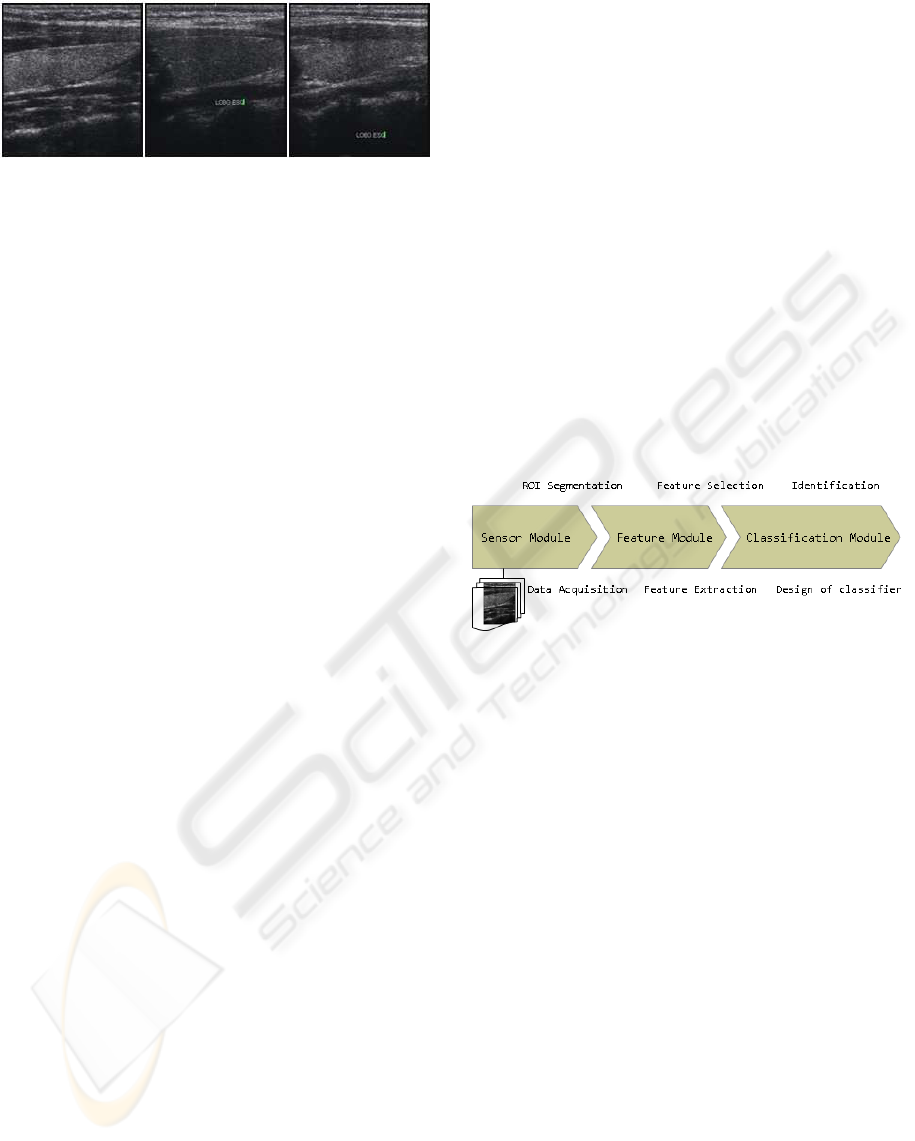
Figure 2: Examples of thyroid ultrasound images, present-
ing different echo-morphologies. a) Hyperechogenic, b)
Hypoechogenic and c) Heterogeneous thyroids.
nodular thyroid lesions, and for thyroid tumor classifi-
cation. Textural image information encoded by means
of co-occurrence matrix features (HDS73) have been
used for identification of chronic inflammations of the
thyroid gland (SSST03b; SSST03a) and for the dis-
crimination between normal and pathologic tissues
(CMAL06).
Tissue echo-morphology, which accounts for the
intensity (echogenicity), texture and structure, has
started to be used as a relevant parameter in a clinical
setting (see Fig.2). Basically, features extracted from
a given region, tissue or organ can be used to iden-
tify (classify) a patient as normal or as suffering from
a pathological condition. In a classification context,
this is considered to be a two-class problem.
This paper proposes a biometric system based on
features extracted from the thyroid tissue accessed
through 2D ultrasound. Biometrics deals with iden-
tification of individuals based on their biological or
behavioral characteristics. Identification (Who am I?)
refers to the problem of establishing a subject’s iden-
tity - either from a set of already known identities
(closed identification problem) or otherwise (open
identification problem) (PKM
+
07).
Thyroid tissue echo-morphology qualify to be a
biometric because it is a universal feature, which
means that every person has the characteristic, is dis-
tinct from one individual to another, is permanent and
can be easily collected through a common ultrasound
scanner.
The paper is organized as follows. Section 2 for-
mulates the problem and section 3 describes the fea-
ture module used in the biometric system. Section 4
presents the classifiers used in the identification prob-
lem. Section 5 presents the results obtained by the
biometric system and section 6 concludes the paper.
2 PROBLEM FORMULATION
In this paper, an analogy between two problems is
made. In the contextof medical diagnosis, a subject is
assigned to one of two classes N (normal) or P (patho-
logical). The risk of classifying pathological patients
as normal (false negatives) should be penalized. Re-
garding a biometric identification problem, there is
a class assigned to each individual. The maximum
likelihood probabilities (or other types of scores) are
computed in order to label the individual with its cor-
responding class.
The problem addressed in this paper can be stated
as follows: given C
i
classes, each corresponding to
a different individual (registered in the database), and
O
i
observations, corresponding to 2Dultrasound sam-
ple images of the thyroid tissue recorded from each
individual, establish the identity of new observations
(label to the corresponding classes), which is a typical
Human identification problem
The diagram block of the biometric system used
in this paper is illustrated in Fig.3. It is mainly com-
posed of three modules: (i) the sensor module, (ii) the
feature extraction module, and (iii) the classification
module.
Figure 3: Diagram block of the biometric identification sys-
tem.
The sensor module accounts for image acquisi-
tion. Ultrasound images of the thyroid gland were ac-
quired longitudinally and transversally to the neck of
10 individuals, using a ultrasound scanner (Siemens
Sonoline G50) operating in brightness (B-) mode. For
each individual, the two lobes of the thyroid were
scanned and 2 images per lobe were acquired. All
thyroids were scanned under the same operating con-
ditions in order to make the echo-morphological fea-
tures extracted from the images independent on the
scanner properties.
3 FEATURE MODULE
The feature module is an important part of the bio-
metric system because it determines which features
are used for identification. In this section it is also
important to consider how the thyroid glands are seg-
mented from the ultrasound images, which features
qualify for individual characterization, and from those
features which of them are more relevant for discrim-
inating between classes (subjects).
A BIOMETRIC IDENTIFICATION SYSTEM BASED ON THYROID TISSUE ECHO-MORPHOLOGY
187
3.1 Segmentation
Before extracting the relevant features which describe
the echo-morphology of the thyroid glands it is im-
portant to segment its anatomy from the ultrasound
images. This is a step that should be take into account
in order to develop an automatic and robust biometric
tool.
The thyroid glands are the regions of interest from
where the features could be extracted. This can be
done by manually outline the contours of the thyroid,
which is incredibly tedious and time-consuming.
One way to circumvent this problem is to use
automatic or semi-automatic methods (Active Con-
tours (XP98), Level Sets (vBSVN02), Graph Cuts
(BVZ01; KZ04)). In this paper, a semi-automatic
method based on Gradient Vector Flow (GVF) active
contours (snakes) is used.
Active contours, or snakes, are computer-
generated curves that move within images to find the
boundaries of the region of interest. The GVF snake
begins with the calculation of a field of forces, called
the GVF forces, over the image domain. The GVF
forces are used to drive the snake, modeled as a phys-
ical object having a resistance to both stretching and
bending towards the boundaries of the object. The
GVF forces are calculated by applying generalized
diffusion equations to both components of the gra-
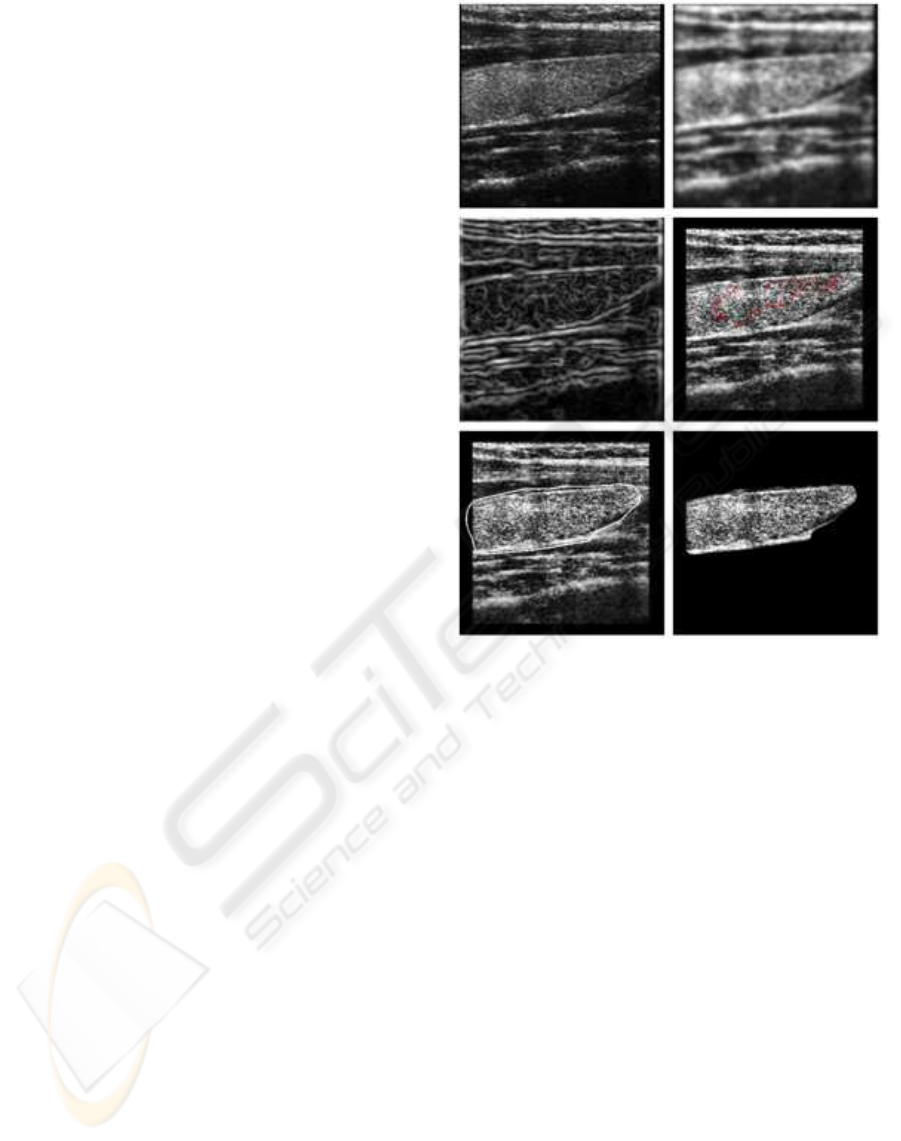
dient of an image edge map (see Fig.4). The semi-
automatic nature of the segmentation process is due
to user-dependent initialization: in fact, to make the
method more robust, the user should provide a rough
initialization of the contour by giving some initial
clicks on the image.
3.2 Feature Extraction
After obtaining the segmented thyroid glands, 6 rect-
angular windows (32 by 32 pixels) were extracted
from each lobe (see Fig.5). Three different types of
features are then computed for each rectangular win-
dow: (i) the rayleigh parameter, (ii) 3 wavelet energy
coefficients, (iii) 4 radon transform parameters. These
features are also combined with the longitudinal mid-
distance measure for each thyroid gland. This dis-
tance corresponds to the vertical distance measured
between the borders of the thyroid at its middle sec-
tion.
3.3 Rayleigh Parameter
The speckle pattern present in the ultrasound images
is a result of the interference of echoes at the surface
Figure 4: Semi-automatic segmentation using GVF active
contours (from top left to bottom right): (i) original image,
(ii) image convolved with gaussian mask, (iii) image edge
map, (iv) initialization, (v) final contour, (vi) segmented
thyroid.
of the transducer, which emanate from the acoustic
impedance of the tissues.
Several statistical models are proposed in the lit-
erature to describe this kind of pattern (MT06). One
of the most used in ultrasound (US), LASER and Syn-
thetic Aperture Radar (SAR) is the Rayleigh distribu-
tion (Bur78). Commonly the speckle pattern is called
speckle noise, and is often studied in de-noising prob-
lems. Another view of the problem, which is con-
sidered in this paper, is to accurately reconstruct the
ultrasound images to provide a measure of the local
acoustic impedance of the tissues.
In this context, a bayesian reconstruction method
with a log-Euclidean prior is used (SXS08). In this
approach, the ill-poseness nature of the reconstruc-
tion (de-noising) problem is circumvented by using a
priori information about the unknown image to be es-
timated. The estimation is formulated as an optimiza-
tion task where a two-term energy function is mini-
mized. The first term pushes the solution toward the
observations and the second regularizes the solution.
BIOSIGNALS 2009 - International Conference on Bio-inspired Systems and Signal Processing
188
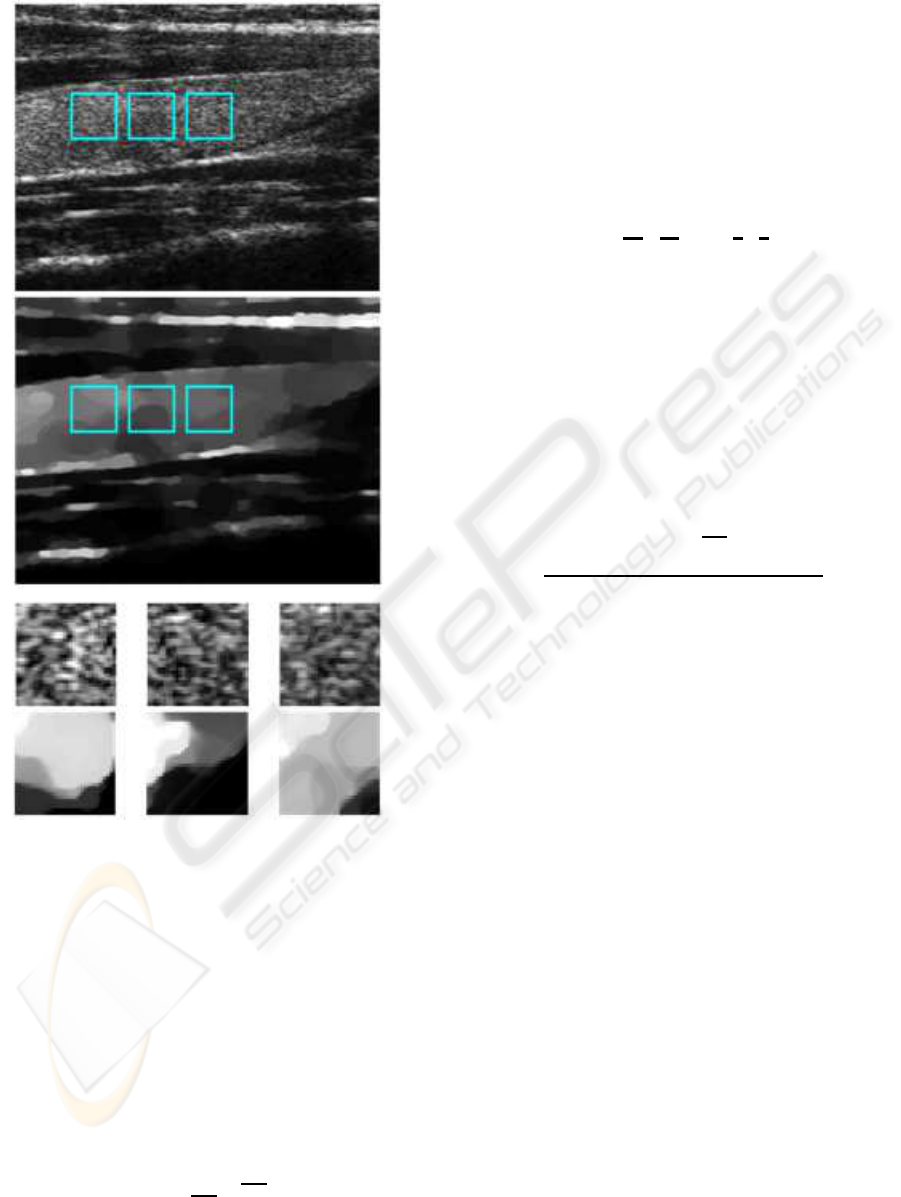
Figure 5: (i) Original image, (ii) reconstructed image (lo-
cal rayleigh parameters), and (iii) rectangular windows are
extracted from each thyroid lobe.
The reconstruction procedure is formulated as the
optimization of a convex function and a Newton
method is adopted to obtain the minimizer (BV04).
This strategy guarantees a convergence to the global
minimum in a small number of iterations.
Let X = {x
i, j
} and Y = {y
i, j
} be a N ×M image
presenting the acoustic impedance of the tissue and
a speckle image, respectively. The speckle pattern of
the image Y = {y
i, j
} is described by a Rayleigh dis-
tribution,
p(y
i, j
|x
i, j
) =
y
i, j
x
i, j
e
−
y
2
i, j
2x
i, j
. (1)
The estimation of X from Y is formulated as the
following optimization task
ˆ
X = argmin
X
E(X,Y), (2)
where E(X,Y) is an energy function.
The optimization problem, described by equation
(2), is usually ill-posed in the Hadamard sense. This
difficulty may be overcome by using the maximum a
posteriori (MAP) criterion,
E(X,Y) = E
Y
(X,Y)
| {z }
data fidelity term
+ E
X
(X)
| {z }
prior term
, (3)
where E
Y
(X,Y), called data fidelity term, is the sym-
metric of the log-likelihood function
E
Y
(X,Y) = −log
"
N,M
∏
i, j=1
p(y
i, j
|x
i, j
)
#
, (4)
where it is assumed statistical independence of the ob-
servations (DSL98).
The energy function to be minimized is given by
E(F,Y) =
∑
i, j
"
y
2
i, j
2
e
−f
i, j
+ f
i, j
#
(5)
+α
∑
i, j
q
( f
i, j
− f
i−1, j
)
2
+ ( f
i, j
− f
i, j− 1
)
2
+ ε.
The solution is an image (see Fig.5 (ii) and (iii)),
in which the value of each pixel is the Rayleigh pa-
rameter that characterizes accurately the local reflec-
tivity of the tissue being scanned.
3.4 Wavelet Energy Coefficients
Texture information is hypothesized as being a rele-
vant parameter to discriminate between thyroids and
therefore individuals. One way to assess the texture of
a thyroid image is to decompose it using 2D wavelets
(see Fig.6).
This kind of decomposition consists in using low
and high pass filters onto the approximation coeffi-
cients at level j (the original image) in order to obtain
the approximation at level j+1, and the details in three
orientations (horizontal, vertical, and diagonal). This
method is performed along 3 levels. Every subimage
contains information of a specific scale and orienta-
tion, which is conveniently separated. Spatial infor-
mation is retained within the subimages. The amount
of detail for each resolution level, which accounts for
the level of heterogeneity in the thyroid gland, is com-
puted as the sum of horizontal, vertical and diago-
nal detail energies for each level. Therefore, multi-
resolution measures of heterogeneity are used as in-
puts for the biometric identification system.
A BIOMETRIC IDENTIFICATION SYSTEM BASED ON THYROID TISSUE ECHO-MORPHOLOGY
189
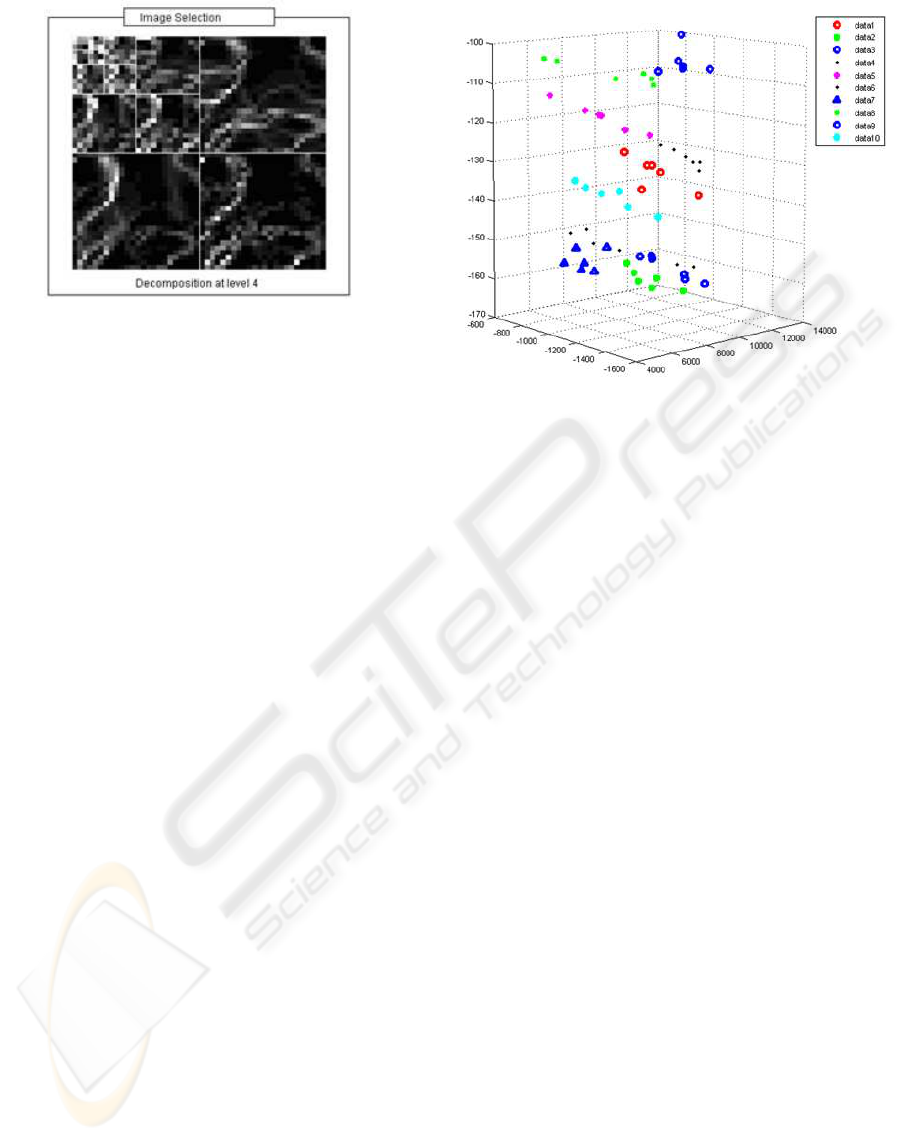
Figure 6: Wavelet decomposition. Multi-resolution texture
is assessed through the detail energy levels.
3.5 Radon Transform Features
In this paper, it is also hypothesized that the thyroid
tissue may be characterized by different directionality
patterns observed in the ultrasound images. The en-
coding of the directional patterns is realized by means
of Radon Transform features (SIDM07). The idea is
to project the image intensity along a radial line ori-
ented at different angles (0, 45, 90 and 135 degrees).
Let (x,y) be the cartesian coordinates of a point in
a 2D image, and u(x,y) the image intensity. Then, the
2D radon transform denoted as R
u
(ρ,θ) is given by
R
u
(ρ,θ) =
R
+∞
−∞
R
+∞
−∞
u(x,y)δ(ρ−xcosθ−ysinθ)dxdy
where ρ is the perpendicular distance of a line
from the origin and θ is the angle formed by the dis-
tance vector. The feature vector can be defined as
F = [σ([R
u
1
(ρ,θ
1
)...,R
u
n
(ρ,θ
1
)]), (6)
σ([R
u
1
(ρ,θ
2
)...,R
u
n
(ρ,θ
2
)]),
...,σ([R
u
1
(ρ,θ
1
)...,R
u
n
(ρ,θ
p
)])],
where σ() accounts for the contribution of
the radon transform along a given angle θ
i
=
{0,45, 90,135
o
}.
3.6 Dimensionality Reduction
At this point, 9 features per sample (each sample cor-
responding to a rectangular window) were extracted:
1 Rayleigh parameter, 1 mid-distance measure, 3
wavelet energies, and 4 radon transform parameters.
The amount of features extracted (9 features per sam-
ple, 6 samples per thyroid lobe, 2 lobes per individ-
Figure 7: Representation of the observations (6 samples per
individual) in the new PCA-derived feature space.
ual, 10 individuals) makes the identification problem
a complex task.
One way to deal with this problem and to elimi-
nate the redundancy among features is to use princi-
pal component analysis (PCA). This approach is used
to better handle and visualize the data by selecting
the 3 most discriminating axis in the feature space
and computing the 3 most relevant features (projec-
tion of the observations onto these axis). In summary,
3 features (components of the PCA) per observation
sample are used in the identification problem. Fig.7
shows the representation of the observations (each in-
dividual sample) in the new feature space, where the
3 components of the PCA represent the 3 dimensions
of the plot.
This new PCA-derived feature space can be pro-
jected onto a 2 dimensional feature space. Fig.8
shows that the 2D features are able to clearly discrimi-
nate between two classes of individuals: one class ad-
dressed to men and the other to women. Even though
no prior information is known about the clinical status
of the individuals subject to this test it is clearly sug-
gested that textural information might be correlated
with the different types and quantities of hormones
produced by men and women. This fact can lead to
thyroids presenting different acoustic impedances and
textures. This also explains the good discrimination
between male and female populations.
At this point, we can suggest that this system
might be useful as a soft biometric system for gender
identification.
BIOSIGNALS 2009 - International Conference on Bio-inspired Systems and Signal Processing
190
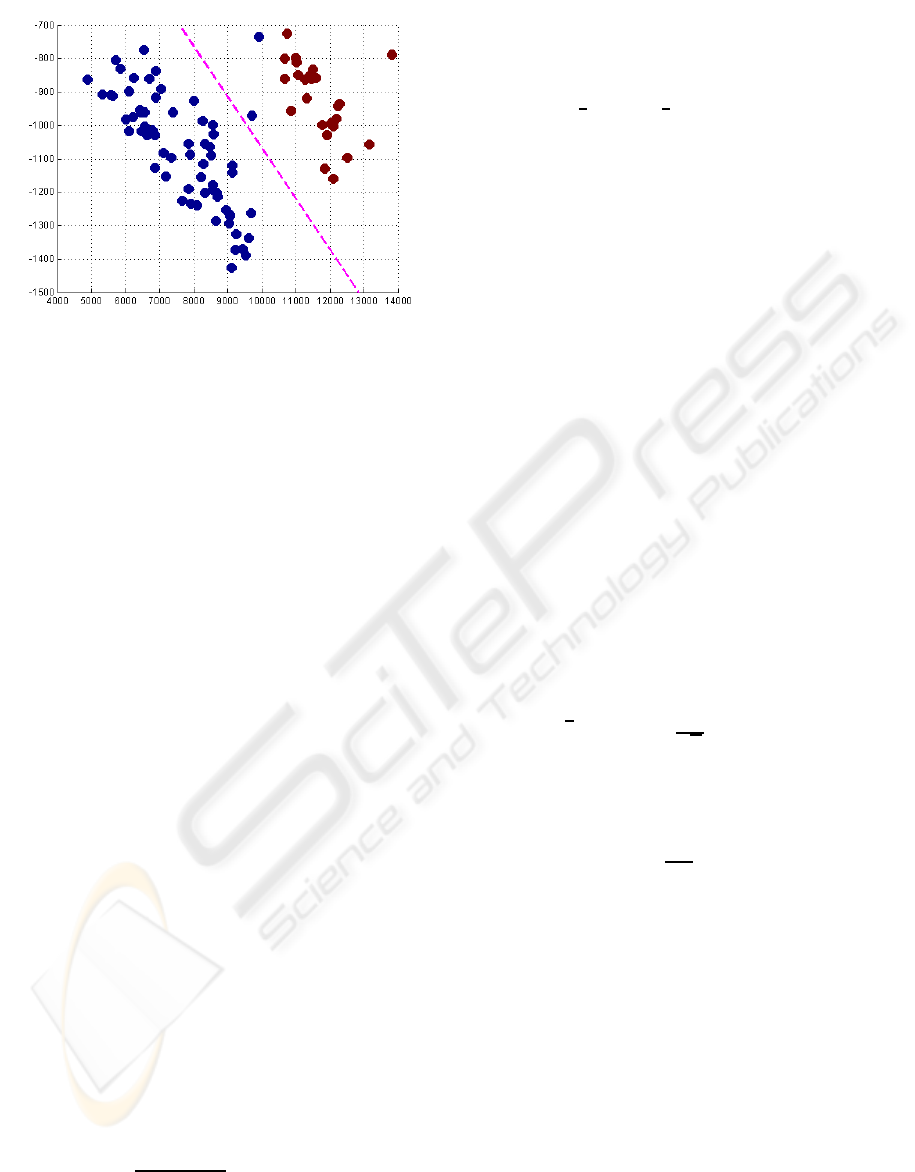
Figure 8: 2D feature space, showing a clear discrimination
of the observed samples into two classes (types of subjects).
4 CLASSIFICATION MODULE
In this paper, a closed set identification problem is
addressed, which means that N possible outputs are
generated for N possible models. The decision on
whether to classify an observation (individual fea-
tures) as being part of any of the available classes
(individual database) is based on a computed score
(MAP probability, distance measure, entropy). Three
types of classifiers were studied:
• K-Nearest neighbors classifier
The K-Nearest neighbors classifier is based on the
idea that an object is classified by a majority vote
of its neighbors, with the object being assigned
to the class most common amongst its k nearest
neighbors. This is a common nonlinear classifier
which results in a Voronoi tesselation of the fea-
ture space.
• MAP classifier
The Maximum a Posteriori classifier is based on
the MAP probability of a class ω given an obser-
vation X
ˆ
ω = argmax p(ω|X). (7)
In our work we assume that the observations can
be modeled by a multivariate gaussian distribution
given by
p(X,µ,Σ) =
1
2π
3/2
|Σ|
1/2
e
−1/2(X−µ)
′
Σ
−1
(X−µ)
. (8)
In this framework the discriminant function to be
maximized is given by
g
i
(X) = log p(X|ω
i
) + log p(ω
i
) (9)
g
i
(X) = −
1
2
log|Σ
i
|−
1
2
(X −µ
i
)
′
Σ
i
(X −µ
i
) + log p(ω
i
),
where µ
i
and σ
i
are maximum likelihood esti-
mates of the mean and covariance matrices of
the pdf of class i, based on the training data;
p(ω
i
) = 1/N, being N the number of individuals
in the database.
• Minimum entropy distance classifier
As it was described before, the underlying obser-
vation model for each sample is described by a
Rayleigh parameter (reflectivity). The approxi-
mated probability density function (PDFs) gener-
ated using this Rayleigh parameter can be com-
pared with the other PDFs in the database (see
Fig.9).
Conformity tests using the PDF for a given in-
dividual (testing distribution) and the remaining
PDFs from the database (training distributions)
were performed in order to assess which distribu-
tion better represents the observed one.
Considering the Kolmogorov-Smirnov confor-
mity statistical test, P
e
= 1−P
H
0
is the probabil-
ity of rejecting the null hypothesis, H
0
, which is
the hypothesis of the data have been generated by
any of the distributions from the database. Here,
P
H
0
= Q
KS
(λ), Q
KS
(λ) = 2
∑
∞
j=1
(−1)
j− 1
e
−2j
2
λ
2
,
λ = (
p
(N) + 0.12 +
0.11
√
N
)D, N is the number of
data points and D = max|c(n) − ch(n)|, where
c(n) and ch(n) are the cumulative probability
functions of the testing and training distributions.
The Kullback-Leibler entropy distance is given
by, d =
∑
n
p(n)log(
p(n)
h(n)
). Here, p(n) is the train-
ing distribution and h(n) is the histogram of the
observed (testing) sample.
5 RESULTS AND DISCUSSION
The performance of the classifiers was tested through
2 experiments and the result is summarized in Ta-
ble 1. In the first experiment, 60 samples from
one thyroid lobe were used as training data and 30
samples from the same lobe were used as testing
data. The second experiment uses training data from
one thyroid lobe (60 samples) and testing data from
the opposite lobe (30 samples). Regarding the k-
nearest neighbor and the MAP classifiers, tests were
performed considering (i) all the features available,
A BIOMETRIC IDENTIFICATION SYSTEM BASED ON THYROID TISSUE ECHO-MORPHOLOGY
191
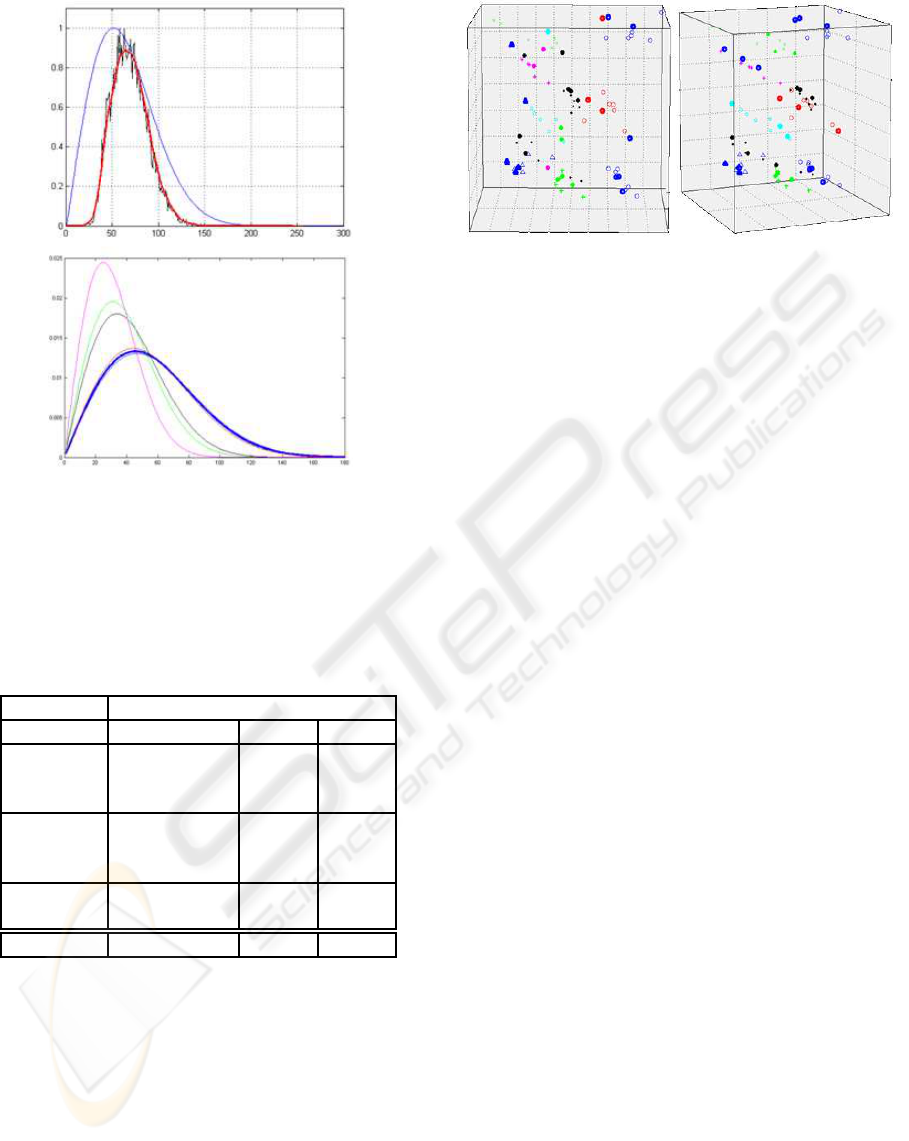
Figure 9: The histogram of an observed sample can be ap-
proximated by a Rayleigh distribution with an estimated pa-
rameter which accounts for the acoustic impedance of the
sample tissue. This distribution can be compared with the
others in the database and entropy distance measures can be
computed.
Table 1: Performance of the classifiers (k-nNeigh, MAP,
SmirKol, KullLeib) for two different data samples. Results
achieved with the leave-one-out method are also shown.
Identification Rate
Classifier Features Exp.1 Exp.2
k-nNeigh
All 0.5000 0.2667
PCA 0.5667 0.1667
Radon+Wav. 0.4333 0.1667
MAP
All 0.2000 0.2000
PCA 0.9000 0.7000
Radon+Wav. 0.7000 0.3667
SmirKol Rayl 0.7000 0.1667
kullLeib Rayl 0.7000 0.2000
Leave1out PCA 0.8778 0.9167
(ii) only the ones corresponding to the Radon trans-
form and wavelets, which account for texture in-
formation, and (iii) the PCA derived features. The
conformity tests (Kolmogorov-Smirnov, Kullback-
Leibler) consider only the Rayleigh parameter (acous-
tic impedance or reflectivity) as describing each sam-
ple.
The best performance is achieved with the MAP
classifier using the PCA derived features, with high
correct identification rates for both experiments (ID
rate for Exp.1 = 0.9000 and for Exp.2 = 0.7000).
The ID rates obtained with the textural features
Figure 10: Performance of the classifiers from the feature
space point of view. (Left) k-nearest neighbors classifier,
(Right) MAP classifier. For each feature space, the true
labels are plotted together with the classifier labels, repre-
sented in bold
(Radon+Wav.) and the MAP classifier were reason-
ably high, which allows to conclude that texture in-
formation is in fact relevant for tissue characteriza-
tion and differentiation. Textural features have al-
ready been shown to be relevant in a similar context
(SSST03a).
Fig.10 shows the comparison between the perfor-
mance of the classifiers from the feature space point
of view. It is clearly visible several misclassifications
obtained with the k-nearest neighbors classifier. It is
clear both from Fig.10 and Table 1 that the MAP clas-
sifier outperforms the k-nearest neighbors classifier.
A good performance is also achieved with the en-
tropy distance classifiers (KullLeib and SmiKol) for
the first data set (Exp.1). This suggests that the acous-
tic impedance of the thyroid tissue (which is the only
parameter used by these two classifiers) is indeed a
good parameter for discriminating between thyroids
and thus individuals. The poor performance of these
classifiers when using the second data set suggests
that the echo-morphology varies significantly from
one thyroid lobe to the other.
Another estimate of the accuracy of the classifier
uses the leave-one-out method. In this case, all but
one sample from each lobe (Exp.1) or from both lobes
(Exp.2) were used, thus using a larger training data
set. Here, the MAP classifier was used because it
was the one which achieved better results in the afore-
mentioned experiment. Again, considering Table 1 it
is observed a good performance of the classifier, in
which the classifier even outperforms for Exp.2. This
suggests that the number of samples in the database
significantly affects the performance of the classifiers.
BIOSIGNALS 2009 - International Conference on Bio-inspired Systems and Signal Processing
192

6 CONCLUSIONS
Computer derived features from 2D ultrasound im-
ages of the thyroid glands were used as part of a pro-
totype biometric system. These features are related
to the acoustic impedance, texture and morphology of
the thyroid tissue.
Good results were achieved with the MAP clas-
sifier, when using the three most discriminant fea-
tures, computed by PCA. Moreover, reasonably high
identification rates were also achieved with the en-
tropy distance classifiers, suggesting that the acoustic
impedance, or reflectivity, of the tissues is a relevant
feature to discriminate between individuals. Analy-
sis of thyroid echo-morphology should be further ex-
ploited because it appears to be very useful not only
as a (soft) biometric system but also as a diagnostic
tool.
Preliminary results, using only 9 parameters ex-
tracted from ultrasoundimages, are encouraging. Fur-
ther studies, involving larger data sets (more individ-
uals and more samples), as well as observations taken
from multiple sessions along distinct time instants,
are required to better establish the accuracy of this
new biometric modality.
REFERENCES
J. Abbot and F. Thurstone. Acoustic speckle: Theory and
experimental analysis. Ultrasound Imaging, 1:303–
324, 1979.
C. Burckhardt. Speckle in ultrasound b-mode scans. IEEE
Transations on Sonics and Ultrasonics, SU-25(1):1–
6, January 1978.
Stephen Boyd and Lieven Vandenberghe. Convex Optimiza-
tion. Cambridge University Press, 2004.
Y. Boykov, O. Veksler, and R. Zabih. Fast approximate en-
ergy minimization via graph cuts. IEEE Trans. Pattern
Anal. Mach. Intell., 23(11):1222–1239, 2001.
S. Catherine, L. Maria, A. Aristides, and V. Lambros. Quan-
titative image analysis in sonograms of the thyroid
gland. Nuclear Instruments and Methods in Physics
Research A, 569:606–609, December 2006.
J. Dias, T. Silva, and J. Leitão. Adaptive restoration
of speckled SAR images using a compound random
markov field. In Procedings IEEE International Con-
ference on Image Processing, Vol.II, pages 79–83,
Chicago, USA, October 1998. IEEE.
R. M. Haralick, Dinstein, and K. Shanmugam. Textural
features for image classification. IEEE Transactions
on Systems, Man, and Cybernetics, SMC-3:610–621,
November 1973.
V. Kolmogorov and R. Zabih. What energy functions can be
minimizedvia graph cuts? IEEE Trans. Pattern Anal.
Mach. Intell., 26(2):147–159, 2004.
Guy Mailloux, Michel Bertrand, Robert Stampfler, and
Serge Ethier. Computer analysis of echographic tex-
tures in hashimoto disease of the thyroid. Journal of
Clinical Ultrasound, 14(7):521–527, 1986.
O. V. Michailovich and A. Tannenbaum. Despeckling of
medical ultrasound images. IEEE Transactions on
Ultrasonics, Ferroelectrics and Frequency Control,
53(1):64–78, 2006.
Salil Prabhakar, Josef Kittler, Davide Maltoni, Lawrence
O’Gorman, and Tieniu Tan. Introduction to the special
issue on biometrics: Progress and directions. IEEE
Trans. Pattern Anal. Mach. Intell., 29(4):513–516,
2007.
M.A. Savelonas, D.K. Iakovidis, N. Dimitropoulos, and
D. Maroulis. Computational characterization of thy-
roid tissue in the radon domain. Computer-Based
Medical Systems, 2007. CBMS ’07. Twentieth IEEE
International Symposium on, pages 189–192, June
2007.
Daniel Smutek, Radim Sara, Petr Sucharda, and Ludvik
Tesar. Different types of image texture features in ul-
trasound of patients with lymphocytic thyroiditis. In
ISICT ’03: Proceedings of the 1st international sym-
posium on Information and communication technolo-
gies, pages 100–102. Trinity College Dublin, 2003.
Daniel Smutek, Radim Sara, Petr Sucharda, and Lud-
vik Tesar. Image texture analysis of sonograms in
chronic inflammations of thyroid gland. Ultrasound
in Medicine and Biology, 29:1531–1543(13), Novem-
ber 2003.
José Seabra, João Xavier, and João Sanches. Convex ultra-
sound image reconstruction with log-euclidean priors.
In In Proc. of the Engineering in Medicine and Biol-
ogy Conference, Vancouver, Canada, 2008.
Tortora Gerard J Tortora, Gerard J. (Gerard Joseph). Prin-
ciples of anatomy and physiology, 2000.
C. M. van Bemmel, L. Spreeuwers, M.A. Viergever, and
W.J. Niessen. Level-set based carotid artery seg-
mentation for stenosis grading. In MICCAI ’02:
Proceedings of the 5th International Conference on
Medical Image Computing and Computer-Assisted
Intervention-Part II, pages 36–43, London, UK, 2002.
Springer-Verlag.
C. Xu and J.L. Prince. Snakes, shapes, and gradient vector
flow. IEEE Transactions on Image Processing, 7(3),
March 1998.
A BIOMETRIC IDENTIFICATION SYSTEM BASED ON THYROID TISSUE ECHO-MORPHOLOGY
193
