
SIMULATION AS A DECISION SUPPORT TOOL
Estimating the Impacts of using RFID Technologies within Biobanks
Sylvain Housseman, Nabil Absi, St´ephane Dauz`ere-P´er`es
Ecole Nationale Sup´erieure des Mines de Saint-
´
Etienne, Centre Micro´electronique de Provence
Site Georges Charpak, 880 Route de Mimet, F-13541 Gardanne, France
Christian Chabannon
Institut Paoli-Calmettes, Centre de th´erapie cellulaire et g´enique, INSERM UMR 599, F-13273 Marseille Cedex 9, France
Paul Hofman
Facult´e de M´edecine, 28 Avenue de Valombrose, F-06107 Nice Cedex 02, France
Keywords:
Discrete event dynamic simulation, Decision support, RFID, Healthcare, Biobanks.
Abstract:
The costs and benefits of introducing auto-identification are difficult to evaluate. The Return On Investment
(ROI) may be calculated on manufacturing environments but in some service providing systems, like hospitals,
it may be very hard and inaccurate to judge the relevance of a new configuration only through financial con-
siderations. New information and communication technologies and devices appear rapidly. This study aims
at quantifying the benefits of introducing new devices at different levels in a complex socio-technical system:
a biobank (storage, transformation and exchanges of biological samples) using a discrete event dynamic sys-
tems simulation model as a quality measurement tool. After introducing the context, we will describe pertinent
measurement possibilities adapted to the Supply Chain for Health services, and particularly to biobanks, and
the way we implemented the simulation model used to get the results summarized in the last section, before
concluding. The originalities of this paper are the process modeling, designed to be easily modified to test
many different configurations and scenarios, and the quality indicators that are particularly adapted to health
services.
1 INTRODUCTION
New legislationsin France force drug pedigree, advis-
ing to replace bar-codes by data-matrix
1
containing
the use-by date and lot number. By doing so, coun-
terfeit packages are more difficult to produce, since
they will contain invalid data and thus can be detected
at any checking point (invalid association between lot
number and use-by date). The other main advantages
are that the use-by date may be checked easily and it is
then easier to identify and remove lots that are subject
to a sanitary alert. The Activity Based Costing (ABC)
principle will also be applied in French public hospi-
tals, and may start to be effective from January 2009.
At the same time, the United States are living their
1
Data-matrix is a two-dimensional bar-code arranged in
rectangular patterns.
third malpractice crisis (Dalton et al., 2008), physi-
cians struggle to acquire malpractice insurance when
the reasons of malpractices are more systemic than
individualistic. MISTRALS
2
is a consortium that aims
at showing the advantages of using Radio Frequency
IDentification (RFID) tags instead of (or in addition
to) data-matrix or bar-codes in order to assess new
traceability legislations, by preparing and deploying
RFID solutions in biobanks and chemotherapy treat-
ment services. One of the main points usually ad-
vanced for deploying RFID solutions at item-level is
anti-counterfeiting. This point is very important in
healthcare as wrong drug administration may have
2
Acronym for ”Mutualisation Informatique des
Syst`emes Technologiques pour la Recherche phArmaceu-
tique et La Sant´e”, which could be translated as ”Mutual IT
systems use for pharmaceutical research and healthcare”.
337
Housseman S., Absi N., Dauzère-Pérès S., Chabannon C. and Hofman P. (2009).
SIMULATION AS A DECISION SUPPORT TOOL - Estimating the Impacts of using RFID Technologies within Biobanks.
In Proceedings of the International Conference on Health Informatics, pages 337-343
DOI: 10.5220/0001557803370343
Copyright
c
SciTePress

dramatic consequences. Admittedly, the memory size
of an RFID tag allows notably a Unique IDentifica-
tion number (UID) to be set for every product, and not
only lot number, as with data-matrix. Counterfeiters
will have to invest in these technologies and find the
correct information to store in their products. But it is
not the unique advantage of deploying RFID.
Iatrogenic incidents occur in more than 10% of the
French hospitalisations (Michel et al., 2003); ten
years ago, these errors were responsible for as many
casualties as if a Boeing 747 crashed every 2 days
(Bonnabry, 2007). The “Swiss cheese model of sys-
tem accidents” (Reason, 2000) is a revealing picture
showing that serious medical errors are the result of
the accumulation of incidents and security deficien-
cies that may have occurred, like a handwritten mis-
reading, a wrong sample labelling, information trans-
fer, a forgotten checking or any other subprocess.
One fact is commonly admitted: humans make errors
(Kohn et al., 2000). These items define as a hot topic
the traceability of products and information in medi-
cal systems, the labelling of drugs and their packages,
and howthe hospital supply chains may be affectedby
using an identification technology or another. MIS-
TRALS suggests that RFID devices are currently the
best technology to answer these problems.
1.1 RFID Technologies
RFID is the generic acronym for Radio Frequency
IDentification, regrouping all the frequency bands :
from Low Frequency (125 kHz) to Super High Fre-
quencies (5.8 GHz). The used radio frequency im-
pacts the communication field and data transfer rate
possibilities. The large utilization of RFID allows
producers to lower tag prices and thus users to label
items at a lower additional cost. The deployment of
these technologies is eking out and the appearance of
standards and protocols increases the possibilities of
international exchanges and unique identification.
An RFID High Frequency (HF, 13.56 MHz) system
works as follows: An RFID antenna sends electro-
magnetic waves that are captured by the RFID tag’s
antenna. These waves allow to empower the tag’s
chip which will modify the signal, and so the mag-
netic waves through. The reader’s antenna decrypts
the modifications applied and thus can obtain infor-
mation imputed by the interrogated tag (Hedgepeth,
2007). The information are used for different pur-
poses: simple display, statistics recorded for planning
and scheduling, traceability, inventory management,
order verification, quality control, and may be applied
to many other domains as new applications appear at
a very high rate. The new generations of RFID tags,
readers and protocols allow to embed a large amount
of data (a few kilobytes), multiple reading and writ-
ing, to plug sensors and even allow objects to com-
municate with each other.
The benefits of deploying a set of hardware (spe-
cific RFID readers and tags, sensors, ...) depend on
the type and quality of the devices, the level of tag-
ging, the use of the information read and the work-
flow modifications applied accordingly. This paper
presents an approach and a tool designed for deci-
sion makers in healthcare. The tool could ideally re-
place or enhance numerous expensive pilot projects,
by making decision makers model by themselves the
structure they are responsible for and try to simulate
different device sets and functioning scenarios.
1.2 Biobanks
Biobanks can be described as the storage, convert-
ing and handover of mainly human fast perishing,
and potentially infectious samples. These samples are
used for diagnosing, and for experiments associated
to clinical and pharmaceutical research programs. Ev-
ery sample has therefore to be associated to the in-
formation of the human it has been taken from, e.g.
its phenotypic information or even the identification
number of an hospitalised patient. We estimate that
the activity of biobanks may increase in the next few
years, because the number of cancer diseases is in-
creasing as the French population is getting older, and
some recent technologies and habits may be trigger-
ing factors. The number of handover requests may
also increase because of new techniques like toxi-
cogenomics, the using of progenitor cells and cord-
blood, and also the availability of on-line sample cat-
alogs.
A generic description of the steps sustained by a bio-
logical sample (blood, marrow or organ part), from
the sampling to the shipment for final users, has
been made in collaboration between the two biobanks
in MISTRALS: the Institute Paoli-Calmettes (IPC)
in Marseille, and the CHU-CAL common biobank
(CHU-N) in Nice. Six main steps were identified dur-
ing a sample’s life (Figure 1). The main processes that
a biological sample undergoes are described in details
in (Housseman et al., 2008a), where they are associ-
ated with improvements made possible thanks to dif-
ferent smart tags. Many technologies may improve
those processes, from a qualitative (error avoidance)
or a quantitative (automated processes mean less re-
sources or more samples with the same resources)
point of view.
Various scenarios are possible for each hardware set,
and a large number of materials exist and appear at a
HEALTHINF 2009 - International Conference on Health Informatics
338
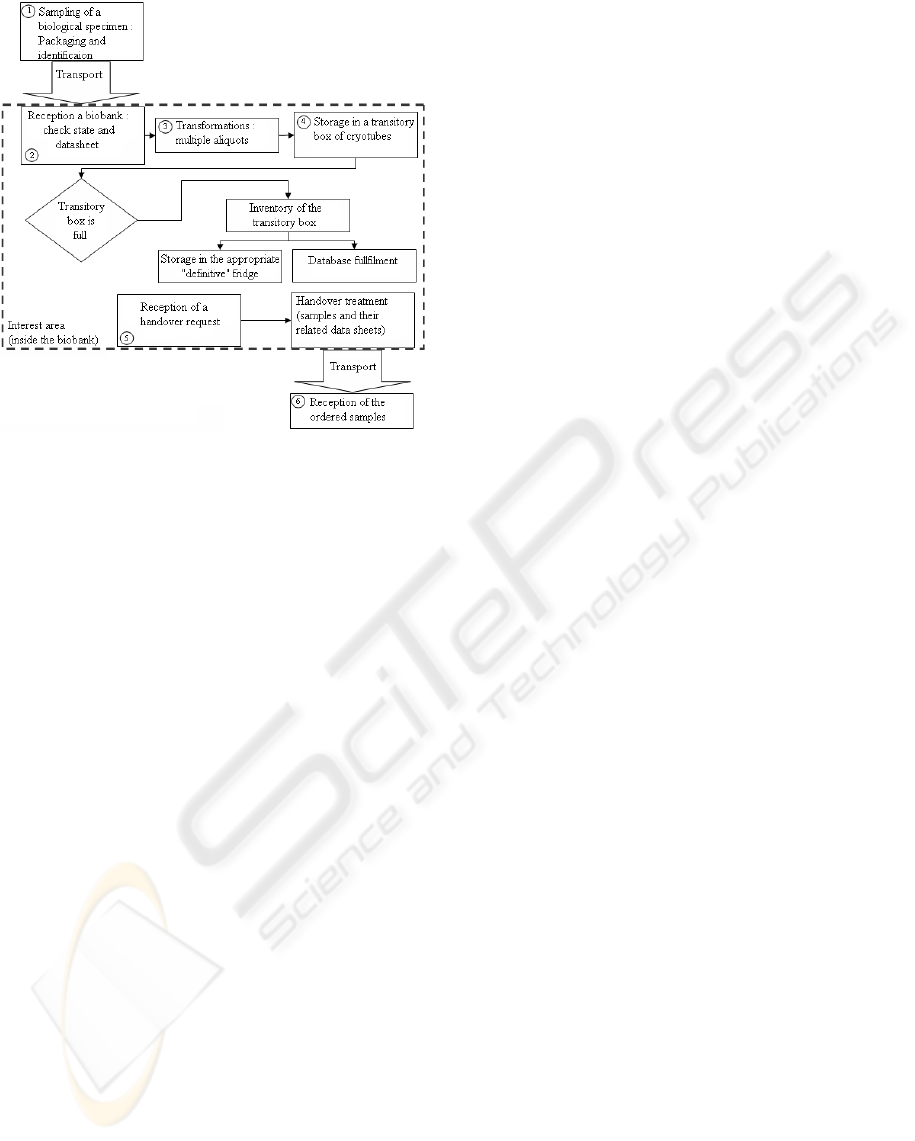
Figure 1: Biobanks macro-process chart.
high rate. It is impossible to try out all these scenar-
ios through pilot projects, and it would be very expen-
sive, potentially risky and hardly extensible (Royston,
1999). This is why we work on a decision support tool
based on discrete event simulation. The next section
describes quality indicators adapted to biobanks and
the specificities of the model we implemented.
As a first application, we will test out different ma-
terial scenarios in biobanks, including the integration
of RFID tags to cryotubes and related improvements.
The tool proposed to do so is based on Discrete Event
Simulation for testing and ’marking’ the scenarios.
This choice follows from the fact that the studied sys-
tem is a complex socio-technical system where errors
may occur. The originality of this work lies in the
modelling of a system that is positioned between in-
ventory management and health delivery and the im-
plementation of different materials and organizational
scenarios including the so called ’smart tools’ that
radio-communicating devices are.
2 SIMULATION AS A DECISION
SUPPORT TOOL
The tool we are presenting aims at allowing decision
makers of healthcare supply chains to model the in-
stitute they are responsible for, and to try out many
different hardware and organizational configurations
according to appropriate indicators. Simulation is
used to estimate the resulting performances. (Kleij-
nen, 2005) distinguishes four kinds of simulation that
could be used for supply chain management and op-
timisation: spreadsheet simulation, system dynamics,
discrete event dynamic systems (DEDS) and business
(or management) games. The choice of using DEDS
simulation to estimate the performancesof the studied
systems was headed by the fact that human modelling
must be precise to consider some Performance Shap-
ing Factors (PSF) and errors (Park and Lee, 2007),
since most of the processes in healthcare are human,
or include human compounds.
Errors result in the accumulation of incidents and
missed verifications within modern health structures
(Reason, 2000). This complex situation is an argu-
ment that led us to choose simulation to ’mark’ the
large number of scenarios we wish to compare to each
other. One of the main difficulties in elaborating a
simulation model is acquiring the related data; (Bo-
ginski et al., 2007) shows that RFID actually can be
a good tool for doing so. Our work is cooperatively
achieved with the IPC and the CHU-N; although the
data are not direct outputs from their biobanks, they
are validated as realistic by health professionals.
We chose to use the simulation software ARENA, de-
scribed by (Law and Kelton, 2000) as a general pur-
pose simulation software, because it allows the cre-
ation of customized modules and templates, and user
friendly front ends. It can easily be connected with
other softwares (Seppanen, 2000), which is useful to
implement custom performance indicators.
2.1 Performance Indicators
Evaluating the performance of a health service is a
difficult topic (Minvielle et al., 2007). The main mea-
sures to consider when estimating the performances
of an healthcare system are:
• Safety evaluation of patients and employees, in-
cluding a hardware reliability part.
• Satisfaction of patients.
• Return on investment (ROI), related to financial
considerations.
• Reluctance and/or understanding of employees.
The indicators we consider to be adapted to biobanks
will now be detailed.
Variation on the Number of Errors that can Po-
tentially Occur. To evaluate this variation, the model
manages two databases having the same structure;
the first one represents what actually happened (IRL),
and the second one (IIS) contains the data of the
information system (e.g. a set of paper sheets). By
doing so, it is possible to see a virtual technician
making an error, e.g. miswriting the place he stored
SIMULATION AS A DECISION SUPPORT TOOL - Estimating the Impacts of using RFID Technologies within Biobanks
339

an object. Then another technician will waste time
trying to find this tube because he noticed the one
he first took was not the good one, or will make a
diagnosis error because he did not notice it. He might
also be able to repair the IIS errors accordingly to the
IRL database.
We can modulate the error probabilities of individuals
by modifying their associated ”education level”, that
is a multiplier of the error probabilities we assigned
to every task, in order to perform sensitivity analysis.
The IRL database also contains all the temperature
modifications that the samples and cryotubes suffer
in order to be able to estimate if their states have been
impacted. Unfortunately, we do not have data on how
fast samples get damaged.
Improvements on the Processing Times. There
are three processing times that have been aggregated
into one: sample arrival to sample storage, sample
arrival to update of information system and handover
request reception to samples delivery. This indicator
can be considered as part of the client and patient
satisfaction. For experiments, long processing times
may lead to the use of a damaged sample. Moreover,
short processing times will help to complete a
diagnosis before a pathology worsens.
Acceptance by Employees of Changes in their
Work. We believe that the more employees use their
core competences, the more they feel useful and
fulfilled. In other contexts than biobanks, this could
help to improve the satisfaction of customers since
health professionals such as nurses and physicians
could spend more time with the patients.
Costs and Return on Investment. This is the main
performance indicator when considering industrial in-
vestments. The previous indicators could possibly be
reduced to their financial impacts, even if we consider
that it is quite inaccurate to calculate a cost related to
the death or infection of a human. We refer the reader
to (Howard et al., 2005).
2.2 Model Implementation
The model we implemented has been designed so it
can be easily, or automatically, modified to run multi-
ple scenarios including the introduction of commu-
nicating devices. This is why the modifications of
information transfers are important. Our goal is to
compare device configurations. This is why we use a
spreadsheet file format, in which modified variables
impacting process times and error probabilities de-
fine the ”device part” of the scenarios. This file also
contains travel times and workload information, in-
cluding the transformation requests. Every process
has been described using a set of three subprocesses:
the ”Medical act”, the ”Information asset”, and the
”Verification subprocess”. The functions and uses of
these subprocesses are more precisely described in
(Housseman et al., 2008b).
Human resources are modelled as simply as possible,
knowing the states ’Available’, ’Busy’ and ’Unreach-
able’. We implemented a basic PSF that is the visible
queue length; we considered that an amount of 5 vis-
ible awaiting jobs improves the error rate of 7% of its
basic value. Other dysfunctions than human failures
should be added, such as a network crash, or electro-
magnetic interferences between the RFID readers and
the machines, that can make some material configura-
tions impossible or dangerous (Togt et al., 2008).
The following section describes the studied scenarios,
and presents computational results using the model
and indicators listed in the previous section.
3 CASE STUDY
The model described in Figure 1 has been imple-
mented, from Step (2) to Step (5). Step (1) and (6)
are not precisely modeled. We assume that there is no
patient misidentification in the first step, and that the
data sheets are sent with the samples.
The following scenarios have been tested:
• ”Current scenario” (Curr.Scenar), where paper
sheets are associated to samples.
• ”RNA Automation” (RNA Auto.), where we
added a RNA extraction machine, since it is cur-
rently happening at the IPC. This machine will
be installed in the room where the other trans-
formations happen, while the manual extraction
was taking place in another room at another floor,
and so the transportation included a time to wear
the mobcap, white coat and shoe covers, and wash
hands.
• ”Smart cryotubes and pen-size antenna”(RFID
& penRder), where the data sheet is accessible
from the RFID label, and the information is writ-
ten in the database without the need of a manual
copy of the information in the Information Sys-
tem. The pen-size antenna allows for the inven-
tory of boxes by pointing all the cryotubes, one
after the other. We estimated that the average time
needed is reduced from 24 to 8 minutes, and uses
only one human resource instead of two.
• ”Matrix reader’s antenna” (RFID & 2DRdr),
which consists of adding a particular antenna, that
HEALTHINF 2009 - International Conference on Health Informatics
340

allows for the inventory of a whole box of cry-
otubes recognizing their position automatically.
The time needed for inventorying a box using this
device is set to 2 minutes.
The time between arrivals are exponentially dis-
tributed. The opening hours include a rush time, i.e.
a time period during which the arrivals mean are 1.6
times larger than during the rest of the day. These val-
ues are set so the overall mean is the total number of
incoming samples divided by the number of hours the
IPC is opened yearly. The ”Transformation” proto-
cols implemented are the DNA and RNA extractions,
white-cells (that are a part of the previousones), blood
serum, plasma, and viable cells. Some of these proto-
cols are different whether the arriving sample is blood
or marrow.
The processing times of the transformation have been
implemented using the data at IPC. In order to esti-
mate the different error rates, we inventoried a few
boxes randomly chosen within the stock. The results
of this study are still subject to confidentiality and rel-
evancy studies, so our simulations use estimated val-
ues.
The basic probability of making an error computer-
izing a data file by hand is set to 1.1%. This rate
corresponds to the 11% of the probability of retran-
scription error, which is fixed to 10%, as reported by
(Marcellis-Warin, 2003). This error probability is re-
duced to 0.01% when tubes are tagged.
The probability that an error occurs during the in-
ventorying of a full box of cryotubes is set to 3%
when it is done by hand, which is an estimated value
fixed after discussing the results of (Garnerin et al.,
2007). This value has been set to 0.1% if the employ-
ees have an RFID pen size antenna to perform the in-
ventory. These assumed probabilities are divided by
the employees “education level”, that reduces the im-
portance of having very acute values. This “education
level” is the same for all the employees during a repli-
cation of the simulation. The values of the “education
level” are 0.5, 1, and 2.
3.1 Results
The scenarios described above have been tested
through 1.5 month of work. Twenty replications of
the four material scenarios were ran for each of the
three “education levels” of employees. The results
shown in Table 1 summarize the observed percent-
ages of the inventory errors (”Inv. error”) and com-
puterization errors (”Comp. error”). The number in
parenthesis corresponds to the “education level”. Ta-
ble 2 shows indicators that are, within this simula-
tion, not impacted by the “education level” of the hu-
Table 1: Average results after 20 replications of each
scenario and education level.
Scenario Name Inv. Comp.
(Ed.Level) error error
Curr.Scenar(2) 1.350% 0.546%
Curr.Scenar(1) 2.600% 0.960%
Curr.Scenar(0.5) 5.935% 2.260%
RNA Auto.(2) 1.663% 0.510%
RNA Auto.(1) 2.866% 1.202%
RNA Auto.(0.5) 5.049% 2.250%
RFID & penRder(2) 0.000% 0.004%
RFID & penRder(1) 0.000% 0.008%
RFID & penRder(0.5) 0.000% 0.028%
RFID & 2DRdr (2) 0.000% 0.013%
RFID & 2DRdr (1) 0.000% 0.016%
RFID & 2DRdr (0.5) 0.000% 0.028%
Table 2: Average proportional time and gains on hu-
man resource after 20 replications of each scenario.
Scenario Name Human Troughput
utilization time
Curr.Scenar 0.000% 0.000%
RNA Auto. 10.560% 2.788%
RFID & penRder 36.400% 16.574%
RFID & 2DRdr 38.050% 16.648%
man resources. The results correspond to the propor-
tional value gained compared with the first scenario
(Curr.Scenar). These indicators are:
• the percentage of time gained between the arriv-
ing of a new sample and the time when it’s infor-
mation has been computerized (Throughput time).
The throughput time is an interdisciplinary per-
formance indicator, which in our case study could
make a patient obtaining his analysis results faster
and its potential illness be taken care earlier.
• the proportion of human resources gained (Hu-
man utilization).
The initial value, corresponding to Curr.Scenar, for
the proportion of seized human resource utilization is
50.46%, which seems right considering that the em-
ployees also spend some of their free time working
for a different service and that the amount of work
to do depends on the arrivals, that are not constant.
The worst scenario corresponds to Curr.Scenar; the
results in Table 2 are the percentage of improvement
compared with this scenario.
The average number of arriving samples is about
800; and the average number of information sheets
computerized is 1208, including an average value of
33.2 full boxes (and so box inventories). Table 1
SIMULATION AS A DECISION SUPPORT TOOL - Estimating the Impacts of using RFID Technologies within Biobanks
341

shows that the “education level” has a high impact
on the number of errors for the scenarios Curr.Scenar
and RNA Auto.. RFID technologies removemany crit-
ical processes like handwriting and manual computer-
izations, so the “education level” has less impact for
the two scenarios including auto-ID.
Table 2 shows that the proportion of used re-
sources is reduced by 10.56% when adding the RNA
automation within the biobank, because the RNA ex-
traction needs less human intervention and the time
needed to transport the samples to the place where
this transformation takes place is highly reduced as
soon as the automation is in the same clean area. The
gains related to RFID technologies are very large. The
saved time is mainly composed of computerization,
handwriting and bringing information leafs. The job
of the technicians would consist of tasks that are more
specific to their core competences. As mentioned in
Section 3.1, we believe this is an indicator of the em-
ployee welfare. The difference between the use of a
pen reader or a matrix antenna is small. Thus, using
the matrix antenna would at first require to compare
the earnings with the cost of such a device. On the
other hand, the use of a 2D position reading antenna
could help to reorganize boxes when performing in-
ventories, thus leading to potential large savings.
Our results do not include a financial part yet for
two reasons. First, the costs of emerging technolo-
gies decrease quickly with the increase of their use.
Second, the market for tagged cryotubes and matrix
readers is not very large, so the prices are not stabi-
lized yet.
4 CONCLUSIONS
In this paper, we address the impact of RFID tech-
nologies in a specific healthcare application using
Discrete Event Dynamic Systems (DEDS) simulation
used as a decision support system. Our study helps to
quantify the benefits of integrating new auto-ID tech-
nologies and devices at different levels of a biobank.
The results show that auto-ID technologies may con-
siderably improve the performances of the biobank
when taking into account the percentages of errors as
well as the reduction of resource uses and processing
times as performance indicators. We still have data to
analyze in order to configure the simulation and vali-
date the relevance of some of our assumptions. This
part of our work should be possible only after the pi-
lot results have been observed for a long enough time
period so they are stabilized.
The proposed model should allow us to model
other biobanks and/or material configurations quite
quickly, including organ sample arrivals. This can
be made using the same basic model file and only
modifying the specific configuration file. A graphi-
cal user interface could allow biobanks managers to
model themselves their biobank. These types of tools
could be very helpful when auditing and expertizing
structures that must adopt new technologies because
of new legislations.
REFERENCES
Boginski, V., Mun, I., Y. Wu, K. M., and Zhang, C. (2007).
Simulation and analysis of hospital operations and
ressource utilization using RFID data. In IEEE In-
ternational Conference on RFID, Grapevine, Texas,
USA, pages 199–204.
Bonnabry, P. (2007). How can the labelling and the packag-
ing of drugs impact on the drug safety? In Swissmedic,
Bern, Suisse.
Dalton, G. D., Samaropoulos, X. F., and Dalton, A. C.
(2008). Improvements in the safety of patient care can
help end the medical malpractice crisis in the united
states. In Health Policy, volume 86, pages 153–162.
Garnerin, P., Pellet-Meier, B., Chopard, P., Pergener, T.,
and Bonnabry, P. (2007). Measuring human-error
probabilities in drug preparation : a pilot study. In
European Journal of Clinical Pharmacology, volume
63(8), pages 769–776.
Hedgepeth, W. O. (2007). RFID Metrics. CRC Press.
Housseman, S., Absi, N., and Dauz`ere-P´er`es, S. (2008a).
Simulating RFID applications in healthcare. Techni-
cal report, EMSE-CMP.
Housseman, S., Absi, N., Dauz`ere-P´er`es, S., Daufresne, L.-
M., and Hofman, P. (2008b). Utilisation des NTIC
dans la gestion d’un stock d’´echantillons biologiques:
la simulation pour aider `a la d´ecision. In GISEH’08:
Gestion et Ing´enierie des Syst`emEs Hospitaliers, Lau-
sanne, Switzerland, pages 167–174.
Howard, D. H., Meltzer, D., Kollman, C., Maiers,
M., Logan, B., Gragert, L., Setterholm, M.,
and Horowitz, M. M. (2005). Optimal Size
of a National Cord Blood Bank. http://www.
sph.emory.edu/ dhhowar/cordblood 05162005.pdf.
Kleijnen, J. (2005). Supply chain simulation tools and tech-
niques: a survey. In International Journal of Simula-
tion and Process Modeling, volume 1(1/2), pages 82–
89.
Kohn, L., Corrigen, J., and Donaldson, M. (2000). To err
is human. building a safer health system. In The Na-
tional Academies Press, Washington DC, USA.
Law, A. and Kelton, W. (2000). Simulation Modeling and
Analysis. Mc Graw Series in Industrial Engineering
and Management Science.
Marcellis-Warin, N. D. (2003). Les risques hospitaliers. In
La lettre des cyndiniques, number 40.
HEALTHINF 2009 - International Conference on Health Informatics
342

Michel, P., Quenon, J., de Sarasqueta, A., and Scemama,
O. (2003). L’estimation du risque iatrog`ene grave
dans les tablissements de sant´e en france. In DREES,
Etudes et Resultats, number 219, pages 1–8.
Minvielle, E., Sicotte, C., Champagne, F., Contandripou-
los, A.-P., Jeantet, M., Pr´eaubert, N., Bourdil, A., and
Richard, C. (2007). Hospital performance: Compet-
ing or shared values? In Health Policy, volume 87,
Issue 1, pages 8–19.
Park, K. and Lee, J. (2007). A new method for estimat-
ing human error probabilities: Ahpslim. In Reliabil-
ity Engineering & System Safety, volume 93(4), pages
578–587.
Reason, J. (2000). Human errors: Models and management.
In British Medical journal, volume 320, pages 768–
770.
Royston, G. (1999). Trials versus modelling in appraising
screening programmes. In British Medical journal,
volume 318, pages 360–361.
Seppanen, M. (2000). Developing industrial strength simu-
lations models using visual basic for applications. In
Proceedings of the 32nd Conference on Winter simu-
lation, Orlando, Florida, USA, pages 77–82.
Togt, R. V. D., van Lieshout, E., Hensbroek, R., Beinat,
E., Binnekade, J., and Bakker, P. (2008). Electromag-
netic interferences from radio frequency identification
including hazardous incidents in critical care medical
equipment. In Journal of American Medical Associa-
tion, volume 299(24), pages 2884–2890.
SIMULATION AS A DECISION SUPPORT TOOL - Estimating the Impacts of using RFID Technologies within Biobanks
343
