A
CCELERATION OF THE EXPECTATION-MAXIMIZATION
ALGORITHM FOR A TWOFOLD GAUSSIAN MIXTURE MODEL
BY USING THE HISTOGRAM OF THE OBSERVATIONS
INSTEAD OF THE OBSERVATIONS
Evaluation of its Accuracy by Generated Histograms
J. Bruijns
Philips Research, High Tech Campus 36, 5656 AE, Eindhoven, The Netherlands
Keywords:
Computer-assisted image analysis, Computer-assisted image interpretation, Statistical data interpretation.
Abstract:
Volume representations of blood vessels acquired by 3D rotational angiography are very suitable for diagnos-
ing a stenosis or an aneurysm. For optimal treatment, physicians need to know the shape of the diseased vessel
parts. Binary segmentation by thresholding is the first step in our shape extraction procedure. Assuming a
twofold Gaussian mixture model, the model parameters (and thus the threshold for binary segmentation) can
be extracted from the observations (i.e. the gray values) by the Expectation-Maximization (EM) algorithm.
Since the EM algorithm requires a number of iterations through the observations, and because of the large
number of observations, the EM algorithm is very time-consuming. Therefore, we developed a method to
apply the EM algorithm to the histogram of the observations, requiring a single pass through the observations
and a number of iterations through the much smaller histogram. This variant gives almost the same results as
the original EM algorithm, at least for our clinical volumes. We have used this variant for an evaluation of the
accuracy of the EM algorithm: the maximum relative error in the mixing coefficients was less than 7%, the
maximum relative error in the parameters of the two Gaussian components was less than 2.5%.
1 INTRODUCTION
Volume representations of blood vessels acquired by
3D rotational angiography after injection with a con-
trast agent (Kemkers et al., 1998; Moret et al., 1998)
have a clear distinction in gray values between tis-
sue and vessel voxels. Therefore, these volume rep-
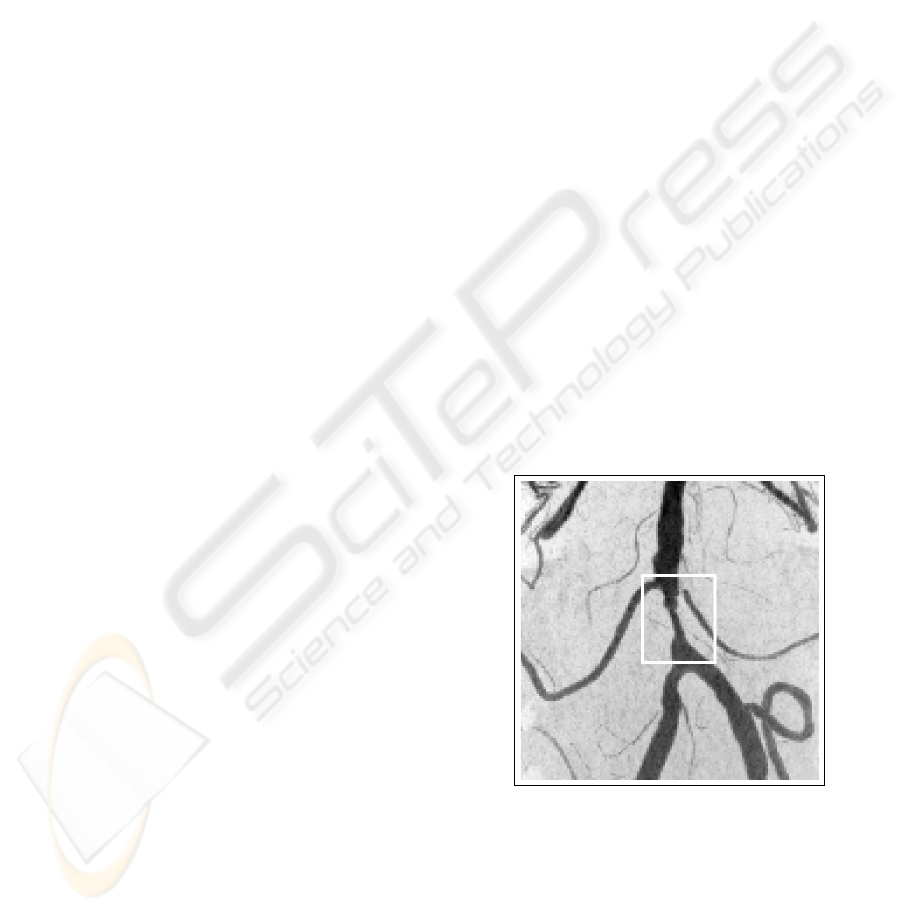
resentations are very suitable for diagnosing a steno-
sis, a local narrowing of a vessel caused for example
by cholesterol (see Figure 1), or an aneurysm, a lo-
cal widening of a vessel caused by a weak vessel wall
(see Figure 2).
For optimal treatment of a stenosis or an
aneurysm, physicians need to know the shape param-
eters (e.g. vessel diameter, aneurysm volume) in the
neighborhood of the diseased vessel parts. The start-
ing point for many shape extraction methods is a seg-
mented volume. Such a segmented volume can be
created by thresholding. Voxels with a gray value be-
low the threshold are classified as tissue voxels. Vox-
els with a gray value above the threshold are classified
as vessel voxels.
To eliminate inter- and intra-operator variations
this threshold should be extracted automatically from
Figure
1: A stenosis inside the white rectangle.
the data. A commonly used starting point for auto-
matic threshold extraction is a twofold Gaussian mix-
ture model (Kittler and Illingworth, 1986; Gan et al.,
2004a; Gan et al., 2004b; Gan et al., 2005). After the
parameters of this model are extracted from the ob-
servations (i.e. the gray values) by the Expectation-
Maximization algorithm (Bilmes, 1997; Dempster
et al., 1977), the optimal threshold is given by the in-
229
Bruijns J. (2009).
ACCELERATION OF THE EXPECTATION-MAXIMIZATION ALGORITHM FOR A TWOFOLD GAUSSIAN MIXTURE MODEL BY USING THE
HISTOGRAM OF THE OBSERVATIONS INSTEAD OF THE OBSERVATIONS - Evaluation of its Accuracy by Generated Histograms.
In Proceedings of the Fourth International Conference on Computer Vision Theory and Applications, pages 229-236
DOI: 10.5220/0001652902290236
Copyright
c
SciTePress
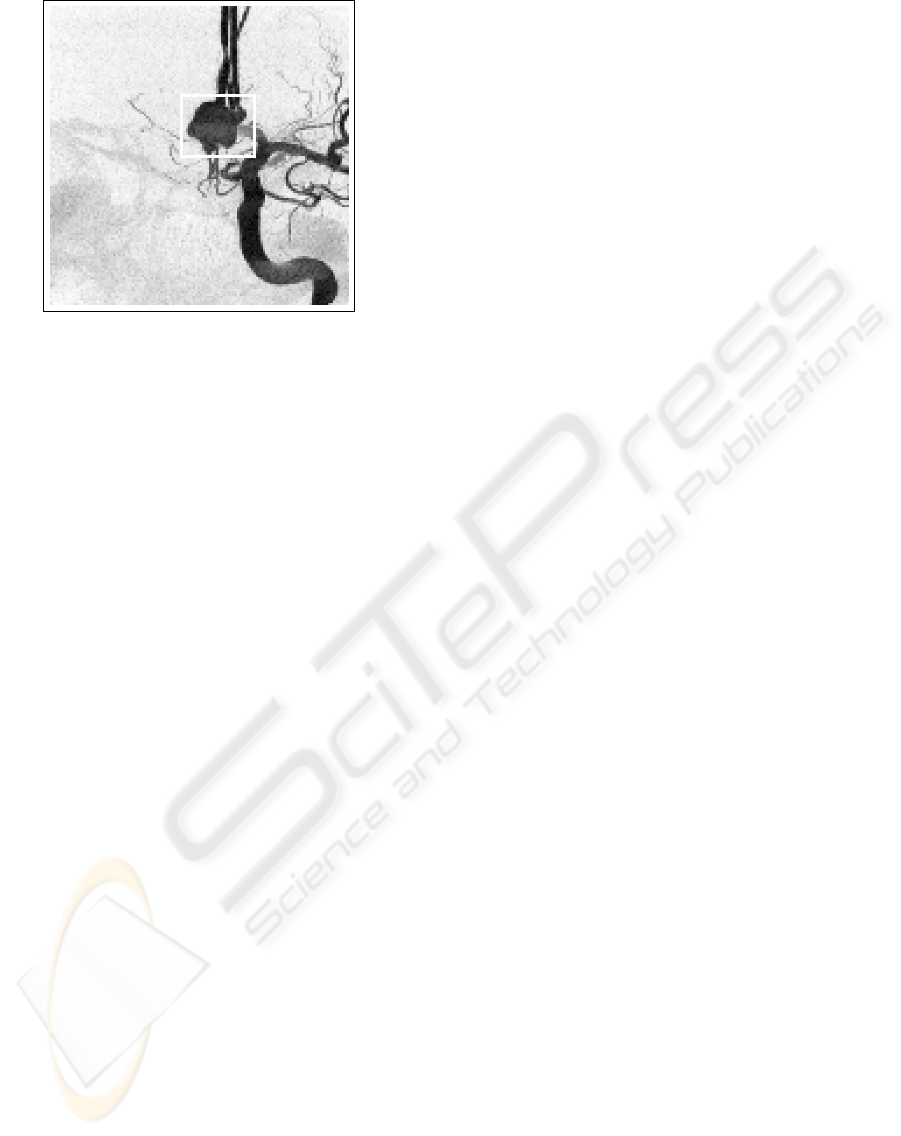
Figure 2: An aneurysm inside the white rectangle.
tersection point of the two Gaussian components.
Since the Expectation-Maximization (EM) algo-
rithm requires a number of iterations through the ob-
servations, and because of the large number of obser-
vations (e.g. 512x512 pixels or 512x512x512 voxels),
the EM algorithm is very time-consuming. To ac-
celerate the extraction of the parameters of a twofold
Gaussian mixture model by the EM algorithm, we de-
veloped a method to apply the EM algorithm to the
histogram of the observations, requiring a single pass
through the observations and a number of iterations
through the much smaller histogram. The original
EM algorithm is described in Section 3.1, our his-
togram variant in Section 3.2. Our histogram vari-
ant gives almost the same results as the original EM
algorithm, at least for our clinical volumes (reported
in Section 3.3). We have used our histogram variant
for an evaluation of the accuracy of the EM algorithm
(given further detail in Section 4).
2 RELATED WORK
Otsu (Otsu, 1979) proposed a method for the selection
of a threshold for segmentation of a gray-value image
in two classes based on the between-class variance.
Given a gray-level histogram the threshold is chosen
so that the between-class variance is maximized.
Kittler et al. (Kittler and Illingworth, 1986) pre-
sented a method for the selection of a threshold for
segmentation of a gray value image in two classes
based on the assumption that the gray values of the
two classes have a Gaussian distribution. Given a
gray-level histogram the threshold is chosen so that
the Bayesian classification rule is minimized.
Wilson et al. (Wilson and Noble, 1999) pre-
sented a method for adaptive statistical segmenta-
tion of the vessel voxels in time-of-flight MRA data.
First, they estimate the parameters of a convex model
of three probability distributions (Gaussian for tis-
sue and uniform for blood flow) by the Expectation-
Maximization (EM) algorithm. Next, the resulting
distributions are used to classify the vessel voxels.
This process is applied to a hierarchical subdivision
so that local thresholds are used for the classification
step.
Liao et al. (Liao et al., 2001) introduced a
method for multilevel thresholding. They modified
the method of Otsu (Otsu, 1979), so that the thresh-
olds can be computed much faster. First, they develop
a criterion for maximizing a modified between-class
variance. Next, a recursive algorithm is designed
based on this modified between-class variance which
gives the same thresholds as the method of Otsu. Fi-
nally, a look-up table is used for efficient computa-
tion.
Frederix et al. (Frederix and pauwels, 2004; Fred-
erix, 2005) proposed a method for estimating the
Gaussian mixture model with a variable number of
Gaussian probability density functions. The number
of Gaussian components is increased until the distri-
bution of the Gaussian mixture model is compatible
with the empirical data distribution.
Gan et al. (Gan et al., 2004a; Gan et al., 2004b;
Gan et al., 2005) introduced a method for vascular
segmentation of 3D rotational angiography volumes
based on MIP (Maximum Intensity Projections) im-
ages. Applying the Expectation-Maximization (EM)
algorithm for a twofold Gaussian mixture model, they
estimate a threshold from a MIP image because the
standard deviation of the individual classes in a MIP
image is smaller. This threshold is used to classify the
voxels belonging to this MIP image (i.e. the voxels
with the maximum gray value in the projection direc-
tion). After the resulting vessel voxels are labelled in
a corresponding binary volume, their gray values in
the original volume is set to zero, and the procedure
is repeated until over fitting of the non-vessel class
is detected. This iterative algorithm is applied in the
three axis directions and the resulting segmentations
are combined by minimizing an energy functional for
a spatially smooth result.
3 THE EM ALGORITHM FOR A
TWOFOLD GAUSSIAN
MIXTURE MODEL
A twofold Gaussian mixture model is given by the
following convex combination:
VISAPP 2009 - International Conference on Computer Vision Theory and Applications
230

f (x) =
2
∑
k=1
π
k
G(x;µ
k
,σ
k
) (1)
with 0 ≤ π
k
≤ 1, π
1
+ π
2
= 1 and G(x;µ
k
,σ
k
) the
Gaussian probability density function.
The mean and variance of this twofold Gaussian
mixture model are also convex combinations of the
means and variances of the two Gaussian compo-
nents:
µ =
2
∑
k=1
π
k
∗ µ
k
σ
2
+ µ
2
=
2
∑
k=1
π
k
∗ (σ
2
k
+ µ
2
k
)
(2)
3.1 The EM Algorithm using the
Observations
Given a set of observations {x
i
,i ∈ [1,N]} the param-
eters of a twofold Gaussian mixture model can be es-
timated by the EM algorithm (Bilmes, 1997). This
is an iterative algorithm consisting of an Expectation
step followed by a Maximization step. In the Expecta-
tion step the membership functions {P
k,i
,k ∈ [1,2],i ∈
[1,N]} are computed:
P
k,i
=
π
k
G(x
i
;µ
k
,σ
k
)
∑
2
k=1
π
k
G(x
i
;µ
k
,σ
k
)
(3)
From this equation the following properties of the
membership functions can be derived:
0 ≤ P
k,i
≤ 1
2
∑
k=1
P
k,i
= 1
(4)
These membership functions are used to compute
new values for the parameters in the Maximization
step (similar as for a discrete probability distribution):
π
k
=
∑
N
i=1
P
k,i
N
µ
k
=
∑
N
i=1
P
k,i
x
i
∑
N
i=1
P
k,i
=
∑
N
i=1
P
k,i
x
i
N ∗ π
k
σ
2
k
+ µ
2
k
=
∑
N
i=1
P
k,i
x
2
i
∑
N
i=1
P
k,i
=
∑
N
i=1
P
k,i
x
2
i
N ∗ π
k
(5)
The new values for the parameters are used to
compute new values for the membership functions in
the following Expectation step and so on. The algo-
rithm stops when the change in the membership func-
tions is very small.
Multiplying the formulae for µ
k
and σ
2
k
in Equa-
tion 5 with π
k
, summing over the components and us-
ing Equation 4 gives the following properties similar
to those of Equation 2:
2
∑
k=1
π
k
∗ µ
k
=
∑
N
i=1
x
i
N
= ¯x
2
∑
k=1
π
k
∗ (σ
2
k
+ µ
2
k
) =
∑
N
i=1
x
2
i
N
= s
2
+ ¯x
2
(6)
with ¯x the arithmetic mean and s the standard de-
viation computed from the observations.
The EM algorithm is started by using the follow-
ing somewhat arbitrary but for our clinical volumes
effective initial values for the parameters:
π
k
= 1/2
µ
1
= ¯x − α ∗ s
µ
2
= ¯x + α ∗ s
σ
k
= s
p
1 −α
2
(7)
This equation gives real values for the parame-
ters, fulfilling the conditions of Equation 6, as long
as 0 < α < 1. Which values for α have been tested
and which one is selected for the final experiments, is
given further detail in Section 4.1.
3.2 The EM Algorithm using the
Histogram
In order to reduce computational time, we propose to
use the histogram of the observations. If we have a
histogram {h
l
,l ∈ [1,M} instead of a set of observa-
tions {x
i
,i ∈ [1, N}, we can generate a set of observa-
tions from this histogram. For each bin we have h
l
ob-
servations with the observation value l (the bin num-
ber). To avoid troubles caused by possible zero parts
at the beginning and/or at the end of the histogram,
the first bin B and the last bin E with a nonzero value
are first computed:
(h
B
> 0) ∧ ((h
l
= 0)∀(l ∈ [1, B − 1]))
(h
E
> 0) ∧ ((h
l
= 0)∀(l ∈ [E +1,M]))
(8)
In the Expectation step the membership functions
{P
k,l
,k ∈ [1,2],l ∈ [B,E]} are computed as follows:
P
k,l
=
π
k
G(l; µ
k
,σ
k
)
∑
2
k=1
π
k
G(l; µ
k
,σ
k
)
(9)
From this equation the following properties of the
membership functions can be derived (similar as in
Equation 4):
ACCELERATION OF THE EXPECTATION-MAXIMIZATION ALGORITHM FOR A TWOFOLD GAUSSIAN
MIXTURE MODEL BY USING THE HISTOGRAM OF THE OBSERVATIONS INSTEAD OF THE OBSERVATIONS
- Evaluation of its Accuracy by Gener
231

0 ≤ P
k,l
≤ 1
2
∑
k=1
P
k,l
= 1
(10)
These membership functions are used to compute
new values for the parameters in the Maximization
step:
π
k
=
∑
E
l=B
h
l
P
k,l
∑
E
l=B
h
l
=
∑
E
l=B
h
l
P
k,l
N
µ
k
=
∑
E
l=B
h
l
P
k,l
l
∑
E
l=B
h
l
P
k,l
=
∑
E
l=B
h
l
P
k,l
l
N ∗ π
k
σ
2
k
+ µ
2
k
=
∑
E
l=B
h
l
P
k,l
l
2
∑
E
l=B
h
l
P
k,l
=
∑
E
l=B
h
l
P
k,l
l
2
N ∗ π
k
(11)
Multiplying the formulae for µ
k
and σ
2
k
in Equa-
tion 11 with
π
k
, summing over the components and
using Equation 10 gives the following properties sim-
ilar to those of Equation 6:
2
∑
k=1
π
k
∗ µ
k
=
∑
E
l=B
h
l
l
N
2
∑
k=1
π
k
∗ (σ
2
k
+ µ
2
k
) =
∑
E
l=B
h
l
l
2
N
(12)
The EM algorithm is started by using the same
initial values for the parameters as used in the pre-
vious section (see Equation 7) but now with ¯x and s
estimated from the histogram instead of from the ob-
servations.
3.3 Observations versus Histogram
Results
To test the EM algorithm based on histograms, we
have computed the parameters of a twofold Gaussian
mixture model from a set of observations, i.e. the 16
bits gray values of a MIP (Maximum Intensity Pro-
jection) image and from the corresponding gray value
histogram (256 bins between the minimum and max-
imum gray value of the MIP image). We have used
84 clinical volume datasets (58 of them with a res-
olution of 128x128x128 voxels, 25 of them with a
resolution of 256x256x256 voxels and 1 with a reso-
lution of 512x512x512 voxels), acquired with the 3D
Integris system (Philips-Medical-Systems-Nederland,
2001). The voxel size varies between 0.2 and 1.2 mil-
limeter.
The maximum relative differences between the
parameters of the twofold Gaussian mixture models,
computed using the observations, and those, com-
puted using the gray value histograms, are given in
Table 1.
Table 1: Maximum relative differences between the param-
eters of the twofold Gaussian mixture models, computed
using the observations, and those, computed using the his-
tograms. k is the number of the Gaussian component.
k π µ σ
1 0.1684% 1.0099% 0.8629%
2 0.3093% 0.5420% 0.1797%
These results show that even with a histogram of
256 bins (i.e. 16 bits gray values are reduced to 8 bits
gray values), the parameters of the twofold Gaussian
mixture models, derived from the 8 bits histogram,
have almost the same value as the parameters of the
twofold Gaussian mixture models, derived from the
original 16 bit gray values of the MIP images.
Since we have used the gray values of the MIP im-
ages (a 2D dataset with Θ(n
2
) observations) instead of
the gray values of the original volumes (a 3D dataset
with Θ(n
3
) observations), we can only give a lower
bound for the saving in computing time. The EM al-
gorithm based on histograms (including the time to
generate the histogram) was at least 1.8 times faster,
on average 3.9 times faster and at most 8.2 times
faster.
4 EVALUATION OF THE
ACCURACY OF THE EM
ALGORITHM
4.1 Experiments
The small relative differences (see Table 1) do not
guarantee that the parameters of the twofold Gaussian
mixture models, computed by the EM algorithm, are
accurate. Our histogram variant facilitates the evalua-
tion of the accuracy of the EM algorithm. Therefore,
we have generated histograms (256 bins) for a series
of twofold Gaussian mixture models with the follow-
ing parameters:
π
1
= {0.50, 0.52, ...,0.68,0.70}
π
2
= 1 − π
1
µ
1
= 0.30
µ
2
= {0.40, 0.42, ...,0.58,0.60}
σ
1
= 0.05
σ
2
= {0.050, 0.055, ...,0.095,0.100}
VISAPP 2009 - International Conference on Computer Vision Theory and Applications
232
We have combined all possible parameters, giv-
ing a total of 1331 Gaussian mixture models. The
chosen parameters for the Gaussian probability func-
tions (i.e. µ and σ) are multiplied with 256 before
the generation of the histogram so that the domain of
these parameters is the same as the bin numbers. The
generated histograms are comparable with gray value
histograms derived from a MIP image or a gray value
volume.
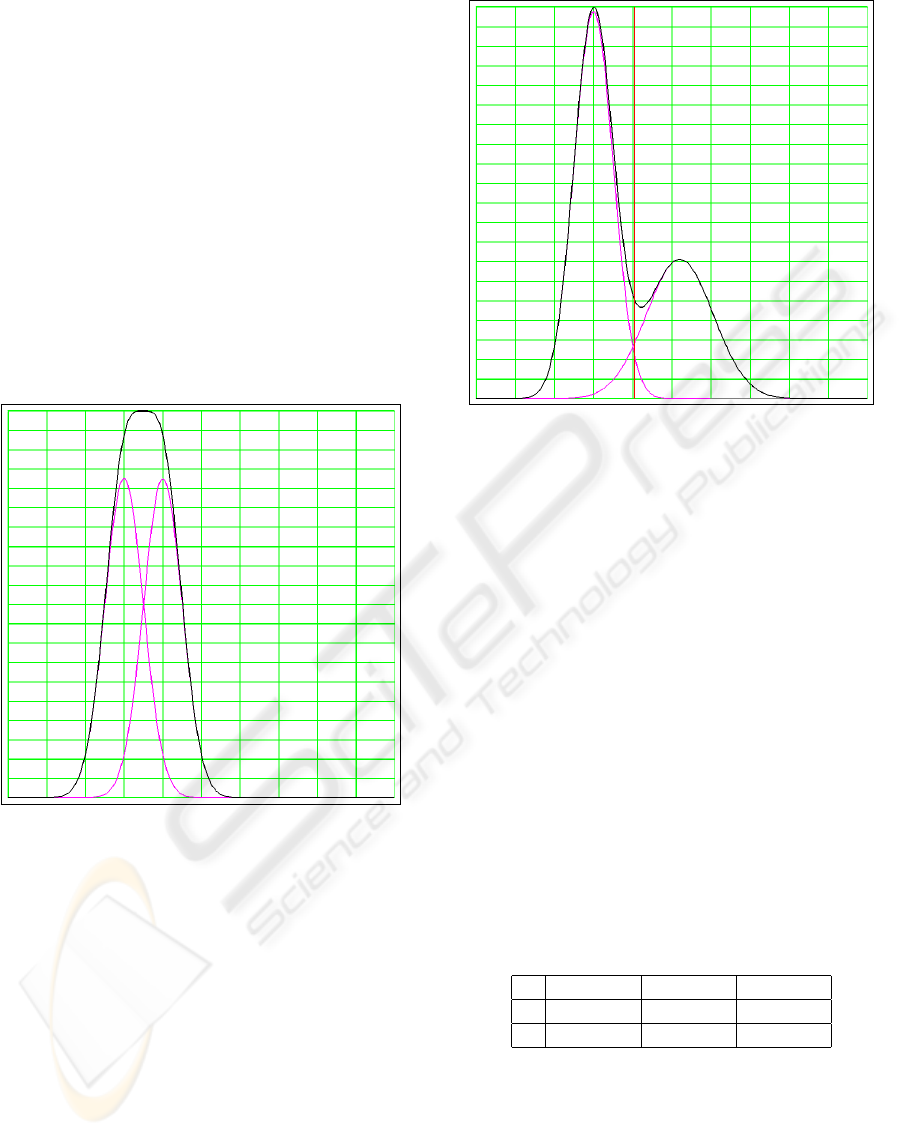
Two examples are shown in Fig. 3 and Fig. 4. In
the first example the Gaussian mixture model results
in a single wide cluster. In the second example the
Gaussian mixture model results in two overlapping
clusters. Note that in this last case the intersection of
the two Gaussian probability density functions does
not coincide with the position of the minimum be-
tween the two clusters.
Figure 3: Twofold Gaussian mixture model resulting in a
single wide cluster. The black curve is the generated his-
togram. The two magenta curves are the Gaussian density
functions.
As already told in Section 3.1, using Equation 7
results in initial values for the parameters which fulfill
the conditions of Equation 6, provided that 0 < α < 1.
We have tested the following values for α:
α = {0.1, 0.2, ....,0.9,0.99,0.999,0.9999}
In all cases, the mixing coefficient π
2
gave the
greatest relative error. The relative difference between
the maximum relative errors was less than 0.02%. So,
all tested values of α gave the same results for the
final parameters. The only difference was the maxi-
mum number of iterations. Higher values of α gave
a lower number of iterations, except α = 0.9999. To
avoid possible future problems with values for α very
Figure 4: Twofold Gaussian mixture model resulting in a
double cluster.
close to 1, we have used α = 0.9 for all experiments
(including for the comparison between observations
and histograms described in Section 3.3).
4.2 Results
The extracted versus the chosen parameters π
1
, π
2
, µ
2
and σ
2
of the twofold Gaussian mixture models are
shown in Fig. 11 upto and including Fig. 15. The
straight diagonal line from left under to upper right
gives the ideal relation (i.e. the extracted parame-
ter is exactly equal to the chosen parameter). As is
clear from these pictures, the EM algorithm results in
a small deviation of the least-square line through the
extracted parameters π
1
and π
2
compared to the ideal
relation line.
Table 2: The maxima of the relative deviations between the
chosen and extracted parameters of the twofold Gaussian
mixture models. Initial values derived from histograms us-
ing Equation 7. k is the number of the Gaussian component.
k π µ σ
1 3.3716% 0.3594% 0.8881%
2 6.5987% 1.1691% 2.2362%
The maxima of the relative deviations between the
chosen and extracted parameters of the twofold Gaus-
sian mixture models are given in Table 2. In this case,
the initial values for the iterative EM algorithm are
derived from the histograms using Equation 7. These
maxima reveal that the EM algorithm for a twofold
Gaussian mixture model results in small relative er-
rors for all parameters.
ACCELERATION OF THE EXPECTATION-MAXIMIZATION ALGORITHM FOR A TWOFOLD GAUSSIAN
MIXTURE MODEL BY USING THE HISTOGRAM OF THE OBSERVATIONS INSTEAD OF THE OBSERVATIONS
- Evaluation of its Accuracy by Gener
233

To verify our EM algorithm we have also used the
chosen parameters as initial values. The maxima of
the relative deviations between the chosen and ex-
tracted parameters of the twofold Gaussian mixture
models are given in Table 3. So, if the chosen pa-
rameters of the twofold Gaussian mixture models are
used as initial values, the EM algorithm result in very
small relative errors.
Table 3: The maxima of the relative deviations between the
chosen and extracted parameters of the twofold Gaussian
mixture models. Chosen parameters used as initial values.
k is the number of the Gaussian component.
k π µ σ
1 0.0015% 0.0000% 0.0000%
2 0.0020% 0.0031% 0.0249%
The number of iterations for the experiments with
the initial values derived from the histograms, varied
between 4 and 910 with a mean value of 77.3. As
can be expected, the number of iterations for the ex-
periments with the initial values equal to the chosen
parameters was much lower, namely always 2.
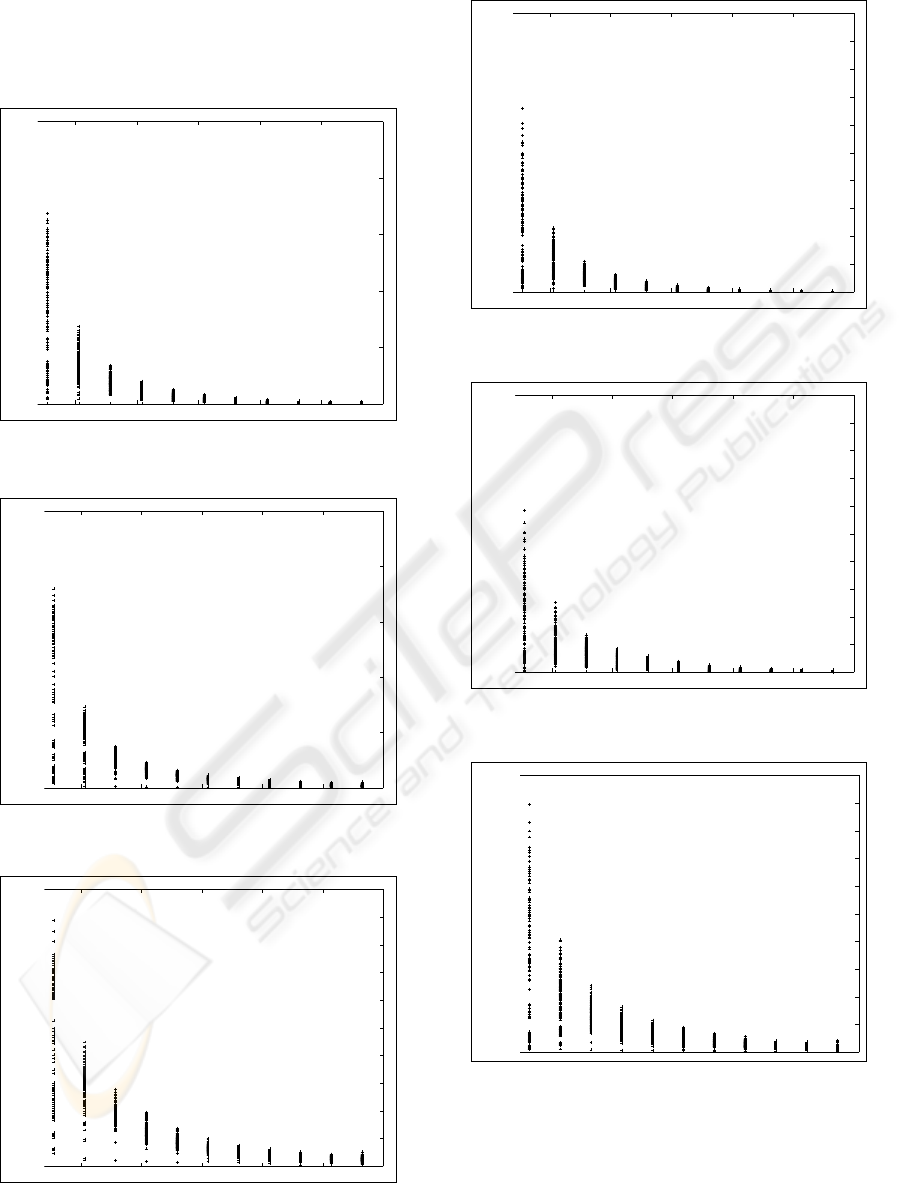
4.3 Discussion
As is clear from Fig. 5 upto and including Fig. 10,
the relative errors in the extracted parameters of the
twofold Gaussian mixture models are related to the
differences between the chosen mean coefficients µ
1
and µ
2
. So, as can be expected, the EM algorithm may
give better results if the mean coefficients µ
1
and µ
2
of the two Gaussian components differ more.
But for our gray value segmentation algorithms
the only important parameter is the segmentation
threshold (i.e. the intersection point of the two Gaus-
sian components). The extracted versus the ”chosen”
threshold is shown in Fig. 13. The maxima of the ab-
solute and relative deviations are 0.3922 (also a bin
number between 1 and 256) respectively 1.1111%.
So, the deviations in the threshold are also small.
To facilitate value judgment of the EM threshold
deviations, we extracted the Kittler threshold (Kit-
tler and Illingworth, 1986) from the generated his-
tograms. The Kittler versus the ”chosen” threshold
is shown in Fig. 16. The maxima of the absolute and
relative deviations are 2.7451 (also a bin number be-
tween 1 and 256) respectively 7.3684%. Comparing
Fig. 16 with Fig. 13, and comparing the Kittler de-
viations with the EM deviations, reveals that the EM
threshold is more accurate than the Kittler threshold.
REFERENCES
Bilmes, J. (1997). A gentle tutorial on the EM algorithm and
its application to parameter estimation for gaussian
mixture and hidden markov models. Technical Re-
port ICSI-TR-97-021, University of Berkeley, Berke-
ley, CA, USA.
Dempster, A., Laird, N., and Rubin, D. (1977). Maxi-
mum likelihood from incomplete data via the EM al-
gorithm. J. Royal Statist. Soc. Series B (Methodologi-
cal), 39(1):1–38.
Frederix, G. (2005). Beyond Gaussian Mixture Models: Un-
supervised Learning with applications to Image Anal-
ysis. PhD thesis, Katholieke Universiteit of Leuven,
Belgium.
Frederix, G. and pauwels, E. (2004). A statistically princi-
pled approach to histogram segmentation. Technical
Report Report PNA-E0401, CWI, Amsterdam, The
Netherlands.
Gan, R., Chung, A., Wong, W., and Yu, S. (2004a). Vascular
segmentation in three-dimensional rotational angiog-
raphy based on maximum intensity projections. In
Proc. IEEE International Symposium on Biomedical
Imaging: From Nano to Macro, pages 133–136, Ar-
lington, VA, USA.
Gan, R., Wong, W., and Chung, A. (2005). Statistical cere-
brovascular segmentation in three-dimensional rota-
tional angiography based on maximum intensity pro-
jections. Med. Phys., 32(9):3017–3028.
Gan, R., Wong, W., Chung, A., and Yu, S. (2004b).
Statistical cerebrovascular segmentation in three-
dimensional rotational angiography based on maxi-
mum intensity projections. In Proc. CAR, pages 195–
200, Chicago, USA.
Kemkers, R., de Beek, J. O., Aerts, H., Koppe, R., Klotz,
E., Grasse, M., and Moret, J. (1998). 3D-rotational
angiography: First clinical application with use of a
standard philips C-Arm system. In Proc. CAR, pages
182–187, Tokyo, Japan.
Kittler, J. and Illingworth, J. (1986). Minimum error thresh-
olding. Pattern Recognition, 19(1):41–47.
Liao, P., Chen, T., and Chung, P. (2001). A fast algorithm
for multilevel thresholding. Journal of Information
Science and Engineering, 17(5):713–727.
Moret, J., Kemkers, R., de Beek, J. O., Koppe, R., Klotz,
E., and Grass, M. (1998). 3D rotational angiography:
Clinical value in endovascular treatment. Medica-
mundi, 42(3):8–14.
Otsu, N. (1979). A threshold selection method from gray
level histograms. IEEE Trans. Syst., Man, Cybern.,
9(1):62–66.
Philips-Medical-Systems-Nederland (2001). INTEGRIS
3D-RA. instructions for use. release 2.2. Techni-
cal Report 9896 001 32943, Philips Medical Systems
Nederland, Best, The Netherlands.
Wilson, D. and Noble, J. (1999). An adaptive segmentation
algorithm for time-of-flight MRA data. IEEE Trans.
Med. Imag., 18(10):938–945.
VISAPP 2009 - International Conference on Computer Vision Theory and Applications
234
APPENDIX
Pictures
30 40 50 60 70 80
Figure 5: Relative error in % of the extracted π
1
versus the
chosen µ2 − µ1.
30 40 50 60 70 80
Figure 6: Relative error in % of the extracted µ
1
versus the
chosen µ2 − µ1.
30 40 50 60 70 80
Figure 7: Relative error in % of the extracted σ
1
versus the
chosen µ2 − µ1.
30 40 50 60 70 80
Figure 8: Relative error in % of the extracted π
2
versus the
chosen µ2 − µ1.
30 40 50 60 70 80
Figure 9: Relative error in % of the extracted µ
2
versus the
chosen µ2 − µ1.
Figure 10: Relative error in % of the extracted σ
2
versus the
chosen µ2 − µ1.
ACCELERATION OF THE EXPECTATION-MAXIMIZATION ALGORITHM FOR A TWOFOLD GAUSSIAN
MIXTURE MODEL BY USING THE HISTOGRAM OF THE OBSERVATIONS INSTEAD OF THE OBSERVATIONS
- Evaluation of its Accuracy by Gener
235
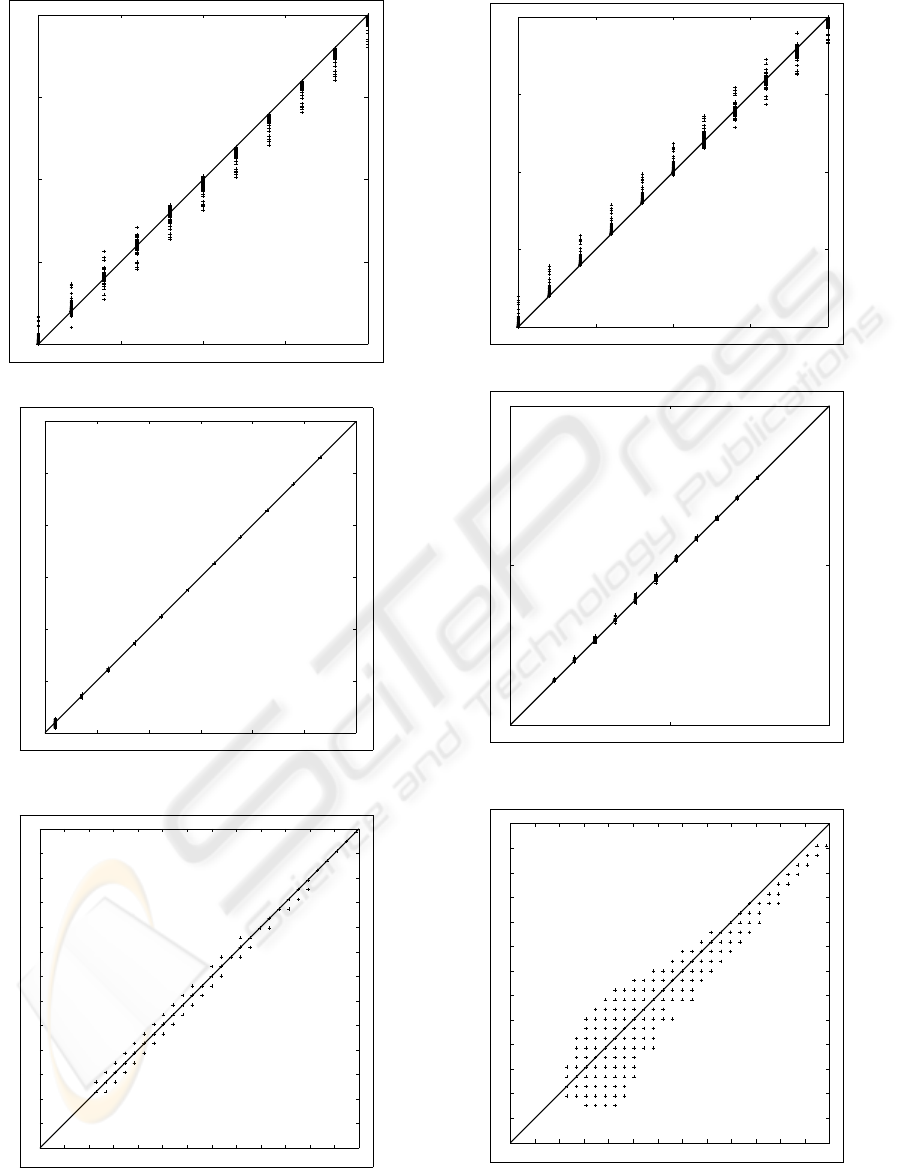
0.5 0.55 0.6 0.65 0.7
0.5
0.55
0.6
0.65
0.7
Figure 11: The extracted versus the chosen π
1
.
100 110 120 130 140 150 160
100
110
120
130
140
150
160
Figure 12: The extracted versus the chosen µ
2
as bin num-
ber between 1 and 256.
33 46
33
46
Figure 13: Extracted versus ”chosen” threshold (bin num-
ber between 1 and 256) by EM algorithm.
0.3 0.35 0.4 0.45 0.5
0.3
0.35
0.4
0.45
0.5
Figure 14: The extracted versus the chosen π
2
.
10 20 30
10
20
30
Figure 15: The extracted versus the chosen σ
2
as bin num-
ber between 1 and 256.
33 46
33
46
Figure 16: Extracted versus ”chosen” threshold (bin num-
ber between 1 and 256) by Kittler algorithm.
VISAPP 2009 - International Conference on Computer Vision Theory and Applications
236
