
EXTENDED VISUALIZATION FOR A DIGITAL JOURNAL
Muhammad Salman Khan, Muhammad Tanvir Afzal, Narayanan Kulathuramaiyer
and Herman Maurer
Institute for Information Systems and Computer Media, Technical University of Graz,Graz, Austria
Keywords: Temporal, Geographical, Categorical, Bubble chart, Pie chart.
Abstract: Content analysis has been a tradition of many electronic and printed journals, in order to ensure quality and
the journal’s standing. Traditionally, researchers have tried to analyze patterns in scholarly publications
using normal tables and statistical charts. In this paper we present an interactive visualization system that
can help for a deeper analysis of different trends’ patterns hidden in scholarly publications of a digital
journal. We apply this technique to the Journal of Universal Computer Science (J.UCS). The proposed
visualization system is an easy to use web application, based on animated 2D bubble chart and pie chart to
handle geographical, temporal and large kinds of categorical data. The paper gives a brief overview of the
state of the art visualization techniques available to understand the knowledge structure of any given
academic discipline. The design and technical aspects of the proposed visualization tool and various
interesting results drawn from it have been discussed.
1 INTRODUCTION
In any academic discipline research publications
represent the knowledge structure of that discipline.
This knowledge structure reflects the history,
research trends, social structure of researchers,
networks of scholarly papers, experts, key papers,
contributions and collaborations of institutions and
regions. Much can be learned by analyzing the
research contributions in a journal or conferences of
any discipline about a given field of study (Taylor,
2001). This practice of analyzing publications has
been a tradition of many printed and electronic
journals. During the last few decades many studies
have been conducted to analyze the publications
patterns by length of articles, citations, affiliations
and geographical distribution of authors,
contributions in different research areas, trends of
research areas over time by analyzing publications
of one or more academic journals (Taylor, 2001),
(Hawkins, 2001). The benefits of such analysis are
enormous; first, it helps the administration of a
journal in increasing its quality by determining the
coverage and impact of the journal and the journal’s
standing, secondly it can be used to evaluate
individuals, organizations, groups and nations which
in turn may be used to inform the impact of
decisions and policies made for allocating resources
and funds, and thirdly it reduces the researchers’
menial efforts to conduct their surveys and shows a
broader picture for them to understand the field of
their interest (Boerner et al., 2003). In our previous
work (Khan et al., 2008) we explored the usage of
mash-ups, an emerging Web 2.0 technology to
strengthen the internal administration and providing
better facilities for the authors and readers of a
digital journal. The proposed system was a good tool
in highlighting the geographical coverage of
publications and editors in any particular research
area, bias groups of authors and editors in the review
process of articles, selection of special issues
according to the geographical policy of the journal,
novel navigational features and determining research
collaborators for authors and readers. But the system
was limited in answering number of issues such as:
how the papers, authors and institutions
contributions and research interests have changed
overall across the glob or in a particular location
over the period of time to help in promoting the
journal globally or at any particular location, in
finding which research area is becoming localized to
a specific community, which research area is
evolving or declining to assist in making decisions
regarding the call and acceptance of special issues
and acquiring reviewers accordingly, which research
area is becoming hot for researchers. In this paper
we introduce an interactive user-friendly web based
visualization technique that can help for a deeper
analysis of different trends’ patterns in scholarly
publications of a digital journal and its field of study
385
Khan M., Afzal M., Kulathuramaiyer N. and Maurer H.
EXTENDED VISUALIZATION FOR A DIGITAL JOURNAL.
DOI: 10.5220/0001754303850388
In Proceedings of the Fifth International Conference on Web Information Systems and Technologies (WEBIST 2009), page
ISBN: 978-989-8111-81-4
Copyright
c
2009 by SCITEPRESS – Science and Technology Publications, Lda. All rights reserved

over time.
Traditionally, researchers have tried to analyze
patterns in scholarly publications using tables and
statistical charts. Interactive visualizations has been
used by (Ke et al., 2004), (In-SPIRE, 2004) to
realize different patterns such as citations network of
publications, number of papers over time and the
correlated research areas in the publications
published during the 8 years of InfoVis conferences.
In (Erten et al., 2004) authors have used 100,000
unique ACM computer science papers and analyzed
with the help of interactive node link graph the
evolution of different research areas and the
collaborative network of scientists in the field of
computer science. All the systems mentioned above
are a good tool in understanding either the network
of papers, authors and research areas or how the
research areas have emerged over the time but they
do not demonstrate the change of interest in
publications contributions and research areas across
different regions. NetLens (Kang et al., 2007)
applied a different approach where interactive bar
charts, list view and multiple coordinated windows
were used to analyze and compare trends over time
among different research areas, different countries,
important authors, papers and institutions for CHI
conferences. But the adopted visualization approach
is handling a fewer number of research areas
(categories) of the papers, which if increased can put
cognitive load to the users while comparing trends
of different research areas over the time. Moreover
the users can not compare the contributions from
different locations with each other over the period of
time (how different locations have progressed as
compared to others).
The proposed web based visualization tool
elaborated by this paper uses a simple animated 2D
bubble chart and pie chart for handling multivariate
(Geographical, Temporal and large Categorical)
data, and demonstrates deeper trends’ patterns over
time for the authors and administration of a journal
and the researchers of its field. We use J.UCS as an
example for our analysis. J.UCS is an open access,
high quality, peer reviewed electronic journal having
more than 1000 publications since 1994. The journal
covers all aspects of computer science discipline
(J.UCS, 2008).
2 TECHNICAL ASPECTS OF THE
VISUALIZATION TOOL
In order to make J.UCS a high quality peer reviewed
journal and maintaining its international standing,
the administration, authors and readers of J.UCS
needs to visualize the current status of the journal.
There is a need to visualize various factors such as
the rise or decline of research areas, the coverage or
impact of the journal, authors and institutions
participations and the trends of length of papers
across different research areas and locations.
2.1 J.UCS Data Extraction
The J.UCS document collections and their metadata
are stored and managed using the Hyperwave system
(Hyperwave, 2008). Publications in J.UCS have a
corresponding metadata (XML) file, one for each
paper that contains all the information about it such
as title, authors, institutions, volume, issue etc. In the
development of the visualization tool, metadata
about papers published was captured from the
Hyperwave server using Hyperwave APIs and stored
in a relational database.
2.2 Visualization Tool Design Choices
By keeping in view the initial requirements, the data
contains three dimensions as follows:
1. Temporal
2. Categorical (More than 400 three level ACM
categories and two additional categories i.e.
“Science and Technology of Learning” and
“Knowledge Management”)
3. Geographic
A detailed survey (highlighted in section 1) of
various available visualization tools that can fulfil
the requirements mentioned above has been
conducted. The motivation was to develop a user
friendly, easy to understand trend analyzer that
targets not only the experts but also general
academic users. An appropriate choice was to use
Gapminder (Gapminder, 2008), which can visualize
geographical trends over time in the form of
animated bubble charts. But the limitation of this
tool is that it does not cater to categorical data,
which in our case are ACM categories. On the basis
of Gapminder a visualization tool was implemented
that uses bubble chart to illustrate geographical
trends and a pie chart to depict details about
categories for any location.
3 EXPERIMENTAL RESULTS
In this section, some interesting results are presented
that can be obtained with this visualization tool. The
main interface of the visualization tool is shown in
Fig. 1. The user can select to view patterns in the
publications published in regular issues, special
issues or both.
WEBIST 2009 - 5th International Conference on Web Information Systems and Technologies
386
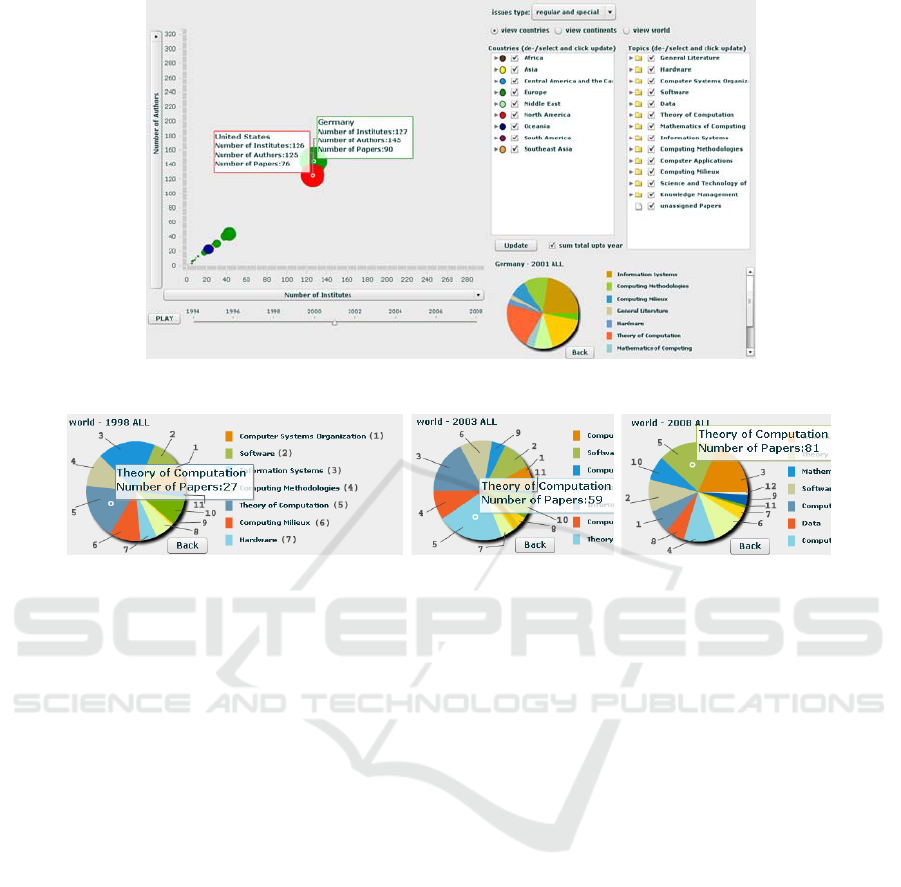
Figure 1: Main Interface.
Figure 2: Distribution of publications for the level-1 categories.
The user can also select to view patterns in the
whole world as a single entity
or across countries and regions. The results can also
be filtered by selecting any topic or country from the
list of countries and topics. A temporal slider has
been provided for the users to scroll across different
years. The user can also play the slider for automatic
scroll across the years and can view the animated
moving bubbles and pie chart to reveal different
patterns. Each bubble on the chart represents a
country, region or the whole world based on the user
selection. The color and size of the bubbles
represents the location and number of publications
respectively. The axis of the animated bubble chart
contains various options in which the user might be
interested, such as number of institutes, number of
authors, number of papers, average length of papers,
and average number of authors per paper. The pie
chart represents the distribution of publications
across topics for any particular country, region or the
whole world. In order to facilitate an easy analysis
and to better understand the results, the publications
of J.UCS from 1994-2008 have been divided in three
groups; each spanning 5 years i.e. 1994-1998, 1999-
2003 and 2004-2008 (so far papers for the first six
months of year 2008 are available). In this paper we
are considering mainly regular issues instead of
special issues of J.UCS for our analysis because they
represent a clear picture about various trends. The
following sub-sections represent some interesting
results with regards to three different views.
3.1 World View
This view reflects all publications in J.UCS as a
single entity. The results demonstrate the evolution
of J.UCS with regards to the number of publications,
institutions and authors for the regular issues. The
total number of publications, authors and institutions
in J.UCS were 130, 206 and 200 respectively up to
1998. It is observed that there is a consistent decline
in publications for the time period 1999-2003 (90)
and 2004-2008 (84), whereas authors and
institutions first declined for the time period 1999-
2003 (140 authors, 133 institutions) and then started
to increase in 2004-2008 (177, 156). These statistics
also reflect the inclusion of new authors and
institutions in the journal instead of being occupied
by some groups of authors. Fig. 2 demonstrates the
distribution of publications across different research
areas. It is observed that the two top most research
areas are “Theory of Computation” (1994-1998: 27,
1999-2003: 32, 2004-2008: 22) and “Information
Systems” (1994-1998: 28, 1999-2003: 20, 2004-
2008: 28). The same view can also be used to
visualize research areas that have started to diminish
or grow. For example up to 1998 there was only one
publication in the research area “Computer
EXTENDED VISUALIZATION FOR A DIGITAL JOURNAL
387

Applications”. Then there is a sudden rise in
publications (11) from 1999-2003 and again a
decline in publications (2) from 2004-2008. A
similar phenomenon happened with “General
Literature”. The user has the choice to view the
similar trends in the sub-categories of any research
area by clicking any top level category on the
animated pie chart. It has been observed that
“Software Engineering” (a sub- category of
“Software”) was not a dominant research area when
compared to “Programming Languages” up to 1998,
but it started to evolve from 1999-2008 and is now
the most dominant research area in its category. The
emergence of “Software Engineering” can be further
validated by considering both special and regular
submissions. Such analysis of research areas is
necessary as it gives an overview to the new
researchers about the emergent or hot research areas
of their field. Moreover it helps the administration of
the journal to acquire reviewers for each research
area accordingly, for the call and acceptance of
special issues and to ensure that the coverage of the
journal in each research area remains global instead
to a particular locality.
3.2 Regional View
This view demonstrates the distribution of
publications across different regions. The results
show that European countries remain as the main
source of publications in the journal for all the time
periods but there is consistent decline of publications
(1994-1998: 92, 1999-2003: 67, 2004-2008: 50)
with the passage of time from Europe. Further
analysis revealed that the Asian countries including
China, India, Pakistan, Japan, South Korea and
Russia are consistently contributing more
publications (1994-1998: 6, 1999-2003: 6, 2004-
2008: 10) in the journal.
3.3 Countries View
This view further provides more insight into
publications patterns. It enables the users to
understand the participation of each country in the
journal, when a country started to contribute, when it
stopped to contribute, who is contributing more or
less in a research area. The results reflect that most
of the publications in J.UCS have been contributed
by Austria (1994-1998: 24, 1999-2003: 16, 2004-
2008: 12) followed by Germany. Further analysis
revealed that most of the authors (1994-1998: 31,
1999-2003: 27, 2004-2008: 13) and institutions
(1994-1998: 31, 1999-2003: 21, 2004-2008: 11)
participations are from Germany. Interestingly
Finland and New Zealand were contributing
frequently in the journal for the first two time
periods but each of them has contributed only one
publication from 2003 to 2008. The administration
of the journal in this case can take action to
encourage researchers in these locations to submit
their papers in the journal.
4 CONCLUSIONS AND FUTURE
WORK
A simple approach using 2D animated charts has
been demonstrated that handles geographic,
temporal and large kinds of categorical data to
realize hidden trends in scholarly publications of a
digital journal. Our experimentations conclude that
the proposed web based visualization system is a
powerful tool in determining the impact, coverage
and the status of the journal at deeper level.
Moreover it also draws a broader picture for the
researchers about the field of their interest.
In future, we have to further investigate the
proposed visualization tool by usability testing for
further improvements. We would like to enlarge our
data by including papers from publicly available
databases (DBLP, CiteSeer).
REFERENCES
Boerner, K., Chen, C. and Bayak, K. W., 2003.
Visualizing Knowledge Domains, Blaise Cronin (Ed.)
Annual Review of Information Science and
Technology, Inc/American Society for Information
Science and Technology, chapter 5, pp. 179-255.
J.UCS, 2008. http://www.jucs.org
Ke, W., Boerner, K. and Vishwanath L., 2004. Major
Information Visualization Authors, Papers and Topics
in the ACM Library. In InfoVis’04, IEEE Symposium
on Information Visualization.
In-SPIRE, 2004.http://in-spire.pnl.gov/
Erten, C., Harding, P. J., Kobourov, S. G. and Wampler,
K., 2004. Exploring the computing literature using
temporal graph visualization. (Tech. Rep. TR0304).
Kang, H., Plaisant, C., Lee, B. and Bederson, B. B., 2007.
NetLens: iterative exploration of content-actor
network data, IV, 6, 1, pp. 18-31.
Gapminder, 2008. http://www.gapminder.org/world.
Hyperwave, 2008. http://www.hyperwave.com/e/.
Khan, M. S., Kulathuramayer, N., Maurer, H, 2008.
Applications of Mash-ups for a Digital Journal. Journal of
Universal Computer Science, 14, 10, pp. 1695-1716.
Taylor, E. W., 2001. Adult Education Quarterly From
1989 To 1999: A Content Analysis of All
Submissions. AEQ, 51, 4, pp. 322-340.
Hawkins, D. T., 2001. Bibliometrics of electronic journals
in information science. IR, 7, 1.
WEBIST 2009 - 5th International Conference on Web Information Systems and Technologies
388
