
MULTIMODAL REGISTRATION OF NMR-VOLUMES AND
HISTOLOGICAL CROSS-SECTIONS OF BARLEY GRAINS ON
THE CELL BROADBAND ENGINE PROCESSOR
Rainer Pielot
1
, Udo Seiffert
2
1
Leibniz-Institut für Pflanzengenetik und Kulturpflanzenforschung (IPK), Corrensstraße 3, D-06466 Gatersleben
2
Fraunhofer Institut für Fabrikbetrieb und -automatisierung (IFF), Sandtorstraße 22, D-39106 Magdeburg, Germany
Bertram Manz
3
, Diana Weier
1
, Frank Volke
3
, Falk Schreiber
1
, Winfriede Weschke
1
3
Fraunhofer Institut für Biomedizinische Technik (IBMT), Ensheimer Str. 48, D-66386 St.Ingbert/Saar, Germany
Keywords: NMR, Multimodal, Registration, Alignment.
Abstract: Representation of developmental gradients in biological structures requires visualization of storage
compounds, metabolites or mRNA hybridization patterns in a 3D morphological framework. NMR imaging
can generate such a 3D framework by non-invasive scanning of living structures. Histology provides the
distribution of developmental markers as 2D cross-sections. Multimodal alignment tries to put such
different image modalities into correspondence. Here we compare different methods for rigid registration of
3D NMR datasets and 2D cross-sections of developing barley grains. As metrics for similarity
measurements mutual information, cross correlation and overlap index are used. In addition, different filters
are applied to the images before the alignment. The algorithms are parallelized, partially vectorized and
implemented on the Cell Broadband Engine processor in a Playstation® 3. Evaluation is done by a
comparison of the results to a manually defined gold standard of a NMR dataset and a corresponding 2D
cross-section of the same grain. The results show, that best alignment is achieved by application of mutual
information on sobel-filtered images and, compared to the implementation on a standard single-core CPU,
the computation is accelerated by a factor up to 1.95.
1 INTRODUCTION
Analysis of developmental processes in the growing
barley grain gives insights into regulatory
phenomena and helps for enhancing seed quality and
breeding more robust and useful barley varieties.
The analysis of developmental gradients requires
stacks of 2D slices obtained by histological standard
procedures at certain developmental stages. Putting
these 2D slices into spatial correspondence enables
the visualization of developmental gradients at this
stage. For the correct determination of the spatial
position of each slice we have generated 3D datasets
of barley grains at different developmental stages by
Nuclear Magnetic Resonance (NMR) imaging. The
3D datasets serve as spatial frameworks to register
the 2D slices, which require the registration of
multimodal data.
The registration of multimodal images, which are
obtained from different imaging techniques, is one
of the important applications in biological and
medical image processing. Different imaging
techniques show different aspects of anatomy or
functional activity, so that optimal registration puts
heterogeneous information into the same spatial
framework. Clinical applications like comparing
images of the human brain, e.g. obtained by NMR
imaging and Positron Emission Tomography (PET)
(Thevenanz and Unser, 2000) spurred the
investigation of multimodal alignment algorithms.
For correct alignment the correspondence of both
multimodal images has to be found. In case of rigid
alignment, one image is held fixed and the floating
image is translated and rotated. Automatic
241
Pielot R., Seiffert U., Manz B., Weier D., Volke F., Schreiber F. and Weschke W. (2009).
MULTIMODAL REGISTRATION OF NMR-VOLUMES AND HISTOLOGICAL CROSS-SECTIONS OF BARLEY GRAINS ON THE CELL BROADBAND
ENGINE PROCESSOR.
In Proceedings of the Fourth International Conference on Computer Vision Theory and Applications, pages 241-244
DOI: 10.5220/0001767102410244
Copyright
c
SciTePress

approaches determine the correct translation and
rotation based on a similarity function, which
measures the degree of correspondence between the
fixed and the floating image. The similarity function
can rely on differences in intensity like cross
correlation (van den Elsen, 1994) or gradient
information (Maintz, et al., 1996). In multimodal
image alignment mutual information is mainly used
as similarity measurement (Maes, et al., 2003;
Pluim, et al., 2003). The combination of intensity
gradients and mutual information is also used in
medical image processing (Pluim, et al., 2000).
Implementations of alignment algorithms need
usually much computation time, therefore ways for
acceleration are searched. The upcoming of multi-
core processors motivates the exploitation of
inherent parallelisms in many algorithms dealing
with images. The Cell Broadband Engine (CBE)
Processor, developed by Sony, Toshiba and IBM, is
a heterogeneous multicore-processor, consisting of
one PowerPC Processor Element (PPE) and eight
Synergistic Processor Elements (SPE). The SPE are
optimized for calculations, whereas the PPE is more
suitable for running operating systems. By running
Linux on a Playstation® 3 console only six SPEs are
available, but this system gives the inexpensive
opportunity to unleash the power of an amazing
state-of-the-art multi-core processor. We have
implemented different 2D/3D multimodal alignment
algorithms on the Playstation® 3 and on standard
hardware and compared the computation times. The
algorithms were tested by registration of a cross-
section of a barley grain to a corresponding NMR
volume and the alignment results were compared to
a gold standard, which was obtained by manual
alignment.
2 MATERIAL & METHODS
For this study a 3D NMR dataset of a whole barley
grain at 7 days after flowering was obtained with a
Bruker DMX 400 spectrometer (Bruker,
Rheinstetten, Germany). The image resolution was
31 µm along the axial and 16 µm along the
transverse directions. The dimension of the dataset
was 256 x 175 x 512 voxels. The 2D cross-section
was obtained by standard histological procedures
and was digitized with an original dimension of
1600 x 1200 pixel. It was converted into grayvalues
and scaled to meet the pixelsize of the NMR dataset.
The backgrounds in both images were manually
corrected.
2.1 Alternative Preprocessing
The reduction of noise was realized by application
of a median filter with a filter radius of 2.0.
Alternatively, the contrast was enhanced by
histogram equalization. In case of the median-
filtered images, optionally the gradient information
was extracted to detect the contours of structures.
For this task a sobel filter with a 5 x 5 mask was
applied.
2.2 Similarity Functions
Most prominent in multimodal registration is the
application of mutual information as similarity
function. Mutual information measure the degree of
dependence of a random variable to another by
comparing the probability distributions. Given two
probability distributions p
T
(t) and p
F
(f) and the joint
probability p
TF
(t,f) of the target image T and the
floating image F, the normalized mutual information
NMI is defined as (Maes, et al., 2003):
∑
=
ft
FT
TF
TF
fptp
ftp
ftpFTNMI
,
)
)(*)(
),(
log(*),(),(
(1)
If image T and image F are perfectly aligned, this
function should give the highest signal.
The linear cross correlation coefficient CC
compares the similarity of the intensity distributions
g(t
i
) and g(f
i
) between both images T and F:
∑∑
∑
=
i
i
i
i
i
ii
fgtg
fgtg
FTCC
22
)(*)(
)(*)(
),(
(2)
The index i denotes the position. The comparison of
the gray value images should lead to bad results,
because same structures in multimodal images tend
to be visualized by different gray values. If the
gradient information is used, contours are matched
and should improve the results.
The last similarity function used in this paper is
the overlap index OI, which describes the extent of
the image overlap and therefore quantifies the
geometric correspondence between both images:
FT
TF
NN
N
FTOI
+
=
*2
),(
(3)
VISAPP 2009 - International Conference on Computer Vision Theory and Applications
242
N
T
and N
F
are the areas of the images T and F and
N
TF
is the area of overlap. N is simply the number of
non-background pixels.
The 2D/3D registration procedure was composed
by single 2D/2D alignments. At each single z-
position in the NMR volume the best alignment was
calculated by varying the translation parameters and
the rotation angle in the xy-plane. This procedure
was done successively for all slices in the NMR
volume and the slice with the highest signal of the
used similarity function gives the translation
parameter in the z-direction. The search space was
constrained in x- and y-direction from -30 to 30
pixel translation and from slice 100 to slice 300 in
the NMR volume (translation in z-direction). The
rotation angle in the xy-plane was constrained to
-20° to 20°. Due to the noisy solution space (Pielot,
et al., in preparation) all possible combinations of
parameters were calculated.
On the Playstation® 3 the Cell-SDK 2.1 was
used under Yellow Dog Linux 5.0. The
implementations of the similarity functions were
vectorized to exploit the SIMD architecture of the
SPEs. For comparison, the same algorithms were
implemented on a Opteron 850 SMP-System (2.4
GHz) with Linux 2.6.13 and gcc 4.2.0.
3 RESULTS
The NMR dataset is depicted in Fig. 1a as a volume
rendering. The histological cross-section is shown in
Fig. 1b and the same image after scaling and
converting into grayvalues in Fig.1c.
The calculations were performed with the
unprocessed images and, in case of using NMI and
CC as similarity functions, with median-filtered,
contrast-enhanced and sobel-filtered images.
Application of OI as similarity functions on gradient
or filtered images would not change the result due to
thresholding. Table 1 shows the results of
alignments. The quality Q of alignment is evaluated
by
α
α
Δ−Δ−Δ−Δ−
+++=
aza
z
ya
y
xa
x
ekekekekQ
(4)
with k
{x;y;z;α}
={0,2;0,2;0,2;0,4) as weighting factors
and a=0,2 as global factor. Δx, Δy, Δz and Δα are the
absolute differences between the found alignment
parameters and the defined gold standard.
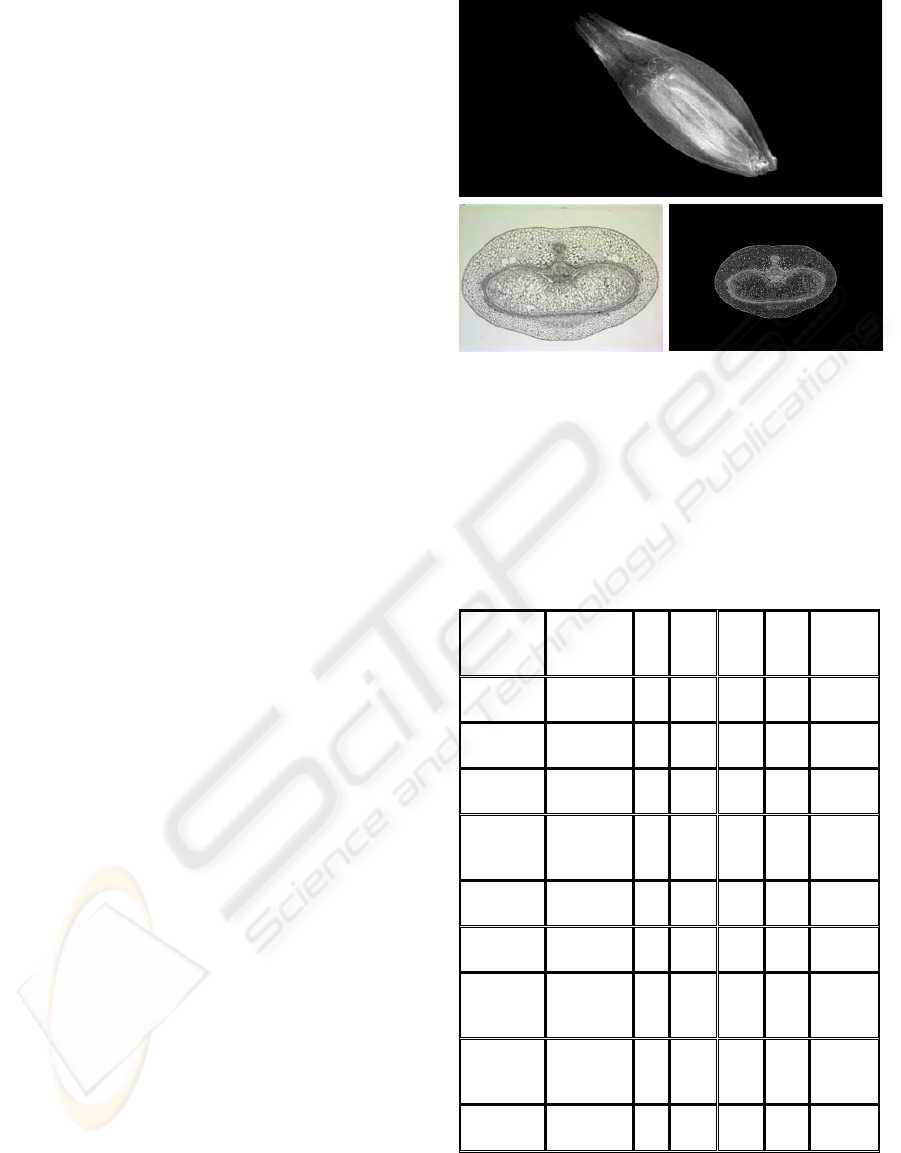
Figure 1: A volume rendering of the target NMR 3D
dataset (a). The original histological 2D cross-section from
the same grain is depicted in (b) and after converting into
grayvalues and scaling in (c). The NMR dataset includes
the complete grain (caryopsis + glumes), whereas the
cross-section shows only the caryopsis.
Table 1: Found alignment parameters. The manual defined
gold standard was: x=9 pixel, y=-5 pixel, z=slice 170 and
α=2. The quality Q was calculated with the differences of
these parameters to the gold standard.
Pre-
p
rocessin
g
Similarity
function
x y z α Q
- NMI 1 0 251 3 0,45
median NMI 1 2 260 0 0,36
contrast NMI 7 -3 188 1 0,60
median +
sobel
NMI 10 -7 170 0 0,77
- CC 12 -3 100 2 0,64
median CC 10 -2 103 2 0,67
contrast CC 4 -30 100 -19 0,08
median +
sobel
CC 8 -1 205 2 0,65
- OI 7 -1 203 1 0,55
It can be seen, that NMI in combination with
gradient images achieved the highest quality value.
a)
c)b)
MULTIMODAL REGISTRATION OF NMR-VOLUMES AND HISTOLOGICAL CROSS-SECTIONS OF BARLEY
GRAINS ON THE CELL BROADBAND ENGINE PROCESSOR
243
The computation times are depicted in Table 2.
The simple parallelization and vectorization speeds
up the computation time with a factor from 1.26 to
1.95.
Table 2: Computation times for the application of NMI as
similarity function. Only the results for the unprocessed
images are shown.
Similarity
function
Computation
time CBE [s]
Computation
time Opteron
[s]
Speed
up
factor
NMI 10,289 20,068 1.95
CC 9,963 12,518 1.26
OI 7,038 10,557 1.50
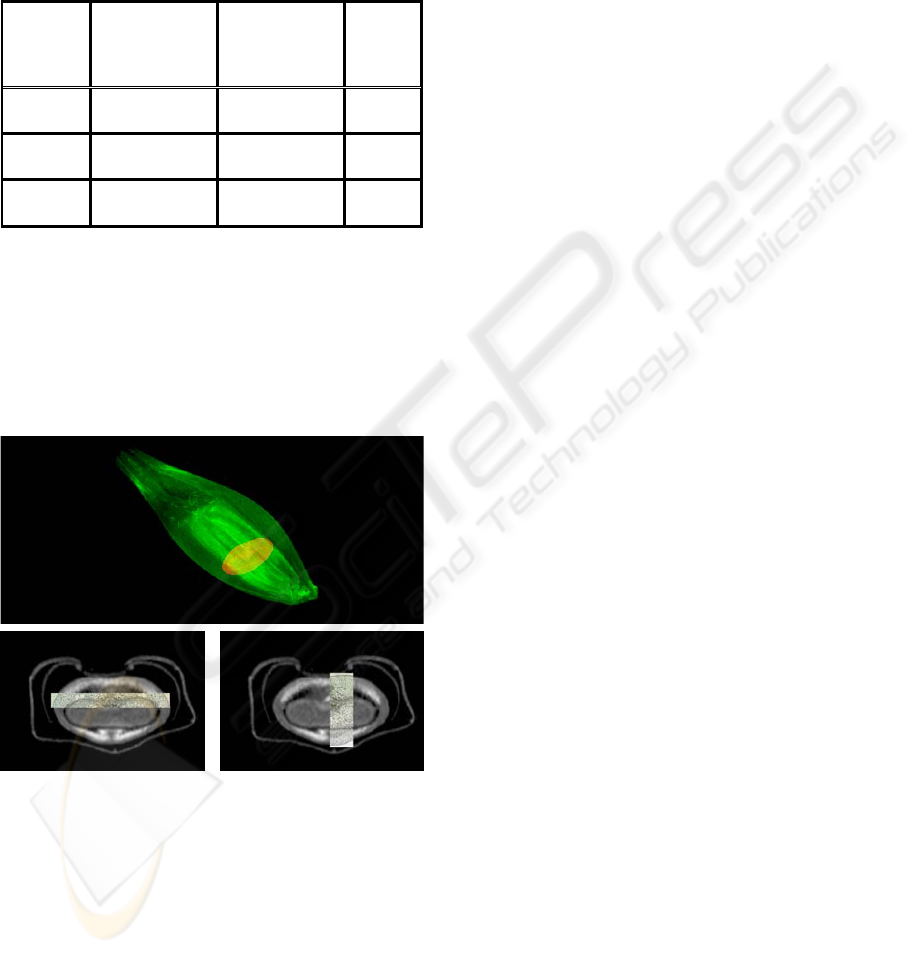
Fig. 2 shows the results after application of NMI
as similarity function on gradient images (x=10
pixel, y=-7 pixel, z=slice 170 and α=0°). The
position of the aligned cross-section (in red) is
shown in Fig. 2a. Overlays of the aligned cross-
section with the corresponding slice of the NMR
dataset (slice 170) are depicted in Fig. 2b and c.
Figure 2: (a) shows a volume rendering of the NMR
dataset (green) together with the aligned cross-section
(red) after application of NMI on gradient images.
Overlays of the NMR-slice 170 with the cross-section are
shown in (b) and (c).
4 CONCLUSIONS
In this paper, we investigated different approaches
for rigid multimodal alignment of 3D NMR image
datasets and 2D histological cross-sections. The
NMR dataset served as spatial framework and the
histological cross-section was automatically aligned
at an optimal position within this 3D dataset. The
results were compared to a manually defined gold-
standard. Best results were achieved by application
of normalized mutual information to gradient
images. This finding corresponds to results of other
authors (Butz and Thiran, 2001; Haber and
Modersitzki, 2004), but is shown here for the first
time for non-medical images.
Simple parallelization of the algorithms for the
CBE processor in a Playstation 3 leads to a speed up
factor about 2, compared to a standard CPU.
REFERENCES
Butz, T., Thiran, J.-P., 2001. Affine registration with
feature space mutual information. In Proceedings of
the 4th International Conference on Medical Image
Computing and Computer-Assisted Intervention
(MICCAI’ 01). 2208:549-556
Haber, E., Modersitzki, J., 2004. Intensity gradient based
registration and fusion of multi-modal images. In
Technical Reports TR-2004-027-A 2004. Department
of Mathematics and Computer Science, Emory
University, Atlanta, GA
Maes, F., Vandermeulen, D., Suetens, P., 2003. Medical
image registration using mutual information. In
Proceedings of the IEEE. 91(10):1699-1721
Maintz, J.B.A., van den Elsen, P.A., Viergever, M.A.,
1996. Comparison of edge-based and ridge-based
registration of CT and MR brain images. Medical
Image Analysis. 1(2):151-161
Pluim, J.P.W., Maintz, J.B.A., Viergever, M.A., 2000.
Image registration by maximization of combined
mutual information and gradient information. IEEE
Transaction on Medical Imaging. 19(8):809-814
Pluim, J.P.W., Maintz, J.B.A., Viergever, M.A., 2003.
Mutual information based registration of medical
images: a survey. IEEE Transactions on Medical
Imaging. 22:986-1004
Thévenanz, P., Unser M., 2000. Optimization of mutual
information for multiresolution image registration.
IEEE Transactions on Image Processing. 9(12):2083-
2099
Van den Elsen, P.A., Pol, E.J.D., Sumanaweera, T.S.,
Hemler, P., Napel, S., Adler, J., 1994. Grey value
correlation techniques used for automatic matching of
CT and MR brain and spine images. Visualization in
Biomedical Computing. Vol. 2359 of Proceedings
SPIE, SPIE Press, Bellingham, WA, pp. 227-237
a)
b) c)
VISAPP 2009 - International Conference on Computer Vision Theory and Applications
244
