
TOWARDS COMPUTER ASSISTED CARDIAC CATHETERIZATION
How 3D Visualization Supports It
Klaus Drechsler, Cristina Oyarzun Laura
Department of Cognitive Computing & Medical Imaging
Fraunhofer Institute for Computer Graphics Research, Darmstadt, Germany
Georgios Sakas
Interactive Graphics Systems Group (GRIS), Darmstadt University of Technology, Germany
Keywords:
Cardiology, Catheterization, 3D Visualization, Segmentation, Vessel analysis, 3D-2D registration.
Abstract:
Although cardiac catheterization procedures take place under x-ray guidance, the doctor is almost blind. Ves-
sels are almost invisible until he injects a contrast agent and looking only at 2D x-ray images and reconstructing
a 3D image in his head makes it error prone and tedious. Only experienced doctors are able to accomplish
this procedure with the expected results. This paper describes our preliminary work and work in progress to
support doctors during cardiac catheterizations using 3D visualization.
1 INTRODUCTION
In cardiac catheterization procedures the doctor in-
serts a catheter into a vessel and positions it under
x-ray guidance within the coronary arteries to inject
a contrast agent, place a stent or a balloon to widen
the vessel. The contrast agent helps him to make
the coronary arteries and their potential pathologies
(stenosis, calcifications) visible. Although the proce-
dure takes place under x-ray guidance the doctor is
almost blind. The vessels are almost invisible until he
injects the contrast agent and looking only at 2D x-ray
images and reconstructing a 3D image in real-time in
his head makes it error prone and tedious. Only doc-
tors with many years of experience are able to accom-
plish this procedure with the expected results. During
a catheterization a doctor with less years of experi-
ence can need computer assistance before he injects
the contrast agent to navigate the catheter in 3D to the
destination and after he injected the contrast agent to
see the arteries in 3D.
The gold standard for detecting stenosis and
plaques so far is an invasive cardiac catheterization to
inject a contrast agent and inspect the gathered x-ray
images, called coronary angiography. We assume that
in the near future the diagnostic of the vessels will be
done using non-invasive computer tomography (CT)
and that only the intervention, if necessary, will be
done in a catheter laboratory. This assumption is not
unrealistic. A steadily increasing number of hospi-
tals are already using CT for diagnostic purposes and
papers successfully investigating CT for this use case
were published (e.g. (Hoffmann et al., 2005), (Mieres
et al., 2007)). A combination of preoperatively gath-
ered CT data and operatively gathered x-ray images
(so called coronary angiograms) will further enhance
the trust in CT for the assessment of the coronary ar-
teries.
Our goal is to develop a sophisticated system that
provides doctors preoperatively an automated quanti-
tative analysis of the coronary arteries using CT data
whose result (the found pathologies) can be directly
displayed in the x-ray images gathered during the in-
tervention. Furthermore we want to provide naviga-
tion support by displaying the position of the catheter
in a 3D visualization of the heart (respectively the
coronary arteries). In a second step the system could
be extended to a complete training system for resi-
dents and doctors-in-training.
In this paper we present our preliminary work and
work in progress to support doctors during cardiac
catheterizations using a 3D heart of the patient. We
use an algorithm based on raytracing in 2D space
(thus on a slice by slice basis) to extract the heart from
a CT image which is acquired before the catheteri-
zation procedure takes place. A tracking based ves-
sel segmentation algorithm is used to visualize the
coronary arteries and to provide an automated quan-
159
Drechsler K., Oyarzun Laura C. and Sakas G. (2009).
TOWARDS COMPUTER ASSISTED CARDIAC CATHETERIZATION - How 3D Visualization Supports It.
In Proceedings of the First International Conference on Computer Imaging Theory and Applications, pages 159-165
DOI: 10.5220/0001771801590165
Copyright
c
SciTePress

titative analysis of the vessels. This allows us to
show pathologies to the doctor before and during the
catheterization. A further processing takes place to
generate a 2D view of the 3D heart similar to a coro-
nary angiogram which is needed for a 2D-3D regis-
tration of the two modalities. As a result our system
will support the doctor during the catheterization pro-
cedure by visualizing a 3D heart that corresponds to
the coronary angiogram. In addition we want to dis-
play the current catheter position in the 3D visualiza-
tion by using a magnetic tracking system. This will
help especially doctors with less experience to safely
perform a cardiac catheterization.
The remainder of this paper is organized as fol-
lows. The next section gives an overview of related
work. The following section describes our prelimi-
nary work and explains what we are currently doing.
After that we conclude our paper with a critically dis-
cussion of our system.
2 RELATED WORK
In this section we give an overview of registration,
heart extraction and coronary artery segmentation
techniques.
2.1 Registration
When developing applications that combine and use
information gathered from different modalities, regis-
tration plays an important role. The goal of the sys-
tem described in (Filippatos, 2006) is to use Com-
puter Assisted Surgery to support the implantation of
a stent in the case of aortic aneurysms. They use a
fiducial based registration to match the 3D CT vol-
ume to the intraoperative x-ray image. For that they
adhere external markers on the chest. Then the mark-
ers are detected both in the 3D CT volume and in the
2D image using image thresholding, region growing
and contour detection techniques. Finally they get the
transformation matrix that matches the obtained 3D
points with the corresponding 2D x-ray points and
use it to initialize the 3D volume in an adequate po-
sition. For the determination of the position of the
stent they need to segment the Aorta. To achieve this
they use a canny edge detector. After that they obtain
the centerline of the segmented aorta and use back
projection of the 2D points into the 3D volume. Tak-
ing into account that the Stent will always be in the
aorta they get the searched position. The work pre-
sented in (Turgeon et al., 2005) deals with similarity-
based 2D-3D registration of coronary angiograms. It
is worth mentioning that the comparison for the regis-
tration is made between binary images instead of gray
scale images. In a first step a 4D model of the heart
is obtained to create a simulation environment com-
posed of realistic 2D and 3D images. They are using
3D computed rotational angiography comprising sep-
arate left and right coronary arteries (LCA, RCA) an-
imated with cine-angiograms to create the simulation
environment. The 3D coronary tree of the 3D volume
is semi-manually segmented from one time frame of
the 4D model. Once this is done the intraoperative
angiograms (DRR) are generated from both the LCA
and RCA 4D model. They are further processed us-
ing multiscale segmentation and then merged to get
a binary image. To carry out the registration, the bi-
nary projection of the extracted coronary tree is com-
pared with two binary angiographies by means of the
entropy correlation coefficient. Finally, the downhill
simplex method is used for the optimization of the
translation and rotation parameters that will be ap-
plied to the 3D volume. In (Lau and Chung, 2006)
the authors study how to avoid the problem of local
minimas that occurs in high-dimensional image regis-
tration. They use the vessels centerline as feature for
a feature based registration. For the segmentation of
the vessels they use a global thresholding method to
obtain a skeleton and represent it by a set of spheres
with the centers set to the coordinates of the skele-
ton points and radii equal to their distance transform
values which represents the distance to the closest
boundary. After creating a DRR (Digitally Recon-
structed Radiograph) of the 3D volume, the sum of
squared differences is used to get the transformation
matrix necessary to carry out the registration. The op-
timization method consist of calculating the result of
the cost function in a low resolution environment, op-
timizing it with Powells method, and doing a final op-
timization with the best obtained transformation ma-
trix in the high resolution environment.
2.2 Heart Extraction
Cardiac CT data normally contains non-cardiac struc-
tures such as ribs, lungs or the sternum. These struc-
tures obscure the view to the heart, but an isolated
heart is necessary to make a visualization of the coro-
nary arteries on the surface of the heart possible. The
authors of (Lorenz et al., 2004) developed a method
to extract the heart from Computed Tomography An-
giography (CTA) datasets using active contours. They
locate the chest and the descending aorta in all slices
of the CT data in order to roughly estimate the lo-
cation of the heart. Afterwards they use active con-
tours to outline the border of the heart in a slice-by-
slice manner. In (Funka-Lea et al., 2006) the authors
IMAGAPP 2009 - International Conference on Imaging Theory and Applications
160
isolate the heart from CTA scans using graph-cuts
(Boykov and Jolly, 2001). First they automatically de-
termine a seed-region within the heart by computing
the volumetric barycenter weighted by intensity. In a
second step they do some kind of pre-segmentation by
determining the ellipsoid of maximum volume con-
tained within the heart. The ellipsoid is used as initial-
ization for the graph-cut algorithm. To prevent leak-
ing into the aorta or pulmonary vessels the authors
introduce a what they call ‘blob’-constraint to prefer
a shape whose edges are oriented perpendicular to the
direction toward the center of the seed region.
2.3 Coronary Artery Segmentation
The segmentation of the coronary tree is a necessary
step before an advanced quantitative analysis can take
place. Several vessel segmentation algorithms have
been developed in the past. A very comprehensive
overview can be found in (Kirbas and Quek, 2004).
It follows a description of three of the more recent
work in this field. In (Hennemuth et al., 2005) the
authors developed a method to segment the coronary
tree in CTA datasets with one user-defined point in
the middle of the aorta. Starting with this point, the
authors segment and mask the aorta by using a semi-
3D region growing combined with a moment-based
shape analysis to fit an ellipse into the segmented re-
gion. The algorithm continues to examine connected
voxel clusters around the aorta and starts a 3D re-
gion growing from those clusters which contain ori-
gins of coronary arteries. The origin of a coronary
artery is detected by considering size, the center of
gravity, the eccentricity and the orientation. Branches
that are not automatically segmented by this algo-
rithm can be manually added by interactively placing
additional seed points. The authors of (Florin et al.,
2005) propose a particle-based approach to segment
the coronary arteries. They generate hypothesis (state
vectors or particles) of a vessel being at a certain lo-
cation, having certain orientation, referring to a cer-
tain shape with certain irregular appearance charac-
teristics. For the latter they use a Gaussian mixture
model that consists of two components to model the
contrast enhanced blood and high density components
like calcifications or stents. Given a starting point and
a number of particles one performs random perturba-
tions and the corresponding particles are visually and
statistically evaluated. A segmentation is a weighted
linear combination of the particles. In (Luengo-Oroz
et al., 2007) an algorithm based on morphological
grayscale reconstruction is presented to segment the
coronary tree in CTA datasets. First, the user has to
provide an initial point as a marker in which slice the
artery is first found. Then their proposed algorithm is
performed from the mark in that slice to segment the
artery in it. The algorithm performs a reconstruction
by dilation followed by a top-hat opening by recon-
struction to extract only the bright areas of tubular-
like structures. Afterwards a set of potential marks is
automatically generated for the following slice. The
authors use pre-knowledge from the characteristics of
tubular structures to generate new marks for the next
slice by searching an area of higher probability ob-
tained from the segmentation of the previous slice.
These steps are repeated for subsequent slices until
there are no more potential marks.
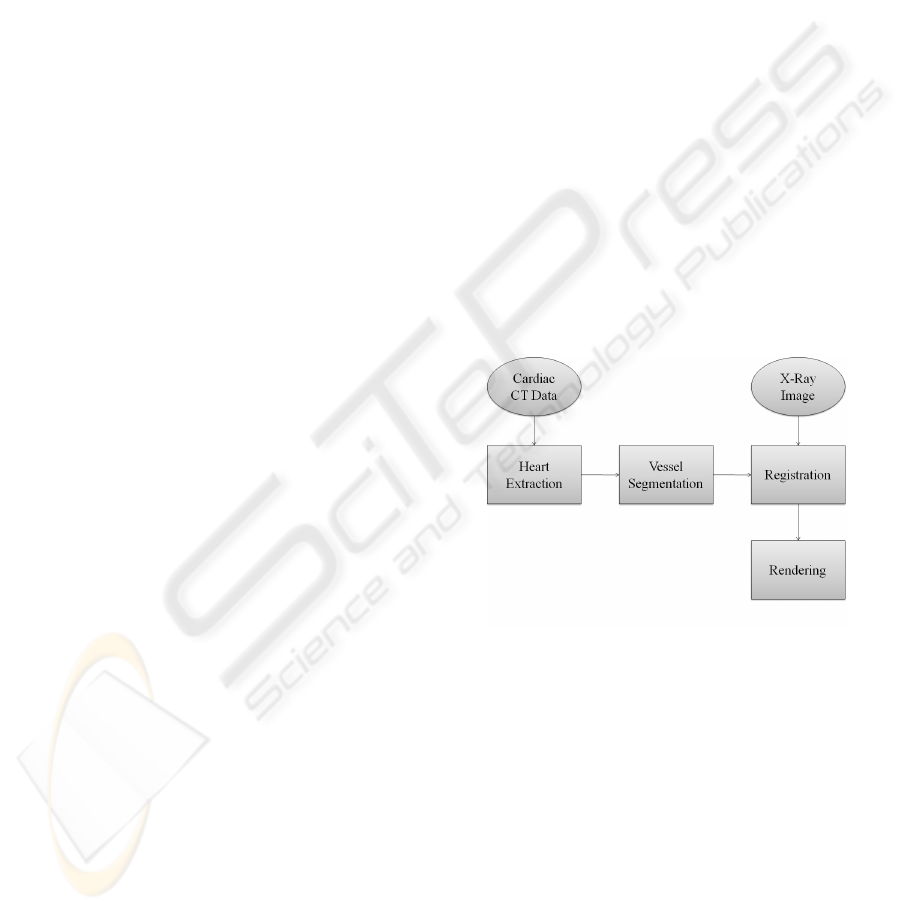
3 GENERAL ARCHITECTURE
The general architecture of our system is shown in fig-
ure 1. All blocks were implemented at our department
using VTK and ITK and recently adopted to make use
of MITK (Wolf et al., 2005) which provides conve-
nient methods to add user interaction to medical ap-
plications. The registration is currently under active
development.
Figure 1: General architecture.
3.1 Heart Extraction
The automatic extraction of the heart from contrast
agent enhanced CT data is described in (Jaehne et al.,
2008). Basically a partition (labels) of the anatom-
ical structures by automatically selecting thresholds
using Otsus method (Otsu, 1979) is obtained. Then
the center of gravity of the two brightest gray levels,
which lies in the middle of the heart, is calculated for
every axial slice. From this point a radial search ray
pattern is send out in order to find the outer bound-
ary of the heart. Overlapping structures like the aorta
or the sternum prevent this method to function prop-
erly; the search rays are to long. These parts are han-
dled in a subsequent step. On each side of the aorta
TOWARDS COMPUTER ASSISTED CARDIAC CATHETERIZATION - How 3D Visualization Supports It
161
and the sternum the last rays which hit on lung tis-
sue and therefore have the correct length are automat-
ically detected. Interpolation is then used to correct
the rays between them. Afterwards the end points are
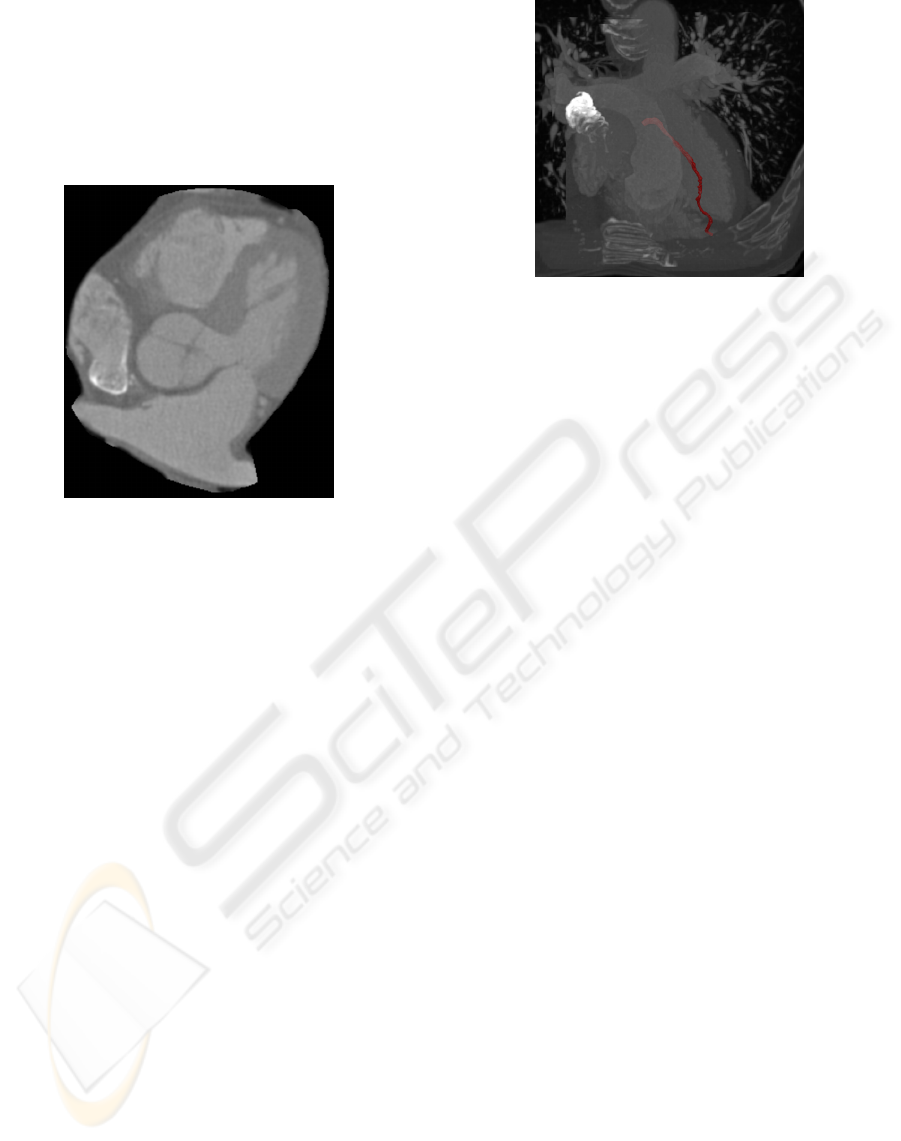
connected and a binary mask is generated which is ap-
plied to the original CT data to extract the heart. The
result is shown in figure 2.
Figure 2: Axial view of the extracted heart.
3.2 Coronary Artery Segmentation
The result of the heart extraction is used to seg-
ment the coronary arteries using the tracking based
corkscrew algorithm, which is described in greater de-
tail in (Wesarg and Firle, 2004). Basically it prepro-
cesses the data by using an adaptive threshold filter
that takes the gray values of three user provided seed
points (start, direction and end point) and the CT data
as inputs. It takes into account that the contrast agent
is not equally distributed in the vessel. It follows an
opening operation to remove connections to neighbor-
ing tissues and to the vessel wall behind hard plaques.
The actual corkscrew algorithm gets the results of the
opening operation, the original image and the output
of the adaptive threshold filter to calculate a path (cen-
terline and border) between a start and end point that
lies within the vessel. Afterwards a 3D model is gen-
erated using the marching cubes algorithm (Lorensen
and Cline, 1987). A three dimensional rendering of
the heart with one segmented branch of the coronary
artery is shown shown in figure 3.
The output of the corkscrew algorithm was suc-
cessfully used to implement an automated quantita-
tive analysis of the segmented vessel (Wesarg et al.,
2006) and evaluated its result in a clinical study (Khan
et al., 2006), (Wesarg et al., 2008).
Figure 3: A maximum intensitiy projection (MIP) of the
heart with one segmented branch of the coronary artery in
red.
3.3 Registration
There are mainly two possibilities how a computer
can assist a doctor during a cardiac catheterization,
namely before and after the injection of a contrast
agent. Before the contrast agent is injected, the
catheters position could be located and together with
the preoperatively found pathologies visualized in a
3D model of the heart. Therefore a registration of
the live x-ray with the CT data based on external
(e.g. fiducials) or internal (e.g. bones) markers is
necessary. After the contrast agent is injected, a 3D
model of the heart could be displayed (again together
with the preoperatively found pathologies) such that
it shows the heart from the position that x-ray gener-
ator looks at it. Therefore either a 2D-3D registration
using a 2D projection of the CT data or a 3D-3D regis-
tration using a 3D reconstruction of several 2D x-ray
images is necessary. Our current work concentrates
on the 2D-3D registration after the contrast agent has
been injected. Therefore we are currently implement-
ing a semi-automatic registration algorithm where the
doctor has to provide initially 2n equivalent points in
the first generated 2D projection of the heart and the
coronary angiogram. These points are tracked during
the successive rotation of the 3D heart and genera-
tion of 2D projections to carry out an automatic point
based registration of the two modalities. To track the
selected points a method to project them back from
2D to 3D has to be realized. Our idea restricts the
potential coronary artery segmentation algorithms to
those which also provide the centerlines of the seg-
mented vessels. We create a 2D projection of the 3D
centerlines (this projection is called in the following
’2DC’) in addition to the normal 2D projection. If the
user clicks on a vessel in the 2D projection to mark
a point, it is aligned to match the underlying 2DC.
This information can then be used to find the corre-
IMAGAPP 2009 - International Conference on Imaging Theory and Applications
162
sponding point(s) on the 3D centerline and thus in the
segmented vessel. To achieve this we store with ev-
ery pixel in the 2DC the coordinate(s) of its corre-
sponding 3D voxel(s) during the projection. A prob-
lem might arise if the user selects a point in the 2D
projection which represents overlapping vessels. In
this case it is not clear to which 3D centerline the se-
lected point belongs to. This situation is detected by
the fact that there are more then one 3D coordinates
stored together with the 2DC and used to inform the
user. We could also make use of the fact that the doc-
tor does not inject the contrast agent within both main
branches at the same time and thus ’turn off’ the cor-
responding 3D centerlines while calculating the bi-
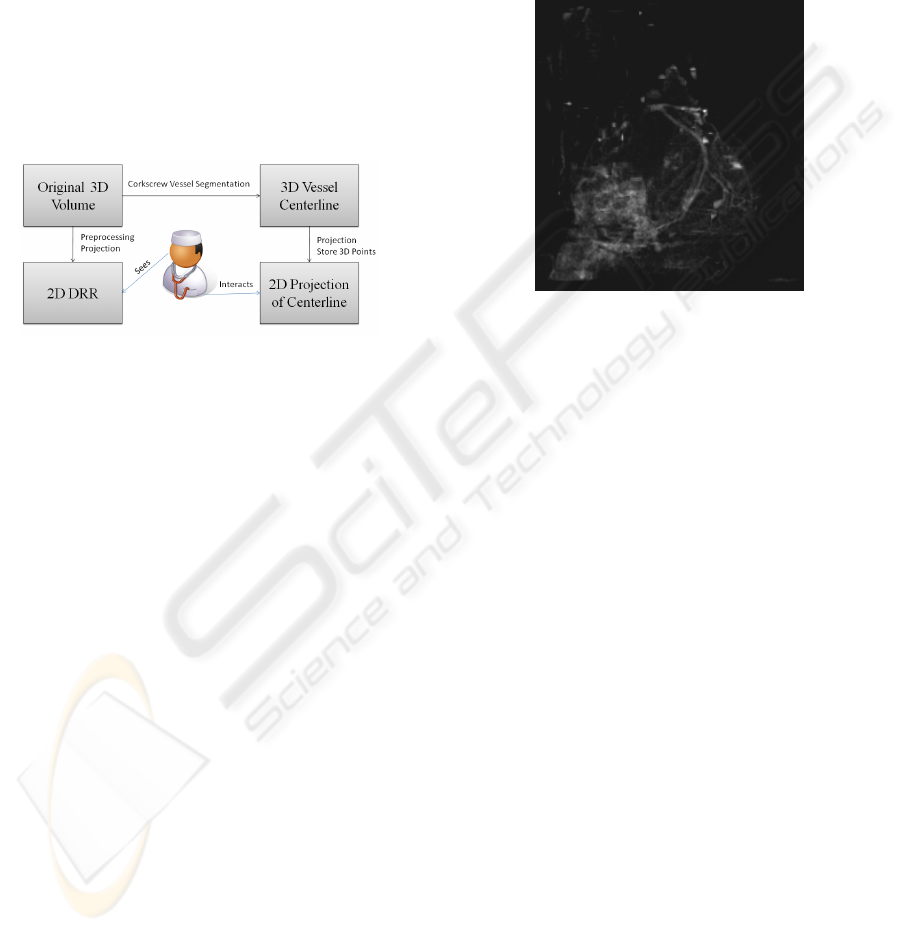
nary projection.
Figure 4: General architecture.
In (Langs et al., 2004) the authors describe a simi-
lar registration method. In their registration approach
the user has to mark corresponding points in the 3D
model and the 2D x-ray image. However, if a doctor
has to select a point in 3D and a corresponding point
in 2D then he has either to reconstruct a 3D image
from the 2D x-ray or a 2D image from the 3D model
in his head to decide which points correspond. This
is what we would like to avoid and make this step as
easy as possible.
3.4 DRR Generation
In (Lacalli et al., 2008) the generation of 2D projec-
tions of the heart using DRRs is described. First a
preprocessing of the original CT data is necessary to
avoid insufficient results due to non-cardiac structures
and large cardiac cavities (e.g. ventricles and atria).
The removal of non-cardiac structures has been de-
scribed above. The cavities are a problem, because
they are, like the coronary arteries, filled with the con-
trast agent and thus occlude the coronary arteries in
the generated DRRs. To remove the cavities from
the extracted heart a thresholding operation on the la-
beled CT data (that was generated in the heart extrac-
tion step) is first applied to remove everything but the
highest label that correlates with both the cavities and
the arteries. Afterwards the coronary arteries are re-
moved by applying an erosion operation followed by
a neighborhood filter along all the three orthogonal
axes. Finally a dilation operation is applied to restore
the original size of the cavities. The result is used as a
mask to remove the cavities from the extracted heart.
A perspective projection is then carried out to gener-
ate the DRR to simulate a coronary angiogram. The
result is shown in fig 5.
Figure 5: Digital Reconstructed Radiography of the heart.
The vessels are clearly visible.
4 CONCLUSIONS
AND DISCUSSION
This paper presented our preliminary work and
work in progress to support cardiac catheterizations
through 3D visualization. We described the build-
ing blocks of our proposed system and explained their
function. Though the heart extraction algorithm pro-
vides good results, it has some flaws which can be
traced back to the way it works. It only uses ax-
ial slices to process the volume. While the heart is
fairly well extracted in the axial orientation, it still
needs some improvements for the other orientations.
6 shows the coronal view of the extracted heart. At
the bottom it can clearly be seen, that structures are
shown that do not belong to the heart.
Currently we are investigating an approach based
on deformable models to extract the heart from a CT
volume. Initial results are promising and are subject
for further publication. The corkscrew algorithm al-
ready proved its usefulness and robustness in a clin-
ical setup. However, currently it is only able to seg-
ment one branch of a vessel tree. It is not able to
detect bifurcations and automatically follow them in
order to segment the complete coronary tree. The
setting of three seed points is sufficient to segment
one branch of the tree, but very tedious and time-
consuming if done for the whole tree. Recently we
started to investigate the possibilities to enhance the
corkscrew algorithm to automatically detect bifurca-
TOWARDS COMPUTER ASSISTED CARDIAC CATHETERIZATION - How 3D Visualization Supports It
163
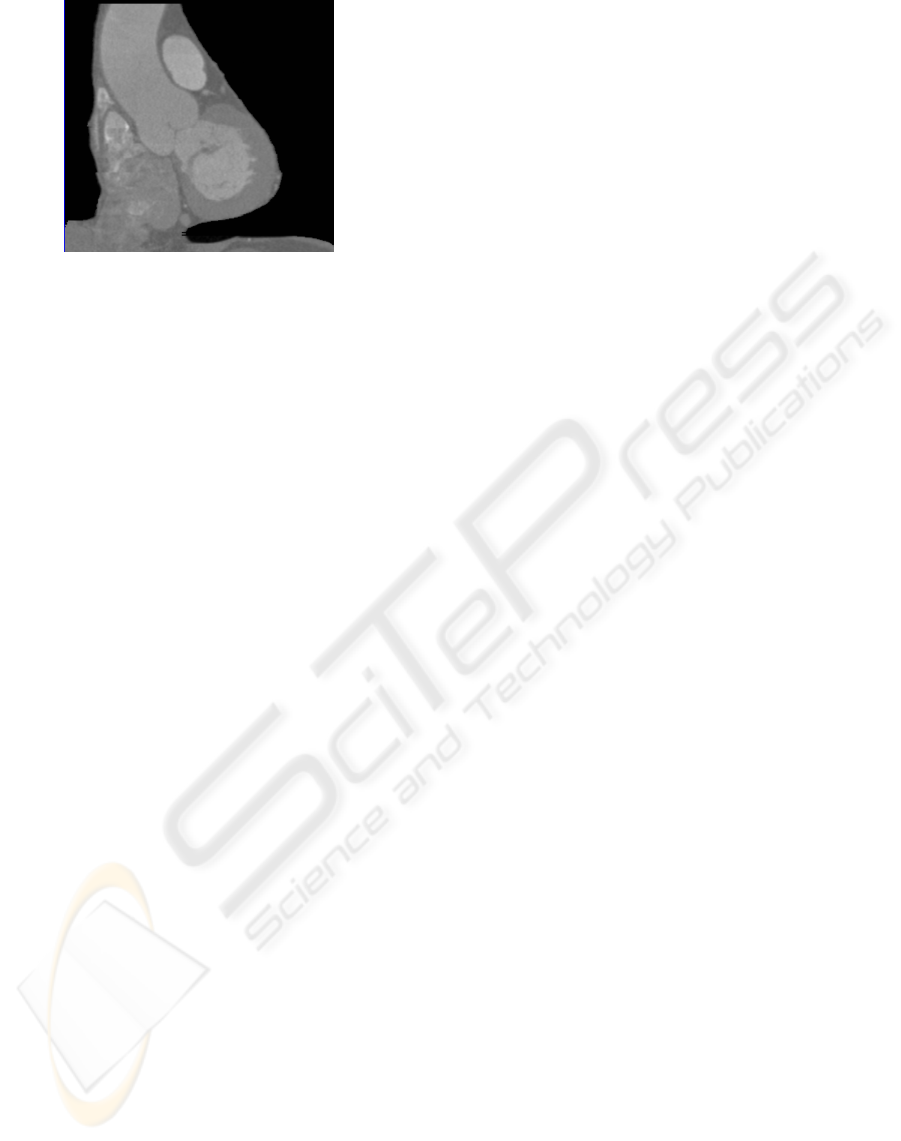
Figure 6: Coronal view of the extracted heart.
tions. Furthermore our goal is to minimize user in-
teraction. Ideally the user only has to provide one
start point to segment the whole coronary tree. Direc-
tion and end point should be automatically detected
by taking anatomical knowledge of the heart into ac-
count. Another problem we found with the current
implementation of the corkscrew algorithm is that the
results slightly differ when the seed points are not set
at exactly the same coordinates. The reason for this
behavior has to be further investigated, but an auto-
mated seed point correction should take place to en-
sure reproducible results. An approach to align the
specified seed points towards the vessel center is de-
scribed in (Egger et al., 2007). Rays are sent out ra-
dially from the seed point with a user defined length.
From the intersections with the vessel walls the direc-
tion to align the seed points can be computed.
REFERENCES
Boykov, Y. Y. and Jolly, M. P. (2001). Interactive graph
cuts for optimal boundary & region segmentation of
objects in n-d images. In ICCV 2001. Proceedings.
Eighth IEEE International Conference on Computer
Vision. Proceedings., volume 1, pages 105–112 vol.1.
Egger, J., Mostarkic, Z., Grosskopf, S., and Freisleben,
B. (2007). A fast vessel centerline extraction algo-
rithm for catheter simulation. In CBMS ’07: Proceed-
ings of the Twentieth IEEE International Symposium
on Computer-Based Medical Systems, pages 177–182,
Washington, DC, USA. IEEE Computer Society.
Filippatos, K. (2006). A navigation tool for the endovas-
cular treatment of aortic aneurysms - computer aided
implantation of a stent graft. Master’s thesis, Techni-
cal University of Munich.
Florin, C., Paragios, N., and Williams, J. (2005). Particle
filters, a quasi-monte carlo solution for segmentation
of coronaries. In Duncan, J. S. and Gerig, G., editors,
MICCAI: Medical Image Computing and Computer-
Assisted Intervention, volume 3749 of Lecture Notes
in Computer Science, pages 246–253. Springer.
Funka-Lea, G., Boykov, Y., Florin, C., Jolly, M.-P., Moreau-
Gobard, R., Ramaraj, R., and Rinck, D. (2006). Auto-
matic heart isolation for ct coronary visualization us-
ing graph-cuts. In ISBI, pages 614–617. IEEE.
Hennemuth, A., Bock, S., Boskamp, T., Peitgen, H.-O.,
Fritz, D., Rinck, D., and Scheuering, M. (2005). One-
click coronary tree segmentation in ct angiographic
images. In Proceedings of CARS 2005.
Hoffmann, M. H. K., Shi, H., Schmitz, B. L., Schmid,
F. T., Lieberknecht, M., Schulze, R., Ludwig, B.,
Kroschel, U., Jahnke, N., Haerer, W., Brambs, H.-
J., and Aschoff, A. J. (2005). Noninvasive coronary
angiography with multislice computed tomography.
JAMA: Journal of the American Medical Association,
293(20):2471–2478.
Jaehne, M., Lacalli, C., and Wesarg, S. (2008). Novel
techniques for automatically enhanced visualization
of coronary arteries in msct data and for drawing di-
rect comparisons to conventional angiography. In
VISIGRAPP 2008: International Joint Conference on
Computer Vision and Computer Graphics Theory and
Applications. Proceedings. CD-ROM., pages S.290–
296. INSTICC Press.
Khan, M., Wesarg, S., Gurung, J., Dogan, S., Maataoui, A.,
Brehmer, B., Herzog, C., Ackermann, H., Assmus, B.,
and Vogl, T. (2006). Facilitating coronary artery eval-
uation in mdct using a 3d automatic vessel segmenta-
tion tool. European Radiology, 16(8):1789–1795.
Kirbas, C. and Quek, F. K. H. (2004). A review of vessel ex-
traction techniques and algorithms. ACM Computing
Surveys, 36:81–121.
Lacalli, C., Jaehne, M., and Wesarg, S. (2008). Automa-
tisierte verfahren zur verbesserten visualisierung der
koronararterien in msct-daten und fuer die direkte ver-
gleichbarkeit zur angiographie. In Bildverarbeitung
fuer die Medizin 2008: Algorithmen - Systeme - An-
wendungen, pages 283–287.
Langs, G., Radeva, P., Rotger, D., and Carreras, F. (2004).
Building and registering parameterized 3d models of
vessel trees for visualization during intervention. In
ICPR ’04: Proceedings of the Pattern Recognition,
17th International Conference on (ICPR’04) Volume
3, pages 726–729, Washington, DC, USA. IEEE Com-
puter Society.
Lau, K. and Chung, A. (2006). A global optimization
strategy for 3d-2d registration of vascular images. In
BMVC06, volume 2, page 489ff.
Lorensen, W. E. and Cline, H. E. (1987). Marching cubes:
A high resolution 3d surface construction algorithm.
SIGGRAPH Comput. Graph., 21(4):163–169.
Lorenz, C., Lessick, J., Lavi, G., Bulow, T., and Renisch,
S. (2004). Fast automatic delineation of cardiac vol-
ume of interest in msct images. In Sonka, J. M. F. M.,
editor, Medical Imaging 2004: Image Processing, vol-
ume 5370, pages 456–466.
Luengo-Oroz, M. A., Ledesma-Carbayo, M. J., G
´
omez-
Diego, J. J., Garc
´
ıa-Fernandez, M. A., Desco, M., and
Santos, A. (2007). Morphological tubular extraction
applied to coronary artery reconstruction in ct-images.
In BIEN ’07: Proceedings of the fifth IASTED Inter-
national Conference, pages 391–395, Anaheim, CA,
USA. ACTA Press.
IMAGAPP 2009 - International Conference on Imaging Theory and Applications
164

Mieres, J. H., Makaryus, A. N., Redberg, R. F., and Shaw,
L. J. (2007). Noninvasive cardiac imaging. AFP:
American Family Physicians, 75(8):1219–1228.
Otsu, N. (1979). A threshold selection method from gray-
level histograms. IEEE Transactions on Systems, Man
and Cybernetics, 9(1):62–66.
Turgeon, G.-A., Lehmann, G., Guiraudon, G., Drangova,
M., Holdsworth, D., and Peters, T. (2005). 2d-3d
registration of coronary angiograms for cardiac pro-
cedure planning and guidance. Medical Physics,
32(12):3737–3749.
Wesarg, S. and Firle, E. A. (2004). Segmentation of vessels:
The corkscrew algorithm. In Medical imaging 2004:
Image processing., volume 5370, pages 1609–1620.
Wesarg, S., Khan, M., Jaehne, M., and Lacalli, C. (2008).
Automatisierte analyse der koronararterien basierend
auf msct-daten. Deutsche Zeitschrift fuer klinische
Forschung, 11(3/4):28–33.
Wesarg, S., Khan, M. F., and Firle, E. (2006). Localizing
calcifications in cardiac ct data sets using a new vessel
segmentation approach. Journal of Digital Imaging,
19:249–257.
Wolf, I., Vetter, M., Wegner, I., Bottger, T., Nolden, M.,
Schobinger, M., Hastenteufel, M., Kunert, T., and
Meinzer, H.-P. (2005). The medical imaging interac-
tion toolkit. Medical Image Analysis, 9(6):594–604.
TOWARDS COMPUTER ASSISTED CARDIAC CATHETERIZATION - How 3D Visualization Supports It
165
