
PRE-FIGHT DETECTION
Classification of Fighting Situations using Hierarchical AdaBoost
Scott J. Blunsden
School of Computing, University of Dundee, Dundee, U.K.
Robert B. Fisher
IPAB, School of Informatics, University of Edinburgh, Edinburgh, U.K.
Keywords:
Fight, Pre-fight, Cuboid, AdaBoost.
Abstract:
This paper investigates the detection and classification of fighting and pre and post fighting events when viewed
from a video camera. Specifically we investigate normal, pre, post and actual fighting sequences and classify
them. A hierarchical AdaBoost classifier is described and results using this approach are presented. We show
it is possible to classify pre-fighting situations using such an approach and demonstrate how it can be used in
the general case of continuous sequences.
1 INTRODUCTION
This paper investigates pre-fighting situations as
viewed from a video camera within a surveillance do-
main. The main aim is to establish the feasibility of
detecting fighting situations. Additionally we are also
interested in investigating the possibility of detecting
and classifying pre and post-fighting situations. Pre-
fighting is useful in surveillance situations where the
timely intervention of a CCTV operator could avoid a
potentially criminal situation and thus prevent an es-
calation of violence.
Within this paper we make use of Dollar et al’s
(Dollar et al., 2005) spatio-temporal features to con-
struct a sequence representation. A hierarchical ver-
sion of AdaBoost is then used to classify the se-
quences. We demonstrate a classifier which gives
classification performance of 95% when classifying
fighting vs non fighting situations on the BEHAVE
dataset.
2 PREVIOUS WORK
Human ability to predict dangerous or criminal ac-
tivities from CCTV has previously been investigated
by Troscianko et al. (Troscianko et al., 2004). In
their work participants from either an expert or a non-
expert group were shown videos from CCTV cam-
eras. At a particular point in time the video was
paused and the participants were asked to predict on a
scale of 1 to 5 if they thought a dangerous act would
be committed by an individual or individuals in the
video. Human performance classified 80% of crimi-
nal incidents correctly with 65% of normal but similar
incidents matched correctly. Dee and Hogg (Dee and
Hogg, 2004) also investigate human performance us-
ing a computational model and found correlations in
the rating of ’interestingness’.
The most similar work to ours is that of Datta et
al. (Datta et al., 2002) who detect person on per-
son violence using a range of measures derived from
a background removed and segmented representation
of the person. The measures include acceleration and
jerk along with the leg and arm orientations. All are
computed from a side on point of view and results
indicate good performance on their dataset of 62 situ-
ations with a correct classification of 97%.
Cupillard et al. (Cupillard et al., 2002) also inves-
tigate fighting situations within the domain of Metro
surveillance. They use pre-defined templates of ac-
tivity to match the on screen activity and classify the
image sequence.
Ribeiro et al. (Ribeiro and Santos-Victor, 2005)
also attempt to classify what a person is doing within
the CAVIAR dataset using a hierarchical feature se-
lection method. Others such as Davis and Bobick
(Davis and Bobick, 2001) used moments based upon
303
J. Blunsden S. and B. Fisher R.
PRE-FIGHT DETECTION - Classification of Fighting Situations using Hierarchical AdaBoost.
DOI: 10.5220/0001775903030308
In Proceedings of the Fourth International Conference on Computer Vision Theory and Applications (VISIGRAPP 2009), page
ISBN: 978-989-8111-69-2
Copyright
c
2009 by SCITEPRESS – Science and Technology Publications, Lda. All rights reserved
a stabilised silhouette image to classify more general
motion. Efros et al. (Efros et al., 2003) used a opti-
cal flow based similarity measure to match different
persons actions.
3 FEATURES
We make use of Dollar et al.’s (Dollar et al., 2005) ap-
proach to sequence representation as it has been pre-
viously successful (Niebles et al., 2006; Dollar et al.,
2005), can deal with occlusions. Background sub-
traction was not used as it gave inconsistent results
on these sequences. The method is briefly reviewed
here.
Dollar et al. (Dollar et al., 2005) developed a
spatio-temporal response function for classifying se-
quences of behaviours. Their approach assumes a sta-
tionary camera (or that the effects of camera motion
can be compensated for). The response function is
given in equation (1).
R = (I ⊗ g ⊗h
ev
)
2
+ (I ⊗ g ⊗ h
od
)
2
(1)
The 2D smoothing Gaussian function g(x,y, σ)
is applied only along the spatial dimensions of the
image sequence I. The two functions h
ev
and
h
od
are a pair of Gabor filters which are defined
as h
ev
(t; τ,ω) = −cos(2πtω)e
−t/τ
2
and h
od
(t; τ,ω) =
−sin(2πtω)e
−t
2
/τ
2
. They are applied along the tem-
poral dimensions of the image sequence. Throughout
all experiments we set ω = 4/τ. This gives the re-
sponse function two parameters corresponding to the
spatial scale (σ) and the temporal scale (τ). They were
set to (τ = 3,σ = 3) throughout all experiments. This
follows on from work by Dollar (Dollar et al., 2005)
and separately Niebles et al. (Niebles et al., 2006)
who found that the 3 × 3 ×3 spatial and temporal res-
olution was sufficient for action recognition. Only
those responses above a threshold value are recorded.
Figure 1: The scaled original image (top row) along with
the corresponding response image (R - equation 1) bottom
row.
From these response functions a cuboid descriptor
is formed. This is a three dimensional cuboid formed
from the original image sequence in space and time. It
consists of all (greyscale) pixel values within an area
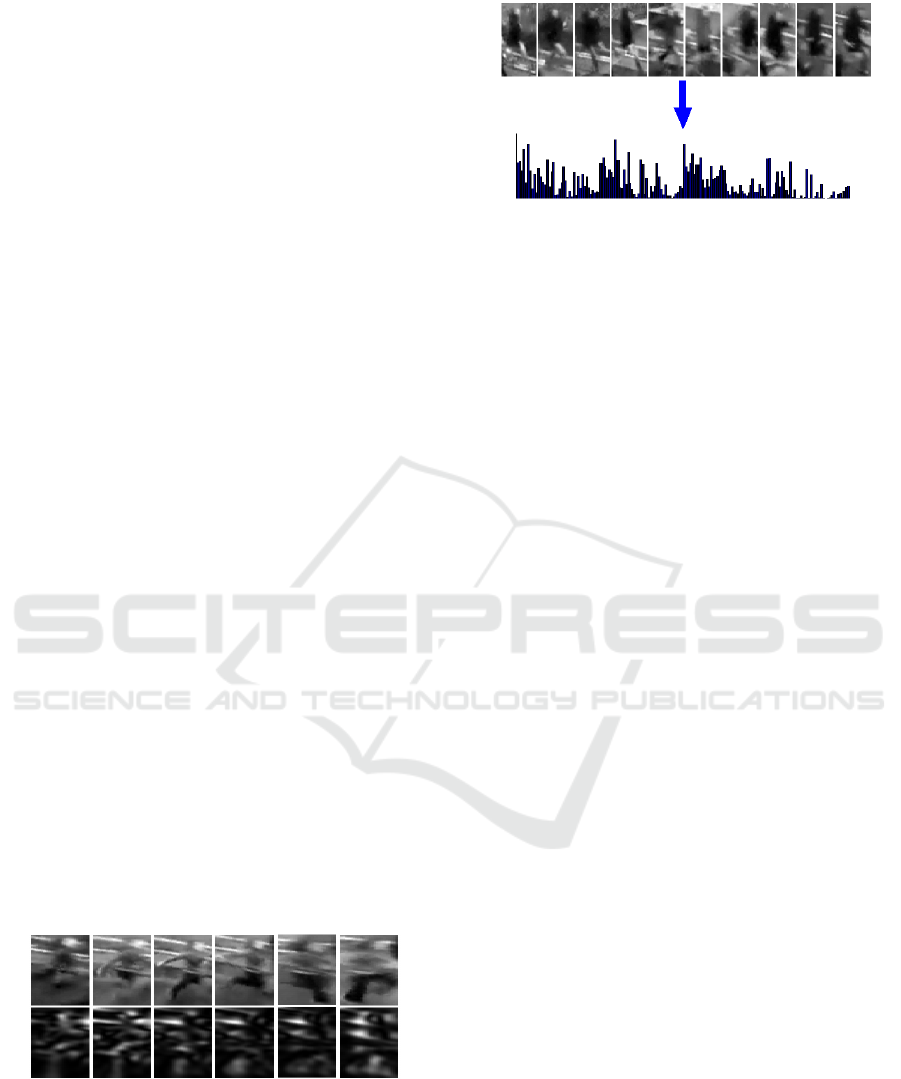
Figure 2: Examples of sequences along with the corre-
sponding histogram representation. The histograms are
computed over the entire sequence. Top is a fighting se-
quence, bottom left is a normal sequence and bottom right
is a post fighting sequence. The fixed size histograms are
composed from the whole complete sequence, whose length
can vary. The histograms are normalised to unit weight
of six times the scale at which it was detected. Only
those regions where the response is above a certain
threshold are used.
3.1 Sequence Representation
Each sequence generates a set of cuboids (as detailed
in section 3). Each pre-identified class (fighting, pre-
fight, post fight and normal) generates a large num-
ber of cuboids over all sequences. From this large
number of cuboids a smaller set is sub-sampled (us-
ing random sampling) so that these cuboids can be
clustered. K-means clustering (Duda et al., 2000) is
used to identify k cluster centres (using the Euclidean
distance as a similarity metric). Clustering was per-
formed per class (k=10, giving a total dictionary size
of 40, set empirically), with the final dictionary con-
sisting of all clusters concatenated.
For each sequence a histogram is created based
upon the previously learned cluster centres. The re-
sponse function (equation 1) is applied throughout the
complete sequence. Cuboids are then generated from
the complete sequence as described in section 3.
For each cuboid in the new sequence the near-
est cluster within the learned cluster centre dictionary
is found. A histogram is then made of all matches
throughout the sequence. This histogram is then nor-
malised. Examples of image sequences and their cor-
responding histograms are given in figure 2.
In addition to the histogram the features, as de-
scribed in section 3, are included in the sequence rep-
resentation. This gives a final representation (S
i
) of
sequence i :
S
i
=
h
i
| d
i
,R
i
µ
,R
i
σ
(2)
h
i
is the i
th
histogram and d
i
the distance the per-
son has moved for the i
th
sequence. The mean (R
i
µ
)
VISAPP 2009 - International Conference on Computer Vision Theory and Applications
304

and standard deviation (R
i
σ
) of the response image se-
quence (R ) for the i
th
sequence make up the other
additional features.
4 CLASSIFICATION
Here AdaBoost (Freund and Schapire, 1996) is used
to classify each sequence based upon the sequence
representation. The implementation of AdaBoost
uses a decision tree classifier as a weak learner.
The approach also differs from a standard Ad-
aBoost classifier in that we employ a hierarchical clas-
sification method. Such a hierarchy is preferable to
multiclass AdaBoost (such as that used by Zhu et al.
(Zhu et al., 2006) ) as we are trying to discover the
structure of events.
4.1 Hierarchy
To discover the best structure (in terms of classifica-
tion performance) the set of P possible hierarchical
partitions of the classes was created. At each level
within the hierarchy we look at all possible partitions
of the binary class labels. The number of possible par-
titions at a particular leaf is given in equations (3) and
(4) :
f (N, k) =
N
k
/2 i f , k =
N
2
N
k
otherwise
(3)
k
P
k
=
b
(N/2)
c
∑
k=1
f (N, k) (4)
N is the number of possible classes (in our case
totaling four). The case where k =
N
2
removes mirror
partitions (ie partitions which are the same but sim-
ply swapped between the right and left side) from the
set of partitions. For this four class problem there are
k
P
k
= 7 initial possible partitions : (([1][2 3 4]),([1
2][3 4]),([1 3][2 4]),([1 4][2 3]),([2][1 3 4]),([3][1 2
4]),([4][1 2 3])). Another partition is calculated at ev-
ery node of the tree from the classes assigned to that
node until each node has only one class.
The hierarchical model starts with a set of all pos-
sible partitions P of the set of all class labels (C
n
) at
the current node n. Each of these partitions (p
n
) has a
left (l) and right (r) branch such that:
p
n
= {l
n
,r
n
} (5)
l
n
⊂ C
n
(6)
r
n
= C
n
\l
n
(7)
5 RESULTS
5.1 Classification of Complete
Sequences
These experiments are similar in spirit to those of
Troscianko et al. (Troscianko et al., 2004) who tested
human ability to detect dangerous situations by us-
ing complete pre-segmented sequences prior to ask-
ing the question: what happens next? Here the com-
plete test sequences of varying lengths are used to
test the algorithm’s performance. First the ques-
tion of optimal dictionary size is investigated. The
best performing dictionary size is then used to clas-
sify whole sequences and results are presented and
discussed. We use two publicly available datasets
to test the method. First we use the small scale
CAVIAR dataset (Project/IST 2001 37540, 2004) be-
fore also demonstrating the approach upon the BE-
HAVE dataset (Blunsden et al., 2007).
The datasets were manually labelled into 4
classes: Pre-fight, post fight fighting and no-fighting.
These classes were manually labelled by members of
a computer vision surveillance lab.
Results on the BEHAVE Dataset. The classifica-
tion tree was constructed by first separating the train-
ing and test data into two distinct and equal sized sets.
The data was separated per sequence so that training
samples were not taken from the same sequence as
those used for testing. The best tree as determined by
our method over a number of runs is given in figure 3.
Confusion matrices for this tree are given in table 1.
Figure 3: The final classification tree. Shaded nodes show
the classes from which partitions of the data are formed.
This tree gives an overall classification perfor-
mance of 89.9% correct classification with a standard
deviation over multiple runs of 0.019. The confu-
sion matrices for classifying individual classes and all
fighting behaviour as one is given in figure 1(b). For
normal vs fighting behaviour correct classification is
at 96%. The structure groups post and pre fight be-
haviour together suggesting that there is a high degree
of similarity between them.
PRE-FIGHT DETECTION - Classification of Fighting Situations using Hierarchical AdaBoost
305
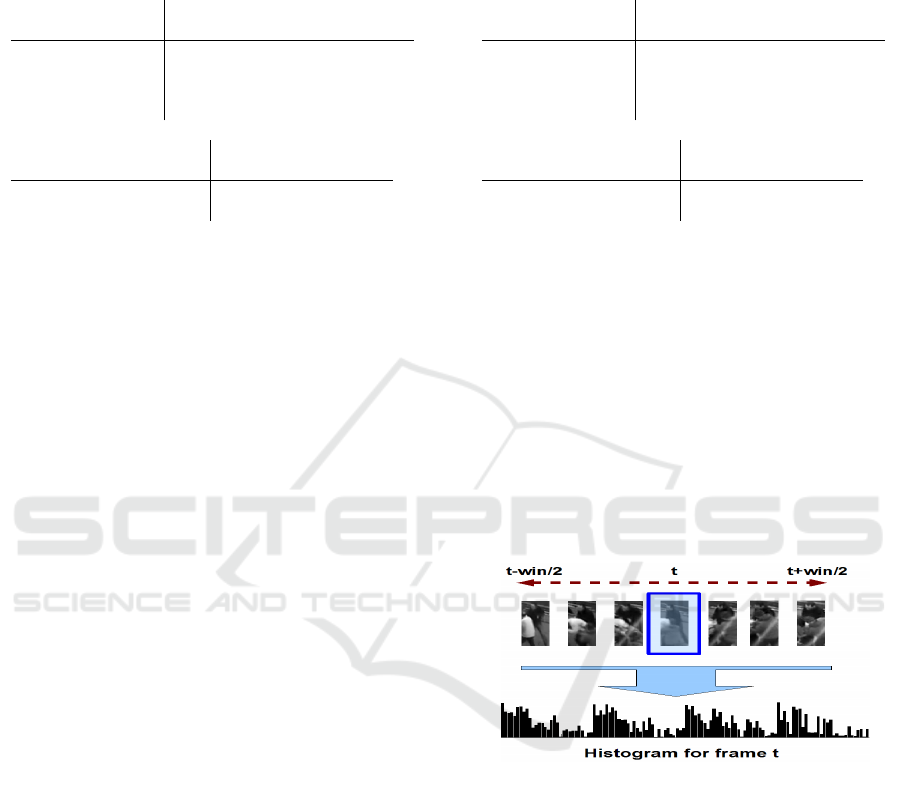
Table 1: Confusion matrix for classification of sequences.
(a) Shows the performance treating each class individually
whilst (b) shows results with all fighting behaviour aggre-
gated. Results are for the BEHAVE dataset.
True
Fight Pre-Fight Post Fight Normal
Fight 0.96 0.02 0.06 0.02
Classified Pre-Fight 0.04 0.88 0.08 0.01
Post-Fight 0 0.08 0.78 0.01
Normal 0 0.02 0.08 0.96
(a)
True
Fighting Related Normal
Fighting Related 0.96 0.04
Classified Normal 0.04 0.96
(b)
When grouping all fighting based behaviour to-
gether the performance increases substantially. It is
useful to show performance for such normal vs non-
normal behaviour as there are many applications to
surveillance situations. The cases where a fighting
situation is classified as normal is relatively low with
much of the confusion arising between pre, post and
actual fighting.
Results on the CAVIAR Dataset. For the smaller
dataset the results are also promising (see table 2).
However it should be noted that the number of fight-
ing examples is significantly less then examples from
the BEHAVE dataset. Again when grouping all the
fighting situations together (pre/post and actual fight-
ing) the results improve significantly. None of the
fighting situations are confused with a normal situa-
tion. Overall performance is 89.3% with again a very
small standard deviation of 0.1. The overall accuracy
rises to 92.9% when considering all fighting vs no
fighting situations. The tree retains the same structure
as the one above and so is not reproduced here.
However some normal situations are misclassified
as a fight situation. This is perhaps to do with some
of the fighting scenes being acted out rather than be-
ing actual fights. Some of the scenes where a peo-
ple are walking together and meeting one another can
look similar to fighting scenes within this dataset. It
is often the pre and post fight behaviour which also
helps to identify a fight something which the normal
sequences do not display.
5.2 Labeling of Continuous Sequences
A further experiment was conducted whereby se-
quences were not pre-segmented but instead a con-
tinuous video stream was presented to the classifier.
This task is much harder than using pre-segmented
sequences due to the high degree of overlap between
Table 2: Confusion matrix for classification of sequences
for the CAVIAR dataset. (a) Shows the performance treat-
ing each class individually whilst (b) shows results with all
fighting behaviour aggregated.
True
Fight Pre-Fight Post Fight Normal
Fight 1 0 0 0.11
Classified Pre-Fight 0 1 0.2 0
Post-Fight 0 0 0.8 0
Normal 0 0 0 0.89
(a)
True
Fighting Related Normal
Fighting Related 1 0.11
Classified Normal 0 0.89
(b)
different classes as they transition from one to the
other.
In order to continuously classify each frame a win-
dow around the current frame was used to provide the
features which the classifier used. This approach is
shown in figure 4. The reason a window around the
current frame to classify is used is to help with lag
when the activity changes. Whole sequences were
again divided into training and testing with the results
of classifying only the test set are presented. By di-
viding up complete sequences rather than only frames
we ensure we are classifying data rather than interpo-
lating it.
Figure 4: Construction of the histograms for continuously
labeling all frames in the video. The current frames (high-
lighted) histogram is made up of cuboid centres from within
a specified window (in this case 50 frames either side).
Every other step of the algorithm stayed the same,
except that the features are derived from a finite win-
dow around the current frame. This gave a vast in-
crease of the number of samples. For the BEHAVE
dataset there are 31094 samples of size ±50 frames to
classify (vs 1138 complete sequences, as in the previ-
ous section). The CAVIAR dataset gives 3094 indi-
vidual frames to classify (vs 56 complete sequences).
First we investigate what window size it is appropriate
to use.
VISAPP 2009 - International Conference on Computer Vision Theory and Applications
306
5.2.1 Classification Results
Behave Dataset. The best result when using this
method on the BEHAVE sequence gave an overall
classification performance of 89%. Again this rose
to 92% when only fighting vs normal behaviour was
considered. Confusion matrices for classification of
continuous video data on the BEHAVE dataset is
given in figure 3.
Table 3: Confusion matrices for the BEHAVE dataset con-
tinuous sequences at a window size of 90. (a) shows per
class performance whilst (b) shows the results of aggregat-
ing fighting behaviour together.
True
Fight Pre-Fight Post Fight Normal
Fight 0.67 0.38 0.32 0.05
Classified Pre-Fight 0.17 0.2 0 0.01
Post-Fight 0.01 0 0.68 0.01
Normal 0.15 0.42 0 0.93
(a)
True
Fighting Related Normal
Fighting Related 0.81 0.07
Classified Normal 0.19 0.93
(b)
An example of classification is given below in fig-
ure 5.
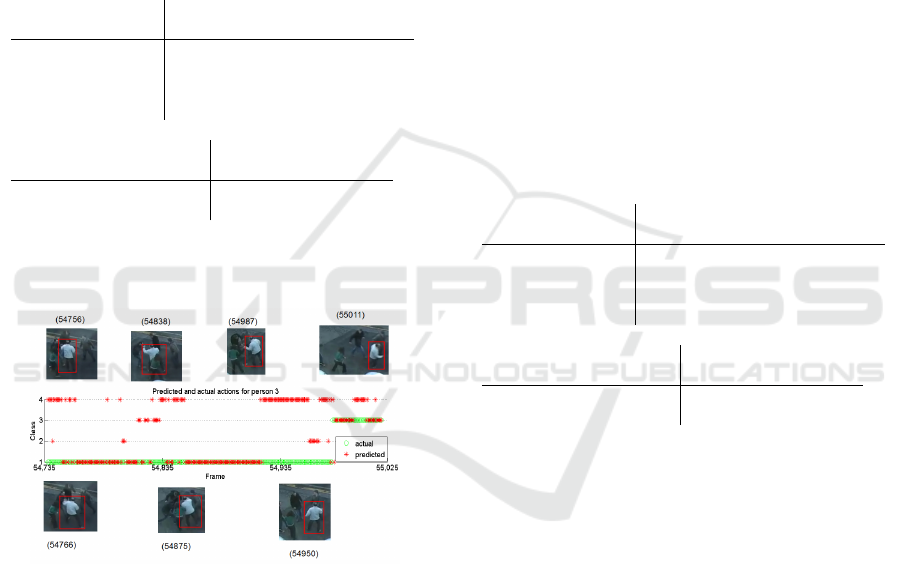
Figure 5: Predicted actions for the individual shown in the
red box. The numbers in parenthesis refer to the frame num-
bers. Here Class 1 is fighting, 2 pre-fighting, 3 post fighting
and 4 is for a normal situation. Around frame 54,935 the
individual slowly breaks away from the fighting. This may
explain the errors around this time, it looks very similar to
a group splitting up. There is a slight prediction delay be-
tween fighting and post-fight behaviour of running away.
This is down to using a window around the current frame,
thus basing the classification on some portion of the past,
coupled with the uncertainty as event change.
When classification is performed in this manner
parts of the sequences are misclassified as being nor-
mal when they are not. The lower number of ex-
amples when using a 100 window size for post-fight
sequences is due to the short timescale upon which
they happen (ie there are not as many post fight sit-
uations of 100 frames in length). A future improve-
ment will be to construct the histograms to adapt their
length based upon the video information available.
The switching between normal and fighting frames is
due to the similarity in their appearance over a rela-
tively short timescale.
CAVIAR Dataset. Results for the CAVIAR dataset
are given in figure 4. For this dataset the results are
not as good. Fighting and pre-fighting are frequently
confused with normal behaviour. This may have to
do with the very small number of fighting examples
contained within this dataset coupled with the very
short time span. When watching pre and post fighting
behaviour some of the examples have less purpose-
ful movement and speed than those contained in the
BEHAVE sequences and real fights.
Table 4: Confusion matrices for continuous sequences. (a)
shows per class performance whilst (b) shows the results of
aggregating fighting behaviour together. CAVIAR dataset.
Results are for a window size of 45.
True
Fight Pre-Fight Post Fight Normal
Fight 0.07 0 0 0.092
Classified Pre-Fight 0 0 0.03 0.004
Post-Fight 0 0.11 0.32 0.004
Normal 0.92 0.88 0.64 0.9
(a)
True
Fighting Related Normal
Fighting Related 0.24 0.1
Classified Normal 0.76 0.9
(b)
6 CONCLUSIONS AND FUTURE
WORK
The major contribution this paper has addressed is
that of investigating the feasibility of identifying pre-
fight situations. The ability to identify when a fight
is likely to break out is useful in surveillance applica-
tions as it may be possible to intervene to stop a crime
occurring or at least identify such situations at the ear-
liest possible opportunity to allow useful intervention.
The role of identifying post fighting behaviour is also
of use as there may be some areas which CCTV cam-
eras do not cover. They may only witness the end of
a fight but it may be important to send assistance to
this area in an effort to help victims and stop further
criminal acts occurring.
The second major contribution is in publishing
results on publicly available datasets. Such trans-
PRE-FIGHT DETECTION - Classification of Fighting Situations using Hierarchical AdaBoost
307

parency is important in order to establish how well
algorithms work in comparison to others.
This paper has presented a way to classify fighting
situations. Our method gives 96% correct classifica-
tion on the BEHAVE dataset compared to Datta et al.
(Datta et al., 2002) who reported 97% and Cupillard
et al. (Cupillard et al., 2002) who report 95% for de-
tection of fighting situations on other (and separate)
datasets. However our method does not require the
pre segmentation of parts of individuals, foreground
extraction or pre compiled behaviour models. It has
also been demonstrated that it is possible to identify
pre and post-fight situations. Such cases are important
to monitoring situations as intervention before the act
is always preferable.
A hierarchical classifier is useful in many surveil-
lance applications. Using such a structure can visu-
ally show you how the classification algorithm per-
ceives the features which are given to it. This can be
useful as a sanity check to make sure that the method
is grouping things as you expect them to be.
However it is felt the most useful aspect of using
a hierarchical classifier is in the ability to subdivide
behaviours into a finer degree of granularity. For ex-
ample in a surveillance application one may wish to
identify all the fighting situations (as we have done
here) and then obtain further granularity so as to iden-
tify pre and post fight situations as we have shown.
This ability is useful as it can allow a fine tuning of a
surveillance system.
One issue raised here is that of overlapping
classes. It has been shown that when all the fight-
ing classes are combined the accuracy increases. The
question of are the classes truely different or rather
just transitional states between normal and fight-
ign behaviour. To investigate this an unsupervised
method could be used. However it may still be use-
ful to be able to distinguish the point before a fight (
eg before someone got hurt) in order to stop physical
injury occuring.
Future work should seek to improve the classifica-
tion of continuous sequences perhaps by incorporat-
ing temporal models (eg, hidden Markov models) to
improve classification. A further extension would be
to remove the manual tracking component altogether
(although some targets will be temporarily lost), or to
combine individuals into group actions.
ACKNOWLEDGEMENTS
Thanks to Piotr Dollar for kindly making his cuboids
code available. This work is funded by EPSRCs BE-
HAVE project GR/S98146.
REFERENCES
Blunsden, S., Andrade, E., Laghaee, A., and
Fisher, R. (2007). Behave interactions
test case scenarios, epsrc project gr/s98146,
http://groups.inf.ed.ac.uk/vision/behavedata/interacti-
ons/index.html. On Line.
Cupillard, F., Bremond, F., and Thonnat, M. (2002). Group
behavior recognition with multiple cameras. In Sixth
IEEE Workshop on Applications of Computer Vision
(WACV).
Datta, A., Shah, M., and Lobo, N. D. V. (2002). Person-on-
person violence detection in video data. In Proceed-
ings of the 16 th International Conference on Pattern
Recognition (ICPR’02) Volume 1, page 10433. IEEE
Computer Society.
Davis, J. W. and Bobick, A. F. (2001). The representation
and recognition of action using temporal templates. In
IEEE Transactions on Pattern Analysis and Machine
Intelligence, volume 23, pages 257–267. IEEE Com-
puter Society.
Dee, H. and Hogg, D. C. (2004). Is it interesting? com-
paring human and machine judgements on the pets
dataset. Sixth International Workshop on Performance
Evaluation of Tracking And Surveillance, 33(1):49–
55.
Dollar, P., Rabaud, V., Cottrell, G., and Belongie, S. (2005).
Behavior recognition via sparse spatio-temporal fea-
tures. In PETS, pages 65–72, China.
Duda, R., Hart, P. E., and Stork, G. D. (2000). Pattern Clas-
sification, Second Edition. Wiley Interscience, Uni-
versity of Texas at Austin, Austin, USA.
Efros, A., Berg, A., Mori, G., and Malik, J. (2003). Recog-
nising action at a distance. In In 9th International
Conference on Computer Vision, volume 2, pages
726–733.
Freund, Y. and Schapire, R. E. (1996). Game theory, on-line
prediction and boosting. In Ninth Annual Conference
on Computational Learning Theory, pages 325–332.
Niebles, J. C., Wang, H., and FeiFei, L. (2006). Unsu-
pervised learning of human action categories using
spatial-temporal words. In British Machine Vision
Conference, Edinburgh.
project/IST 2001 37540, E. F. C. (2004). found at url:
http://homepages.inf.ed.ac.uk/rbf/caviar/.
Ribeiro, P. and Santos-Victor, J. (2005). Human activi-
ties recognition from video: modeling, feature selec-
tion and classification architecture. In Workshop on
Human Activity Recognition and Modelling (HAREM
2005 - in conjunction with BMVC 2005), pages 61–70,
Oxford.
Troscianko, T., Holmes, A., Stillman, J., Mirmehdi, M.,
and Wright, D. (2004). What happens next? the pre-
dictability of natural behaviour viewed through cctv
cameras. Perception, 33(1):87–101.
Zhu, J., Rosset, S., Zhou, H., and Hastie, T. (2006). Multi-
class adaboost. Technical report, University of Michi-
gan, Ann Arbor.
VISAPP 2009 - International Conference on Computer Vision Theory and Applications
308
