
DEVELOPING A PUPILLOMETER
Gonçalo Leal
1
, Pedro Vieira
2
and Carlos Neves
3
1
Department of Physics, Science and Technology Faculty, New University of Lisbon, Portugal
2
Institute of Biophysics and Biomedical Engineering, Science Faculty, University of Lisbon, Portugal
3
Department of Physiology, Institute of Molecular Medicine, School of Medicine, Lisbon University, Portugal
Keywords: Pupil, Pupillometer, Medical Instrumentation, Ophthalmology.
Abstract: This project presents stable and robust optical equipment for detecting the area of the pupil and its variation
on a temporal scale. An algorithm was developed to detect the pupil contour, implemented in a simple,
intuitive and user friendly interface programme. Using the equipment specifically developed, measurements
were taken of the area, perimeter, horizontal diameter and vertical diameter. After a statistical and
comparative study, it was possible to reach conclusions regarding the general dimensions of the pupil, its
variation prompted by a given stimulus and the clinical viability of the equipment concerned.
1 INTRODUCTION
The area of the pupil changes in response to the
variation in light intensity in the retina, with a view
to assisting the optimizing of visual perception. In
dim light, pupil dilation (midriasis) is an effective
way to maximize the number of photons reaching the
retina, which in turn activates adaptive mechanisms
to low light intensity. When exposed to bright light,
miosis causes an adequate reduction in the intensity
of light in the retina, acting as immediate response to
the mechanisms of adapting to intense light (Kardon,
2003). The study of the way the pupil changes its
size is of relevant clinical interest, for it acts as an
objective indicator of the retina’s sensitivity to light
and, as a result, of the optical nerve functionality.
The state of a person’s pupil allows for several
diseases to be diagnosed, among which sleep
disturbances (narcolepsy), photophobia,
schizophrenia (pharmacological reaction), Adie’s
Syndrome, Alzheimer’s, narcotic addiction, among
others.
2 STATE OF THE ART
Nowadays, Pupillometry is mostly based in
computers. This technology, based on image
processing, numerically analyses the pupil features.
The sensitivity of existing systems varies much and
depends to a major degree on the spatial and
temporal resolution of the acquisition devices and
also on the algorithms used. Pupillometers differ also
in portability and applicability. The majority of
current Pupillometry devices use algorithms that are
based on physical models and that use a circle or an
ellipsoid as an approach to the pupil contour (Kim et
al, 2004).
Recent studies have been made using Fourier
series to determine the pupil contour (Rakshit and
Monro, 2007).
3 MATERIALS
3.1 Material Used
The current system is based on a LE175C
LUMENERA camera that is connected, via Ethernet,
to a personal computer (figure 1). A floodlight of
500W was used as external illumination and as a
stimulator of the subject’s pupil. The camera is
placed in a mechanical arm attached to a table. The
arm can be moved vertically and horizontally in a
small area (figure 2a). The subject’s head is
positioned in a mechanical support that can be
moved vertically (figure 2b).
314
Leal G., Vieira P. and Neves C. (2009).
DEVELOPING A PUPILLOMETER.
In Proceedings of the International Conference on Biomedical Electronics and Devices, pages 314-319
DOI: 10.5220/0001780403140319
Copyright
c
SciTePress
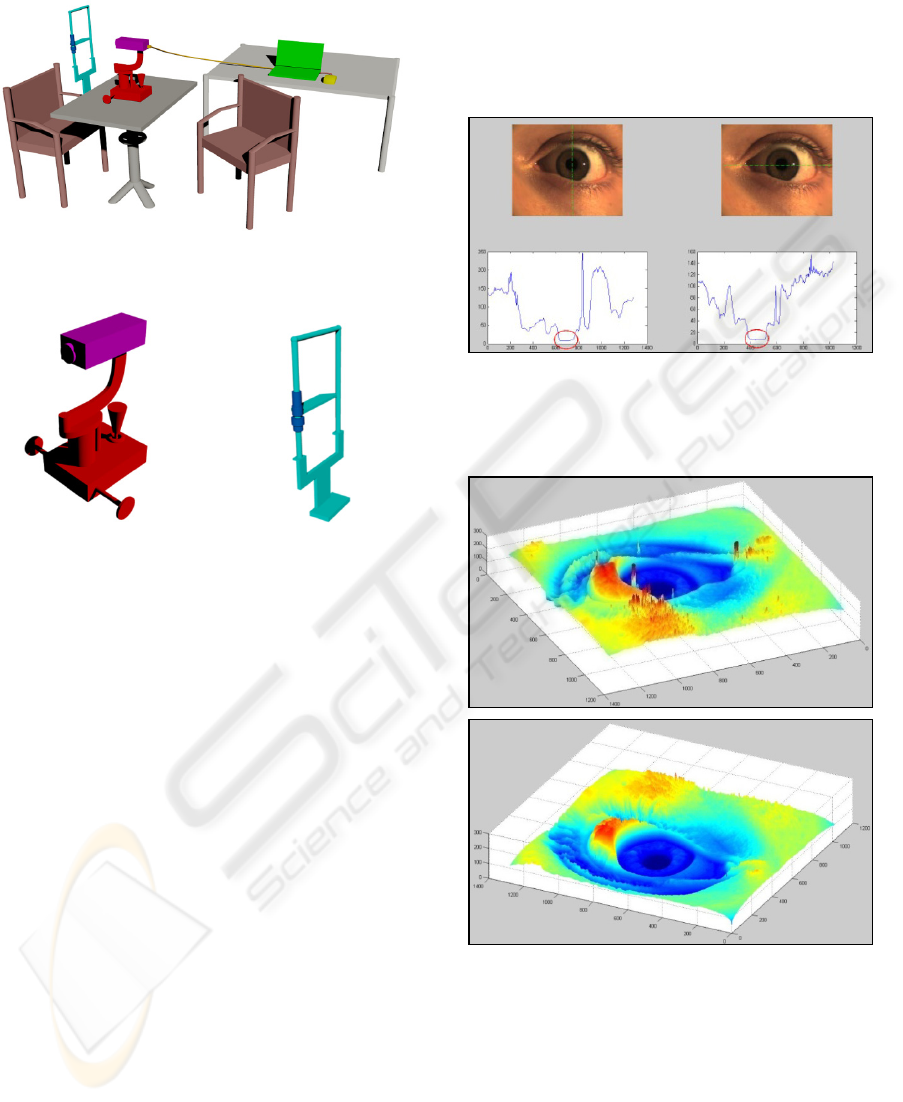
3.2 System Concept
Figure 1: First version of the Pupillometer System
designed in AutoCAD.
Figure 2: (a) Mechanical arm that moves the camera
horizontally and vertically. (b) Mechanical device where
the subject places his/her head. This device allows vertical
movement.
4 METHODS
4.1 Algorithm
The Matlab programme was chosen to develop all
the software required for the system, since it is a
very resourceful software and has very good imaging
tools and functions.
An algorithm was developed based on the
concept of Intensity Threshold. It starts with an
initial point (calculated by a secondary algorithm
shown in figures 3 and 4) and traces lines to every
direction separated by a 5 degree angle (LI,
Dongheng and Derrik J. Parkhurst, 2006). It then
compares the intensity of gray levels of consecutive
points along the traced line. If the variation of values
is bigger than the Threshold value, the algorithm
stops and defines a point that characterizes the pupil
contour. Then a second line is traced using the
previously calculated point as the new start point,
but in the opposite direction, in order to calculate the
opposite contour point and so speed up the time of
measurement. Once all points are defined, there are
specified algorithms that calculate the area,
perimeter, horizontal diameter and vertical diameter
of the image. The value of Threshold can be
manually inserted or can be calculated by two
algorithms developed for that purpose (Square
Threshold and Circle Threshold).
Figure 3: Analysis of gray intensity in the image. We can
see the pupil zone featured by low levels of intensity. This
is how the programme calculates the initial point for the
beginning of the cycle.
Figure 4: In order to improve the analysis shown in figure
3 we can plot the intensity of an image in a 3D mesh plot.
The pupil is shown in dark blue, since it has the lowest
intensity gray levels. Both images are the same, but image
b) is the result of a) with a Low Pass filter applied. This
feature reduces the error because the eyelashes are also
dark and could be misunderstood as an area of the pupil by
the algorithm.
4.2 Graphic User Interface (GUI)
To put all the algorithms together, a user friendly
(a)
(b)
(a)
(b)
DEVELOPING A PUPILLOMETER
315
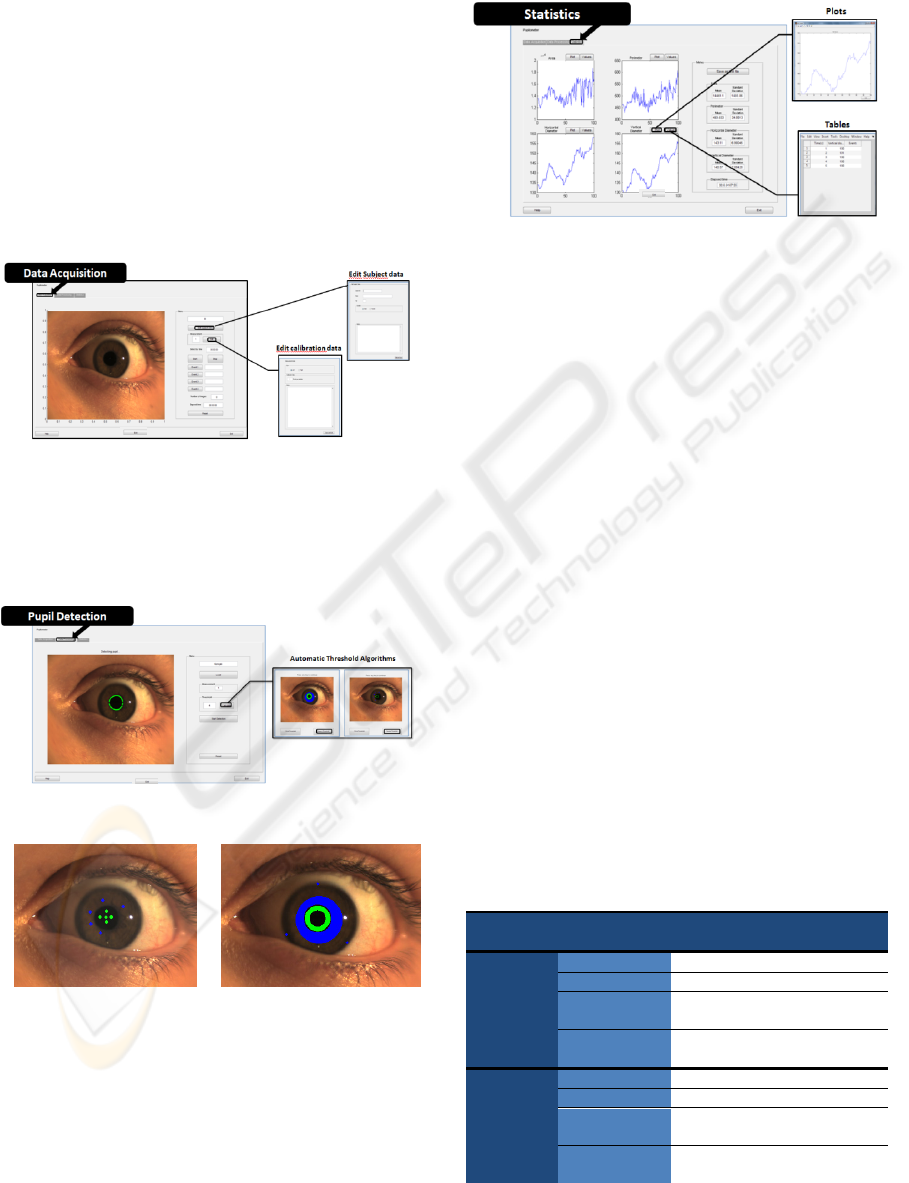
interface was developed in Matlab, which acquires
all data by filming the eye of the subject. This
interface also measures pupil dynamics by
processing large amounts of images and determines
the statistical data of the results.
There are three main panels: data acquisition
panel, pupil detection panel and statistics panel.
The first panel (figure 5) shows the images that
are being stored in real time. We can also edit the
subject’s demographic data and the calibration data.
There are event buttons that store the time when a
stimulus is applied to the subject (the better to
analyse the statistical data).
Figure 5: Data Acquisition Panel.
The second panel (figure 6) is used to measure the
pupil dynamics during a period of time. There is a
menu where the user can easily calculate the
threshold value for automatic detection (figure 7).
Figure 6: Pupil Detection Panel.
Figure 7: a) Square threshold (compares the intensity gray
levels of 5 pupil points to 5 iris points). b) Circle
Threshold (compares a torus of points of the pupil to a
torus of points of the iris, mainly in the pupil/iris border.
The function of the third panel (figure 8) is to view
all the data statistics in two ways: by plots and by
tables. The user can also view the standard deviation
of each variable and save all data to a .txt file that
can easily be exported to other programmes used in
Fourier and Wavelet analysis.
Figure 8: Statistics Panel.
Outside the three panels, the interface has three
buttons, one for exiting the programme, a second one
to view the help file (a .pdf document with the user
guide of the software) and a third to consult the IDs
of all subjects in the database.
4.3 Data Acquisition
For this preliminary study, the right eye of nine
individuals was measured in a dark room where the
only light source was a 500W floodlight. Each
subject was illuminated with a bright light, so that
the pupil’s accommodation over time could be
detected (first the pupil contracted and then the pupil
dilated over time). Each subject’s head was
positioned at a distance of about 25cm from the
camera. The light stimulus was applied to the subject
and didn’t change during the measurements.
In order to remove the reflexes from the subjects’
eye, no direct illumination was used.
A hundred images were taken for each subject
(for about 10-15 seconds, depending on the speed of
image storing, which is independent of the amount
of data in the camera and also with the processing
speed of the computer used).
Table 1: Acquired data statistical information.
Subject Data Mean
Standard
Deviation
Test 1
Area
14444.80 1509.91
Perimeter
493.35 35.20
Horizontal
Diameter
143.10 7.00
Vertical
Diameter
140.57 7.08
Test 2
Area
11062.80 1508.11
Perimeter
482.12 49.79
Horizontal
Diameter
127.84 6.93
Vertical
Diameter
135.20 10.01
(a)
(b)
BIODEVICES 2009 - International Conference on Biomedical Electronics and Devices
316
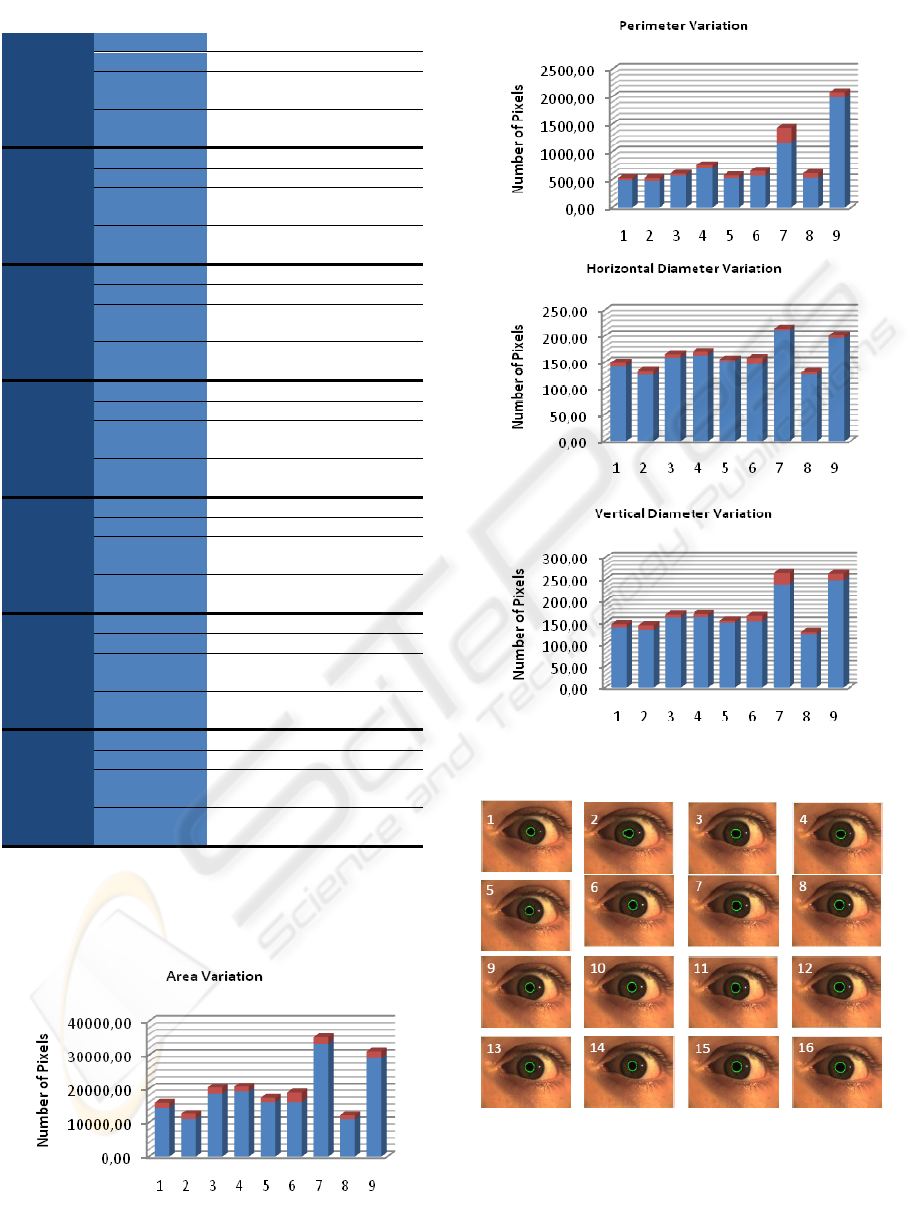
Table 1: Acquired data statistical information (Cont).
Test 3
Area
18489.40 1861.11
Perimeter
574.14 32.25
Horizontal
Diameter
159.24 6.30
Vertical
Diameter
162.39 6.38
Test 4
Area
19133.60 1497.48
Perimeter
698.84 68.99
Horizontal
Diameter
163.64 6.70
Vertical
Diameter
163.32 6.27
Test 5
Area
16065.20 1281.32
Perimeter
529.56 47.55
Horizontal
Diameter
153.01 3.09
Vertical
Diameter
150.80 4.58808
Test 6
Area
16112.10 2789.19
Perimeter
571.28 86.97
Horizontal
Diameter
147.74 11.03
Vertical
Diameter
153.64 12.29
Test 7
Area
33239.40 1991.74
Perimeter
1168.96 267.96
Horizontal
Diameter
211.41 3.93
Vertical
Diameter
239.35 25.56
Test 8
Area
10985.10 1161.59
Perimeter
533.17 82.11
Horizontal
Diameter
128.34 4.06
Vertical
Diameter
125.25 5.35
Test 9
Area
29139.60 1974.06
Perimeter
1989.11 916.88
Horizontal
Diameter
197.40 4.75
Vertical
Diameter
248.56 14.49
Note 1: Subjects 7 and 8 used contact lenses on purpose so that
the influence of contact lenses in the measurement could be
studied.
Note 2: All results are in number of pixels, since the zoom lens
changes the size of each pixel.
An example of the output data for one subject is
shown below:
Figure 9: Example of the pupil detection of an amount of
16 consecutive frames. All frames look alike because this
measurement was made at high speed.
Eye color: Brown.
Number of images: 100.
DEVELOPING A PUPILLOMETER
317
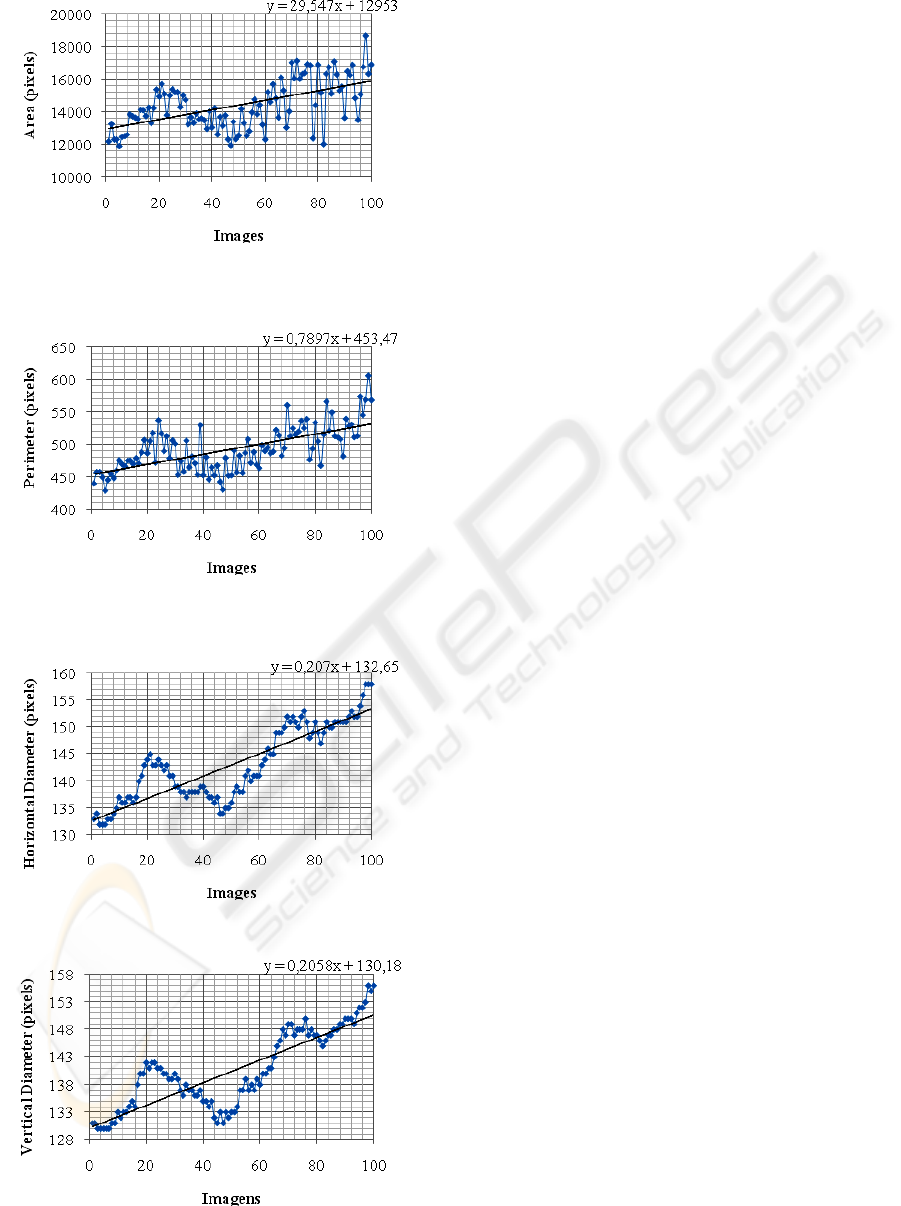
Figure 10: Plot of the Area of each frame along all 100
images.
Figure 11: Plot of the Perimeter of each frame along all
100 images.
Figure 12: Plot of the Horizontal diameter of the pupil
along all the thirty images.
Figure 13: Plot of the Vertical diameter of the pupil along
all the 100 images.
Output .txt file
14:24
03-Oct-2008
Id: Test 1
Threshold: 3
Area Perim Dist_h Dist_v
12282.0 441.2 133 131
13289.5 458.2 134 131
12339.0 458.2 132 130
(…)
Elapsed processing time: 00:07:14 (hms).
5 RESULTS AND DISCUSSION
The acquired results displayed in table 1 show that
the subject’s pupil dilated during the period of
accommodation. It is clear that the pupil size
changed during the acquisition period and, since this
is a preliminary study, the results fit the objectives.
However there is some error caused by the reflex of
visible light in the images taken.
The pupils of subjects 7 and 9 showed more
dilatation, since they suffer from myopia. These
people tend to have a larger pupil, as this study
successfully shows. A careful analysis of the pupil’s
diameters plots (figures 12 and 13) show that the
pupil’s fluctuations behave like a sinusoidal curve.
This behaviour is very interesting, for we can predict
the period of the sinusoidal curve.
A detailed analysis of the plots shows that we
can relate the pupil’s fluctuations to the sympathetic
and parasympathetic nervous flows in the subject’s
brain. This feature can be used in the future to
compare the pupil’s fluctuations in a normal subject
those of the pupil of a subject suffering from a
neurological disorder (Alzheimer’s or Narcolepsy,
for example).
By analyzing the statistical values of the
processed data we understand that the area and
perimeter algorithms must be optimized, since they
are expressing an error of about 7% and 5% (Matlab
error analysis), respectively.
Because grey scale (256 levels) images were
used, the system has the ability of detecting smaller
variations when
by comparing to some other studies
made in this area, such as IACOVIELLO’s (2006).
This feature allows the detection of small variations
in the digital image, so that the error can be reduced
and more information gathered.
6 CONCLUSIONS
This paper presents a complete system that can
BIODEVICES 2009 - International Conference on Biomedical Electronics and Devices
318

accurately measure the dynamics of pupillary
movements given various stimuli. This is commonly
considered one of the most important parameters to
make non-invasive diagnosis of many neurological
disorders.
This system has a very user friendly interface that
will allow doing clinical trials by people not
specialised in this specific technique.
The acquired results showed some error in the
contour detection. In order to surpass this problem
the detection algorithm must be optimized and a
different type of camera must be used. Since the tests
were made using a camera that works in the visible
wavelengths, there was some light reflex in the
subject’s eye. For better results an infrared camera
should have been used, but no such camera was
available at the time of this study.
The results also showed some pupil noise, that is
chiefly due to the sympathetic and parasympathetic
neural flow. The main algorithm has been improved
to a good ratio between statistical error and
processing speed.
It is relevant to say that the detection algorithm
does not use physical models and does not
approximate the pupil contour to any geometrical
figure. The speed of the algorithm is compromised
but the results are more precise.
This study sets out to design a medical
instrument that can be used by any technician or
physician to measure pupil dynamics. For example,
it could be attached to a hospital bed, to monitor the
pupil activity of patients. The interface is compiled
in a .exe file that can easily be installed in every
computer even if the computer does not have Matlab
installed.
6.1 Future Perspectives
To improve the existing system it is clear that it must
evolve into an optical device that works in infrared
light. With this feature the light reflexes in the eye
will not influence the acquired data and the system
will also work in the dark. Using a CCD camera and
an infrared light system, an image of the anterior
surface of the eye can be obtained, even when
external lighting is not present (without interference
from non-controlled stimuli).
We intend to process the acquired data using
Fourier and Wavelet analysis, to work in frequency
and time domains.
The main algorithm will adapt to every image in
such a way that the threshold value will be
calculated for each frame, so that the digital image
features may vary (brightness, contrast and gamma).
In the developed GUI all results are expressed in
pixels, but, to facilitate the physician’s work, an
algorithm must be created to convert pixels into
millimeters. However, it will not be easy, since the
system uses a zoom lens and so the pixel size is
dependent of the zoom setting.
We believe that, in the near future this
methodology can be of assistance to Ophthalmology
diagnosis by quantifying the sympathetic and
parasympathetic pupillary dilatation components.
ACKNOWLEDGEMENTS
We thank the Department of Physiology of the
Institute of Molecular Medicine for technical advice
and for sponsoring the project, and the colleagues of
Hangar 4 of FCT-UNL for laboratory assistance, and
the colleagues of the Institute of Biophysics and
Biomedical Engineering for technical advice and
helpful discussions.
REFERENCES
Enderle, John, Susan Blanchard and Joseph Bronzino.
Introduction to Biomedical Engeneering. 2
th
Edition.
San Diego: Academic Press, 2005.
Filipe, João A. Capão, F. Falcão Reis and J. Castro
Correia. “Assessement of autonomic function in high
level athletes by pupillometry”. Autonomic Neuro-
science: Basic and Clinical. Vol.104. 2003, pp. 66-72.
Gonzalez, Rafael C., Richard E. Woods and Steven
L.Eddins. Digital Image Processing using MATLAB.
New Jersey: Prentice Hall, 2004.
Hachol, A., et al. “Measurement of pupil reactivity using
fast pupilometry”. Physiol. Meas. Vol.28. 2007, pp. 61-72.
Howarth, Peter A., Gordon Heron and Louise Wittaker. “
The Measurement of Pupil cycling time”. Graete's
Arch Clin. Exp. Ophthalmol. Vol.238, 2000, pp. 826-832.
Iacoviello, Daniela. “Analysis of pupil fluctuations after a
light stimulus by image processing and neural
network”. Computers and Mathematics with
Applications. Vol.53. 2006.
Kardon, Randy. 2003. “Pupil”. In Adler's Physiology of
the Eye. Edited by Paul L. Kaufman and Albert Alm.
10th Edition. St Louis : Mosby, 713-743.
Kim, Jieun, Kyungmo Park and Gon Khan. 2004. “A
Method for Size Estimation of Amorphous Pupil in 3-
Dimensional Geometry”. Paper presented at the 26th
Annual International Conference of the IEEE EMBS,
in San Francisco.
Li, Dongheng and Derrik J. Parkhurst. “Starburst: A robust
algorithm for video-based eye tracking”. openEyes.
http://thirtysixthspan.com/openEyes/publications.html.
Rakshit, Soumyadip and Donald M. Monro. Pupil Shape
Description using Fourrier Series. 2007.
Smith, Shirley A. and S. E. Smith. “Pupil function: tests
and disorders”, in MATHIAS, Christopher J. and Sir
Roger Bannister, Autonomic Failiure: A Textbook of
Clinical Disorders of the Autonomic Nervous System.
4
th
Edition. Oxford : Oxford University Press, 2001.
DEVELOPING A PUPILLOMETER
319
