
BINARIZATION OF PHASE CONTRAST VOLUME IMAGES OF
FIBROUS MATERIALS
A Case Study
Filip Malmberg
Centre for Image Analysis, Uppsala University, Uppsala, Sweden
Catherine
¨
Ostlund
STFI-Packforsk AB, Stockholm, Sweden
Gunilla Borgefors
Centre for Image Analysis, Swedish University of Agriculture, Uppsala, Sweden
Keywords:
X-ray microtomography, Graph cut segmentation, Phase Contrast, Fibrous materials.
Abstract:
In this paper, we present a method for segmenting phase contrast volume images of fibrous materials into
fibre and background. The method is based on graph cut segmentation, and is tested on high resolution X-ray
microtomography volume images of wood fibres in paper an composites. The new method produces better
results than a standard method based on edge-preserving smoothing and hysteresis thresholding. The most
important improvement is that the proposed method handles thick and collapsed fibres more accurately than
previous methods.
1 INTRODUCTION
1.1 Background
Wood fibres are used in many types of materials. The
most common such materials are paper and board,
which consist of a dense network of pulp fibres. An-
other, quite new application for wood fibres is com-
posite materials, where a network of pulp fibres is
used to reinforce a plastic matrix.
Recently, X-ray microtomography has been suc-
cessfully used to capture high resolution volume im-
ages of fibrous materials non-destructively (Antoine
et al., 2002; Samuelsen et al., 2001). Automated anal-
ysis of such images can give a lot of useful informa-
tion about the properties of the material.
As described in (Samuelsen et al., 2001), the most
straightforward way of providing the contrast neces-
sary for imaging with X-rays is to use beam absorp-
tion. However, when imaging low-density materials,
such as pulp fibres, it is difficult to get enough con-
trast using absorption. For such materials, phase con-
trast can be used instead. In phase contrast images,
changes in refractive index of the imaged sample, i.e.,
the interfaces between different materials in the sam-
ple, are detected. In phase contrast volume images
of fibrous materials, the interface between fibre and
background is visible as a bright band on the fibre side
of the interface and a dark band on the background
side. These dark and bright bands will be denoted in-
terface bands. A small part of a slice from a volume
that exhibits these phenomena is shown in Figure 1.
Both absorption contrast and phase contrast ef-
fects may be present in an image. With X-ray micro-
tomography, the balance between absorption contrast
and phase contrast is determined by the distance be-
tween the sample and the imaging sensor.
Since many image analysis methods require a bi-
nary image as input, segmenting the images into fibre
and background is an important pre-processing step.
We call this step binarization. The balance between
phase contrast and absorption contrast in the image
affects the choice of binarization method.
In absorption images, the intensity of each image
element corresponds to the density of the material it
148
Malmberg F., Ã
˝
Ustlund C. and Borgefors G.
BINARIZATION OF PHASE CONTRAST VOLUME IMAGES OF FIBROUS MATERIALS - A Case Study.
DOI: 10.5220/0001781301480153
In Proceedings of the Fourth International Conference on Computer Vision Theory and Applications (VISIGRAPP 2009), page
ISBN: 978-989-8111-69-2
Copyright
c
2009 by SCITEPRESS – Science and Technology Publications, Lda. All rights reserved
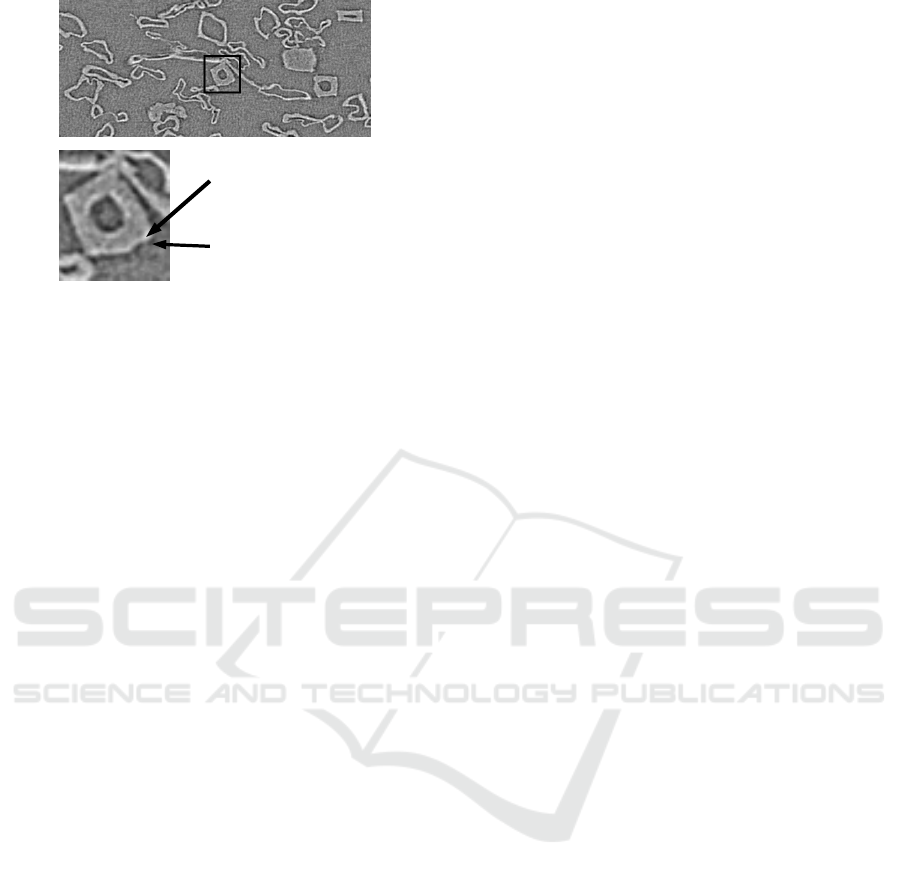
Bright band
Dark band
Figure 1: Part of a slice from a pulp-fibre composite sample
imaged with phase contrast X-ray microtomography. Bright
and dark interface bands are visible at the boundaries be-
tween fibre and background.
represents. Given that there are sufficient differences
in density between the imaged materials, the intensity
of an element directly indicates which material it be-
longs to. Thus the image can, in theory, be segmented
by thresholding the intensity values. In practice, the
image is often corrupted by noise and other artifacts,
that must be removed or reduced before thresholding
can be applied.
Phase contrast images are conceptually harder to
binarize than absorption images, since most indi-
vidual image elements contain no information about
which material they belong to. Instead, we only have
information about the boundaries between the dif-
ferent materials. At these boundaries, however, in-
terface bands provide local information about which
side of the boundary that corresponds to which ma-
terial. To binarize the image, this local information
must somehow be propagated to the rest of the im-
age in a consistent way. Here, we present a method
for binarizing phase contrast volume images contain-
ing two distinct materials. The method first identifies
the interface bands using thresholding. These are then
used as input for segmentation with minimal graph
cuts (Boykov, 2006).
1.2 Previous Work
Binarization of absorption mode volume images of fi-
brous materials has been addressed in a number of pa-
pers during recent years. The most common approach
is to use some kind of edge preserving smoothing to
reduce image noise. The filtered image is then bina-
rized using thresholding or region growing. Isolated
structures that are considered too small to be fibres are
then removed using morphological operations. Vari-
ants of this approach were used in, e.g., (du Roscoat
et al., 2005), (Bache-Wiig and Henden, 2005) and
(Martin-Herrero and Germain, 2007).
In the phase-contrast images shown here, the
width of the interface bands are about the same as
the width of the fibre walls. The interior of many fi-
bres are therefore filled entirely by the bright inter-
face band. This means that many fibres are brighter
than the background. Therefore, it is tempting to
use a threshold-based method for binarization. How-
ever, this approach will make it hard to correctly bi-
narize collapsed fibres and fibres with thicker walls,
since the interior of these fibres will have about the
same intensity level as the background. Using edge-
preserving filters, it may be possible to propagate the
intensity values of the bright interface band to the in-
terior of such fibres, although this might require very
precise parameter settings and the results will be hard
to predict.
A method for segmenting phase contrast images
of carbon-carbon composites is presented in (Vig-
noles, 2001). Two thresholds, one high and one low,
are applied to the image to identify the bright and dark
interface bands respectively. An intermediate image
is then constructed where the identified bright inter-
face bands are set to white, the identified dark inter-
face bands are set to black, and all other image ele-
ments are set to gray. We will call this type of inter-
mediate image a trimap.
Two different methods for reconstructing the seg-
mented image from the trimap are described in (Vig-
noles, 2001). In the first method, the boundary of each
connected gray region is examined. If the boundary is
predominantly white, the region is labeled as white,
and vice versa. This method is based on the assump-
tion that there are no holes in the interface bands. This
assumption is often violated in real images, due to
noise and other artifacts, and in such cases the method
may fail drastically.
In the second method, all gray elements that have
at least one non-gray neighbor are examined. If the
element has more white neighbors than black neigh-
bors, it is set to white. Else it is set to black. This pro-
cedure is repeated until no gray elements remain. This
method is more robust to “leaks” in the bands than the
first method. However, only the binary information
from the identified interface bands is used to delin-
eate the boundaries in the image. In regions where
the interface bands are too weak to be correctly iden-
tified by thresholding, no image information is used
in the delineation of the fibre boundary.
1.3 Outline of the Proposed Method
The method proposed in this paper is conceptually
similar to the methods in (Vignoles, 2001). Just as
BINARIZATION OF PHASE CONTRAST VOLUME IMAGES OF FIBROUS MATERIALS - A Case Study
149

in that paper, a trimap, where each element is labeled
as either fibre, background or unknown, is created.
We will, however, use minimal graph cuts to create
a binary image from the trimap. Segmentation with
graph cuts will be explained in detail in the next sec-
tion. Using graph cuts has the advantage that image
information can be taken into account even in areas
where the interface bands are too weak to be detected
by thresholding.
2 GRAPH CUT SEGMENTATION
Graph cut segmentation is an image segmentation
method based on combinatorial optimization tech-
niques. The method is applicable to images of any
dimension and gives a binary partitioning of the im-
age into background and object.
In graph cut segmentation the image is interpreted
as a graph, where image elements correspond to nodes
and paths between adjacent elements correspond to
graph edges. Each graph edge is assigned a non-
negative cost. Two special nodes are added to the
graph, the source node and the sink node. Image el-
ements that are a priori known to belong to the ob-
ject are connected to the source node with zero cost
edges. Similarly, elements that are known to belong
to the background are connected to the sink node. A
cut on the a graph is a set of edges that, if removed
from the graph, separate the source from the sink. A
cut thus associates each node with either the source
or the sink. The cost of a cut is the sum of the cost
of all edges in the cut, and a minimal cut is a cut such
that no other cut has a lower cost. A computationally
efficient algorithm for computing minimal graph cuts
was described in (Boykov and Kolmogorov, 2004).
The fundamental idea of graph cut segmentation
is that a minimal cut on the graph of an image corre-
sponds to an optimal partitioning of the image into
background and object, subject to the constraints
given by the edge weights and the geometry of the
graph. An illustration of this concept is shown in Fig-
ure 2.
From a user perspective, this means that we must
supply a trimap image, where each element is labeled
as either background, object or unknown. Further-
more we must supply a costmap image, where the
value of each element is inversely proportional to the
“likelihood” that the element belongs to the bound-
ary of the object of interest. This is typically based
on image features that describe strong edges in the
image, such as the gradient magnitude of the image.
The graph cut method then produces a binary segmen-
tation, where the boundary between the object and the
Figure 2: Principle of graph cut segmentation. Left: Initial
state of the graph. Right: A cut on the graph.
background is located at strong edges in the image.
3 METHOD
In order to apply graph cut segmentation to phase
contrast images, we need to create a trimap and a
costmap. The trimap is created using essentially the
same approach as that in (Vignoles, 2001). The vol-
ume is thresholded at two values, one low value and
one high value. This produces two binary images that
represent the dark and bright interface bands, respec-
tively.
For images with strong noise, good threshold val-
ues may not exist. In such cases we have used hystere-
sis thresholding (Canny, 1986) to identify the inter-
face bands. The user must thus specify two threshold
values, t
1,1
and t
1,2
, for segmenting the bright inter-
face bands, and two threshold values, t
2,1
and t
2,2
, for
segmenting the dark interface bands.
The two binary images containing the interface
bands are then merged into a single trimap. The
trimap does not have to be complete, i.e., leaks in
the interface bands are allowed. However, elements
wrongly labeled as fibre or background should be
avoided, since any such errors will remain in the fi-
nal binarization.
Since the graph cut algorithm is computationally
expensive, it is desirable to keep the number of nodes
in the graph as small as possible. In practice, only
the unknown elements are included in the graph. Re-
ducing the number of unknown elements in the trimap
thus reduces the computation time.
In order to exclude uninteresting elements (i.e. el-
ements that are highly unlikely to belong to a fibre)
from the computations we have used the following
heuristic: A 3D distance transform (Borgefors, 1996)
is computed from the bright image elements, i.e. ele-
ments known to be inside the fibres. The distance map
is truncated at some distance value, and elements with
larger distance values are labeled as background. The
threshold value should be as small as possible in or-
VISAPP 2009 - International Conference on Computer Vision Theory and Applications
150
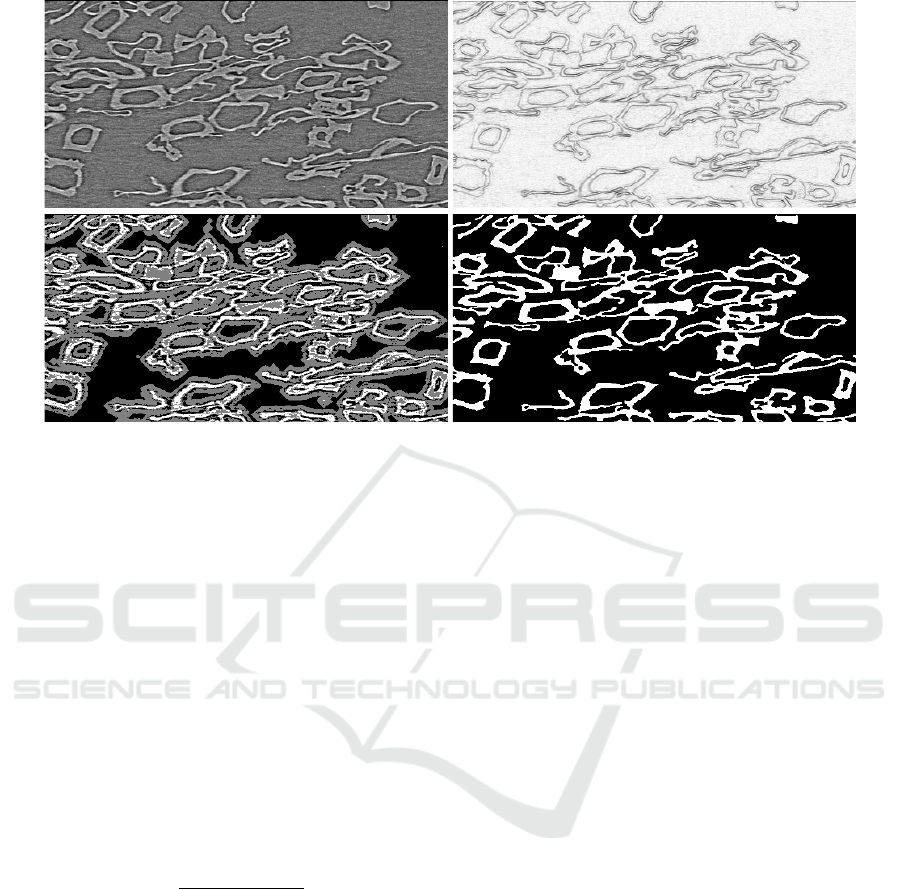
Figure 3: The different steps of the proposed method. Top left: A slice from the original volume. Top right: Costmap. Bottom
left: Trimap. Bottom right: Binarization result after graph cut segmentation and removal of small isolated structures.
der to minimize the computation time, but still large
enough not to discard any fibre elements. We have
found during our experiments that suitable values for
a batch of images are not hard to find manually by
visual inspection.
The costmap c is computed using 3D Sobel filters.
Edge responses dx, dy and dz are computed separately
along the three coordinate axes of the volume. The
following convolution filter is used in each direction:
1 0 −1
2 0 −2
1 0 −1
The magnitude of the gradient vector formed by
these three components is then used as a cost function:
c =
p
dx
2
+ dy
2
+ dz
2
(1)
Once the trimap and the costmap are created,
graphcut segmentation is applied.
If the trimap contains some false fibre regions due
to noise in the image, this might result in small iso-
lated fibre regions in the binarized image. As an op-
tional post-processing step, isolated regions smaller
than some specified size (e.g., a few elements) may
be removed using morphological operations (Sonka
et al., 1998). The different steps of the method are
shown in Figure 3.
4 EXPERIMENTS
Volume images of fibrous materials (paper, board,
pulp-fibre composites) were captured with X-ray
microtomography at the European Synchrotron Ra-
diation Facility (ESRF) in Grenoble, at the ID19
beam line. The size of each reconstructed volume
is 2048x2048x1280 voxels, with gray-values in the
range [0,255]. The voxels are isotropic, with a side
length of approximately 0.7µm. Ring artifacts present
in the images were reduced using the method de-
scribed in (Axelsson et al., 2006).
The volumes were binarized using the proposed
method. In order to reduce computation time, each
volume was divided into subvolumes (512x512x256),
and graph cut segmentation was applied separately to
each of the subvolumes. This procedure might pos-
sibly introduce some errors at the borders of the sub-
volumes. However, we were unable to detect any such
errors during visual inspection of the merged results.
Parameters for the construction of the trimaps
were determined through visual inspection, and the
same parameters were used for all subvolumes. A
software tool for quick visual inspection of volume
images, developed using The Visualization Toolkit
(VTK) (The Visualization Toolkit, 2008), was used
to make the evaluation easier. A screenshot from this
tool is shown in Figure 4. Table 1 shows the param-
eter settings for two different materials, a pulp-fibre
composite and a newsprint paper.
For comparison purposes, the volumes were also
BINARIZATION OF PHASE CONTRAST VOLUME IMAGES OF FIBROUS MATERIALS - A Case Study
151
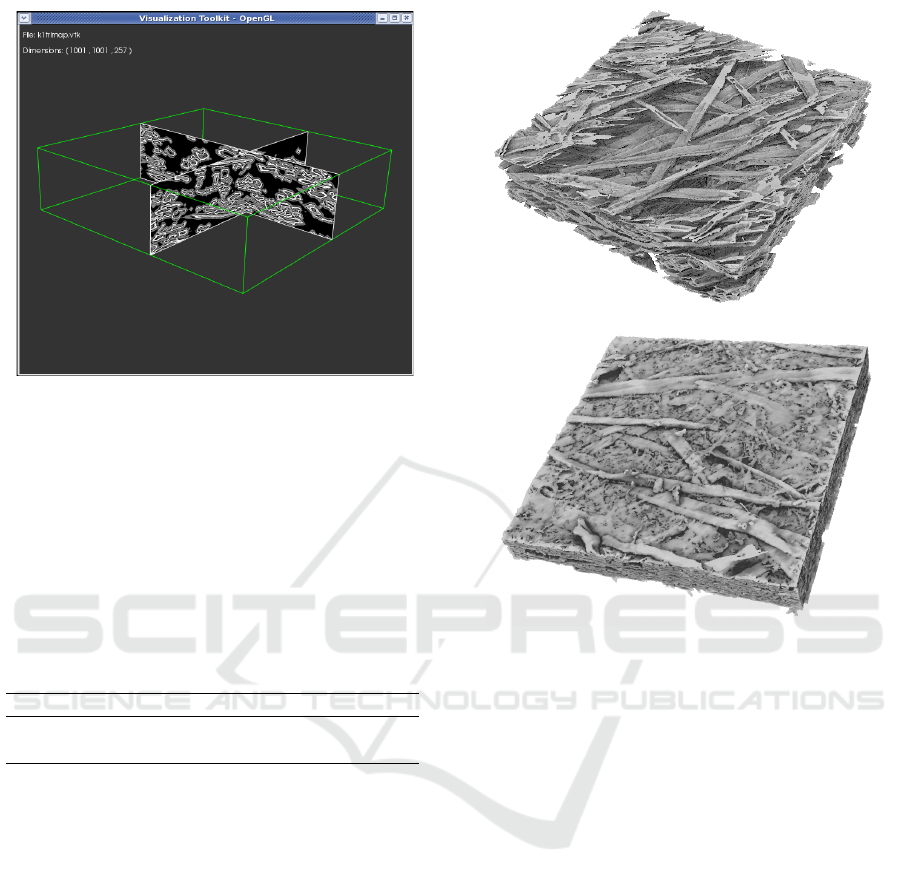
Figure 4: A screenshot from a tool, developed using VTK,
for quick visual inspection of volume images. The tool was
used to facilitate evaluation of parameter settings.
binarized using a threshold-based method. Follow-
ing the method described in (Bache-Wiig and Hen-
den, 2005), image noise was first reduced using iter-
ated SUSAN-filtering (Smith and Brady, 1997). The
filtered volumes were then binarized using hysteresis
thresholding.
Table 1: Examples of parameter settings for trimap con-
struction.
Sample t
1,1
t
1,2
t
2,1
t
2,2
Pulp-fibre composite 190 170 80 80
Newsprint paper 185 165 80 80
5 RESULTS
No ground truth segmentation exists for the studied
volumes, and therefore it is difficult to make a quan-
titative comparison between the two tested methods.
Visual inspection of many segmented images, how-
ever, reveals some systematic differences. Both meth-
ods produce good segmentation results for thin, hol-
low fibres. For collapsed and thick fibres, however,
the threshold based method often fails to fill the inte-
rior of the fibre. As discussed in section 1.2, this is
due the fact that the SUSAN-filtering fails to propa-
gate intensity values from the boundary of the fibre far
enough into the interior regions. The proposed graph
cut based method, on the other hand, handles these
cases correctly. An example of this is shown in Fig-
ure 6. Surface renderings of two samples, binarized
using the proposed method, are shown in Figure 5.
The computation time for the proposed method is
Figure 5: Surface renderings of two samples, binarized us-
ing the proposed method. Top: Pulp-fibre composite. Bot-
tom: Newsprint paper.
dominated by the graph cut segmentation. For each
subvolume, the graph cut segmentation was computed
in 3-4 minutes on a computer with eight 3GHz Intel
processors and 32 GB of RAM.
6 CONCLUSIONS
For X-ray microtomography images where the phase
contrast is stronger than the absorption contrast, the
proposed method gives better results than previous
methods based on the combination of edge-preserving
smoothing and thresholding.
The method might also be applied to other phase
contrast images. For the method to work, the images
should contain no more than two separate materials.
The refractive indices of the materials must be suf-
ficiently different, so that the interface bands at the
boundary between the materials can be identified with
thresholding.
VISAPP 2009 - International Conference on Computer Vision Theory and Applications
152
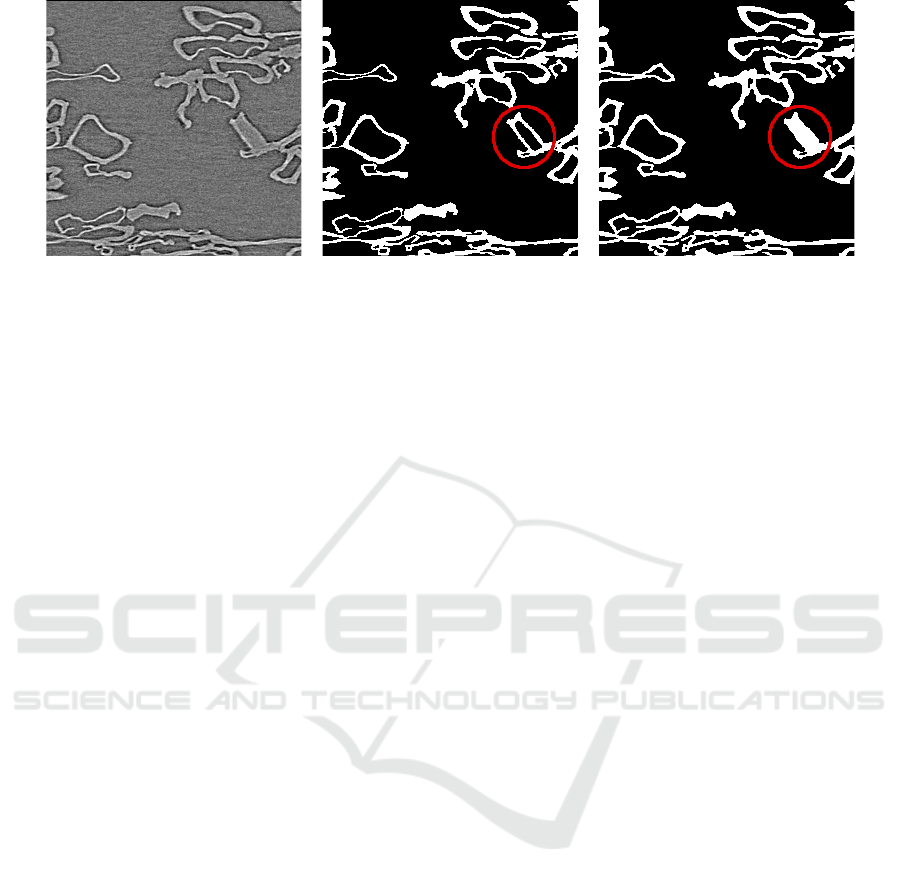
Figure 6: Comparison between threshold-based binarization and the proposed method. The red circles indicate a typical
example of a collapsed fibre where the threshold-based method fails. Left: Original slice. Middle: The same slice, binarized
with iterated SUSAN-filtering and hysteresis thresholding. Right: The same slice, binarized with the proposed method.
ACKNOWLEDGEMENTS
The European Synchrotron Radiation Facility (ESRF)
in Grenoble is gratefully acknowledged for the 3D im-
age data acquired during the Long Term project ME-
704, that was used in this study.
REFERENCES
Antoine, C., Nyg
˚
ard, P., Gregersen, Ø. W., Holmstad, R.,
Weitkamp, T., and Rau, C. (2002). 3d images of
paper obtained by phase-contrast x-ray microtomog-
raphy: image quality and binarization. Nuclear In-
struments and Methods in Physics Research Section
A: Accelerators, Spectrometers, Detectors and Asso-
ciated Equipment, 490(1-2):392 –402.
Axelsson, M., Svensson, S., and Borgefors, G. (2006). Re-
duction of ring artifacts in high resolution X-ray mi-
crotomography images. In et al., F., editor, Proceed-
ings of DAGM, volume LNCS 4174, pages 61–70.
Bache-Wiig, J. and Henden, P. (2005). Individual fiber seg-
mentation of three dimensional microtomograms of
paper and fiber-reinforced composite materials. Mas-
ter’s thesis, Norwegian University of Science and
Technology. Available at http://www.pvv.org/
˜
perchrh/papers/, accessed 8 September 2008.
Borgefors, G. (1996). On digital distance transforms in
three dimensions. Computer Vision and Image Un-
derstanding, 64(3):368 – 76.
Boykov, Y. (2006). Graph cuts and efficient n-d image seg-
mentation. International Journal of Computer Vision,
70(2):109–131.
Boykov, Y. and Kolmogorov, V. (2004). An experi-
mental comparison of min-cut/max-flow algorithms
for energy minimization in vision. IEEE Transac-
tions on Pattern Analysis and Machine Intelligence,
26(9):1124–1137.
Canny, J. F. (1986). A computational approach to edge de-
tection. IEEE Transactions on Pattern Analysis and
Machine Intelligence, 8(6):679–698.
du Roscoat, S. R., Bloch, J., and Thibault, X. (2005). Syn-
chrotron radiation microtomography applied to inves-
tigation of paper. Journal of Physics D: Applied
Physics, 38(10A):78–84.
Martin-Herrero, J. and Germain, C. (2007). Microstructure
reconstruction of fibrous C/C composites from x-ray
microtomography. Carbon, 45(6):1242 – 53.
Samuelsen, E., Gregersen, O., Houen, P., Helle, T., Raven,
C., and Snigirev, A. (2001). Three-dimensional imag-
ing of paper by use of synchrotron x-ray microtomog-
raphy. Journal of Pulp and Paper Science, 27(2):50–
53.
Smith, S. and Brady, J. (1997). SUSAN- a new approach to
low level image processing. Int. Journal of Computer
Vision, 23(1):45–78.
Sonka, M., Havlac, V., and Boyle, R. (1998). Image Pro-
cessing, Analysis, and Machine Vision. International
Thomson Publishing Company, second edition.
The Visualization Toolkit (2008). http://www.vtk.org.
Accessed 8 September 2008.
Vignoles, G. (2001). Image segmentation for phase-
contrast hard x-ray CMT of C/C composites. Carbon,
39(2):167 – 73.
BINARIZATION OF PHASE CONTRAST VOLUME IMAGES OF FIBROUS MATERIALS - A Case Study
153
