
HSV-DOMAIN ENHANCEMENT OF HIGH-CONTRAST IMAGES
Power Laws and Unsharp Masking for Bounded and Circular Signals
Alfredo Restrepo (Palacios), Stefano Marsi and Giovanni Ramponi
DEEI, University of Trieste, Via Valerio 10, Trieste, Italy
Keywords:
Tone mappings, Gamma correction, Unsharp masking, Circular processing, Color enhancement.
Abstract:
We present techniques for the amplification of small contrast of bounded signals; one is based on gamma
correction and another is of an unsharp-masking type; the one of the unsharp-masking type is suitably modified
for its application on circular signals as well. We enhance the saturation and luminance components of high
dynamic range images on the basis of a segmentation of the image into light and dark regions.
1 INTRODUCTION
Image contrast results both from luminance contrast
and from hue contrast. By a High Contrast (HC)
image we mean an image (that typically corresponds
to a high radiance range (Debevek and Malik, 1997)
scene) with a luminance histogram having modes near
0 and 1, that correspond to very light and very dark
regions in the image; such regions usually contain
(perhaps unnoticeable) subregions at small contrast.
The relatively low dynamic range of visualization de-
vices makes it impossible to literally display HDR
images. After rendering the scene radiance to image
luminance, large radiance contrast is likely to be ob-
servable but small contrast, even though present in
the resulting image, and probably observable in the
original scene, may not be noticeable. Thus, HC im-
ages benefit from small contrast amplification that im-
proves their quality and readability.
The luminance and saturation components of an
image are normally coded in the interval [0, 1] while
the hue is circulary coded in the interval [0, 2P) (we
denote the angle pi with the letter P). Increasing maps
that fix the points 0 and 1, such as the power law x
g
,
are appropriate for the modification of the magnitudes
of luminance and saturation. In Section 2, we am-
plify luminance contrast using a variant map related
to gamma correction. One other related tool is used
for amplifying luminance contrast in Section 3 and,
in a circular version, in Section 4, for amplifying hue
contrast. The tools apply a variant map that fixes lo-
cal value and has a high gain in the immediate vicin-
ity of this local value. The map respects the bounded
and (in the case of the hue) the circular natures of the
magnitudes.
A high radiance range scene is typically composed
of objects illuminated by direct and reflected or fil-
tered light and, in some cases, radiant objects. We
consider that saturation contrast should not be ampli-
fied and that the luminance component of an HC im-
age can usually be meaningfully segmented into light
and dark regions; we base a correction of luminance
and color saturation of HC images on such a segmen-
tation. For scenes where the eye of the observer is
likely to be more adapted to the dark region than to
the light region (e.g. an observer in a room with a
window at daylight), we increase the saturation of the
dark pixels using a power law and leave the usually-
unsaturated light pixels as such; this gives realism to
the resulting image; otherwise, e.g. in the case of
an outdoors scene containing shadows, we take the
reverse stance increasing the saturation of the light
pixels only (the luminance of shadowed pixels is in-
creased).
The lack of true or uniform color spaces can be
a source of confusion; e.g. RGB functions are dif-
ferent from SLM photoreceptor responses, the psy-
chophysical magnitudes of hue and saturation behave
differently from the h and s variables in hsv color
space. The Bezold-Brucke effect (Pridmore, 1999)
predicts a clustering of (perceived) hues towards yel-
low (of oranges and cetrines) and blue (of violets and
cyans) for large illumination intensities and another
towards red (of oranges and violets) and green (of
cyans and cetrines) for low illumination intensities;
in both cases, the range of perceived hue decreases.
On the other hand, it is likely that strong illumination
clusters colors near the white corner of the RGB cube
and near the black corner for low luminance. Both the
hsv and the hsl color systems use the RGB range (i.e.
28
Restrepo Palacios A., Marsi S. and Ramponi G.
HSV-DOMAIN ENHANCEMENT OF HIGH-CONTRAST IMAGES - Power Laws and Unsharp Masking for Bounded and Circular Signals.
DOI: 10.5220/0001781600280033
In Proceedings of the Fourth International Conference on Computer Vision Theory and Applications (VISIGRAPP 2009), page
ISBN: 978-989-8111-69-2
Copyright
c
2009 by SCITEPRESS – Science and Technology Publications, Lda. All rights reserved
the max minus the min) in the numerator of the def-
initions of the saturation variable; in the denomina-
tor, the hsv has min(2midrange, 2(1-midrange)) (the
midrange is the average of max and min of RGB)
while the hsl system uses the max of RGB. Thus, a
decrease of the RGB range is likely to decrease the
saturation in both cases. But the effect for light pixels
in hsv is to decrease the saturation while increasing it
for dark pixels; the hsl system increases the saturation
values both cases.
Even though there is no consensus regarding a
formula for the conversion of radiance into lumi-
nance, there is an agreement that it should be ap-
proximately logarithmic. We map the radiance r onto
the [0, 1]-coded luminance X by means of the inter-
mediate variable Y = k.log(r) (k is a positive con-
stant), compute its min (which typically is negative)
and range (i.e. the max minus the min of Y) and put
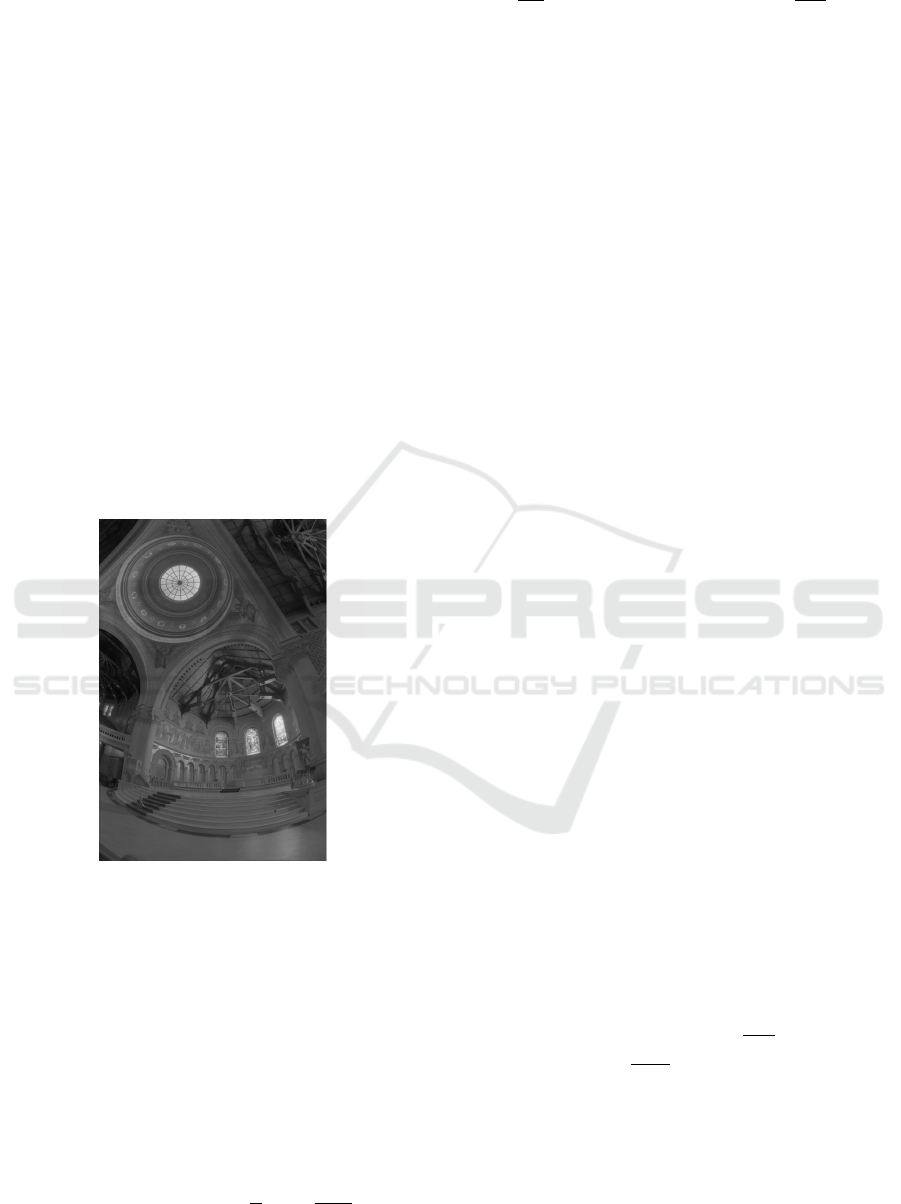
X = (Y − min)/range. For example, consider the use
of the formula as applied to image memorial.hdr (k=1
and r was calculated as 0.3R+0.6G+0.1B), as shown
in Figure 1.
Figure 1: (logR+7.2)/13, applied to the radiance of memo-
rial.hdr.
In addition to logarithmic nonlinearities, other types
of nonlinearity have been considered for the rendering
of HDR images; in particular, those suspected to play
a role in the retina of vertebrates (Meylan et al., 2007).
(Naka and Rushton, 1966) proposed the nonlinearity
V = 0.5(1+tanh(x −x
0
)) (we have added the normal-
izing factor 0.5) to model the S-potential response to
flashes of monochromatic light of (probably bipolar)
retinal cells, where the variable x represents the log(I)
of the intensity I. In terms of I, the nonlinearity be-
comes: V = 0.5(1 + tanh(log(
I
I
0
))) =
I
2
I
2
+I
2
0
which is
closely related to the other nonlinearity they propose:
V
0
=
J
J+1
, better known in the form y =
x
x+x
0
.
The enhancement of contrast for the visualization
of HC images is a topic of actuality. Meylan and
Susstrunk (Meylan and Susstrunk, 2006) locally en-
hance contrast within a retinex framework by com-
puting a local luminance using a mask resulting from
the convolution of the image and a Gaussian surround
function. (Drago and Chiba, 1997) use a logarithmic
law where the base of the logaithm is made dependant
on a power law of the pixelwise (rather than local) lu-
minance.
2 ON GAMMA CORRECTION
AND CONTRAST
ENHANCEMENT
(Unsigned) luminance contrast can be large or small;
for [0, 1]-coded luminance, by small local contrast
we mean a small luminance difference, e.g. less than
0.1; by large local contrast we mean neighbor pix-
els differing in luminance by a large amount, e.g.
more than 0.3; we are concerned here with small con-
trast. We define the small contrast amplification fac-
tor (SCA) of a tone map as the value of the deriva-
tive of the mapping evaluated at the local luminance
(which is measured using a location statistic such as
the average, the median, the midrange of the lumi-
nances in the window. A [0, 1] → [0, 1] luminance
map has different effects on small contrast at differ-
ent luminances. For the power-law technique also
known as gamma correction the luminance of each
pixel is raised to a positive power; by using an expo-
nent g larger (resp. lower) than one an image becomes
darker (resp. lighter); this effect has been exploited
in the restoration of faded prints (Restrepo and Ram-
poni, 2008); by looking at the derivative of the map-
ping it is seen that small contrast is improved where
it matters, i.e. at small luminances when g < 1 and
at large luminances when g > 1. Thus, it is conceiv-
able to use an adaptive power law approach to im-
prove the contrast of images; consider choosing an
exponent that maximizes the SCA of a power law at
the luminance of each pixel; from
d
2
dgdL
L
g
= 0 one gets
exponent g(L) = −
1
log(L)
. Instead of using it directly
as in l
g(l)
(which gives a constant), we compute the
corrected luminance as A
L,C
(l) = l
1+(g(L)−1)C
where l
is the original (pointwise) luminance and L and C are
the local (rather than pointwise) luminance and con-
trast, suitably computed from the data in each win-
dow. Here, we use L = 0.5l + 0.5N where N is the
median of the data, and C = 0.5R+0.5Q where R is
HSV-DOMAIN ENHANCEMENT OF HIGH-CONTRAST IMAGES - Power Laws and Unsharp Masking for Bounded
and Circular Signals
29
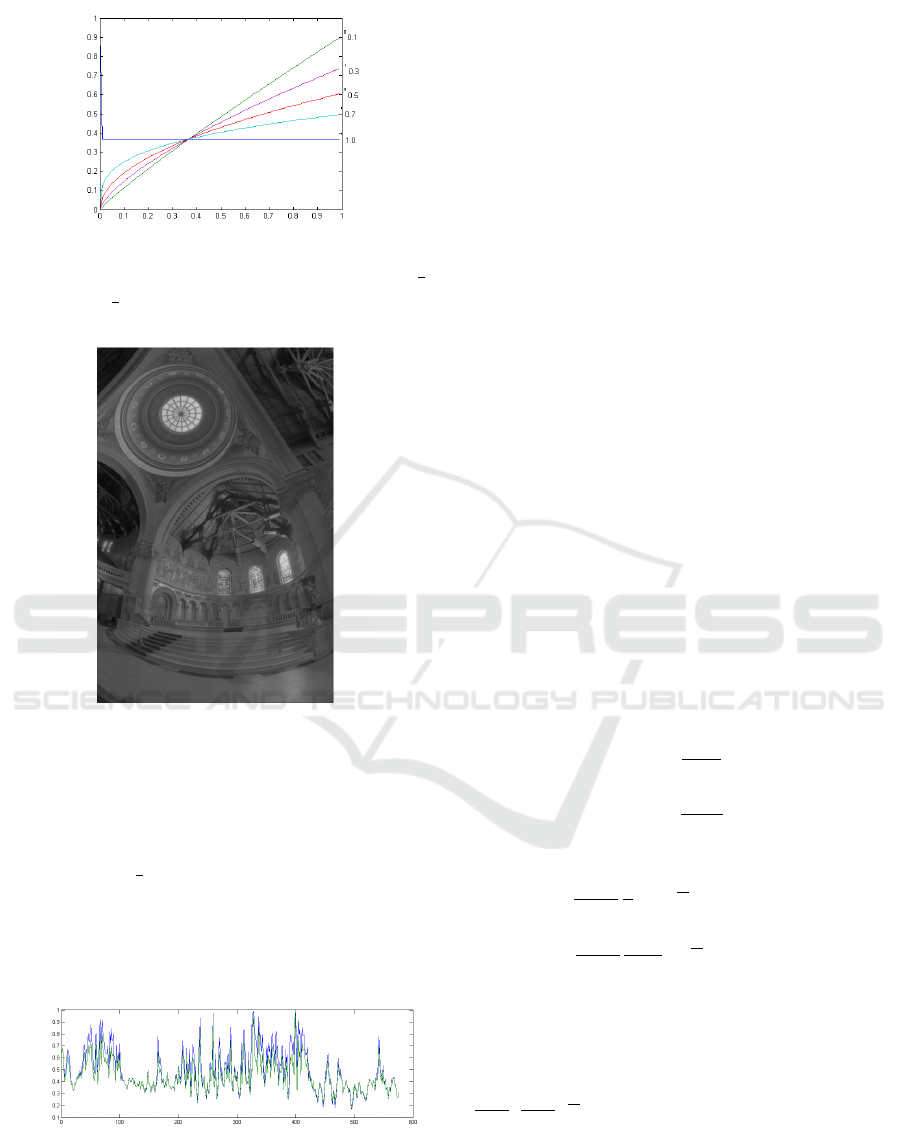
Figure 2: Plot of A
L,C
(L); for C = 0.1, 0.3, 0.5, 0.7 and 1.0
(indicated on the right). In each case, A
L,C
(L) > L if L <
1
e
and viceversa;
1
e
is a fixed point for each C.
Figure 3: Result of the application of the gamma variant
technique A
L,C
(l) to image in Figure 1.
the range and Q an inner quasirange of the windowed
data (A. Restrepo and de la Vega, 1995). The maps
shown in the figure darken light pixels (those with lu-
minances above
1
e
,) and viceversa; this type of behav-
ior is apropriate since, in HC images, both dark and
light gray levels tend to cluster.
The 1D version of the technique performs as
shown in Figure 4.
Figure 4: Application of the gamma variant technique
to the column number 550 of the McGill-texture image
merry-mexico0140.tif; original signal in green and contrast-
enhanced signal in blue.
3 A TYPE OF UNSHARP
MASKING FOR BOUNDED
SIGNALS
A more direct approach to contrast enhancement
along the lines of the technique of variant gamma cor-
rection described in the previous section is as follows;
unlike more standard techniques for contrast enhance-
ment, it explicitly takes into account that the magni-
tude being processed is bounded. Consider a fam-
ily of increasing maps f
l
: [0,1] → [0,1] with f(0)=0,
f(1)=1. Then, for each pixel luminance l, depending
on the local luminance L, one of the maps in the fam-
ily of tone maps is applied, and the corrected lumi-
nance f
L
(l) results. The chosen map f
L
(l) is such
that it has a large slope for pixel luminances l near
the local luminance L; in this way, small contrast is
amplified. Each map f
l
: [0,1] → [0,1] in the fam-
ily is a continuous function and moreover f
L
(L) = L,
so that it fixes local luminance; also, it has a convex
derivative f
0
L
and f
0
L
(l) has a maximum at l = L, in-
creasing small contrast for luminances l near the lo-
cal luminance L. The requirement that the functions
be strictly increasing ensures that luminances (even
those far off the local luminance) do not cluster near
0, 1 or any other intermediate level. The methodology
can be catalogued as one of unsharp masking, even if
of a special type, specifically designed to be applied
to signals that live in the interval [0, 1].
In particular, consider the following family of
functions
f
L
(l) = l + h
1
(
l − L
L
), l ∈ [0,L] (1)
f
L
(l) = l + h
2
(
l − L
1 − L
), l ∈ [L,1] (2)
where the functions h
1,2
and are given by
h
1
(x) =
−c
MAX
l
3
(−x)
1
2n
(1 + x), x ∈ [−1,0] (3)
h
2
(x) =
c
MAX
1 − l
3
(x)
1
2n
(1 − x), x ∈ [0,1] (4)
the functions h have infinite slope at x=0 (a re-
lated but independent approach has been used in
(Velde, 1999)); the positive integer n controls the be-
haviour near the point of infinite slope, for our pur-
poses, n=1 is enough; the constant MAX is given by
2n
2n+1
(
1
2n+1
)
1
2n
and c ∈ [0, 1] is a constant that can be
used for tuning the desired amount of masking.
The technique is of the unsharp masking type
whenever the computation of the local luminance l
involves an operation of the smoothing type, as it is
usually the case (location estimators are usually con-
sidered as smoothers even though this is discussable).
VISAPP 2009 - International Conference on Computer Vision Theory and Applications
30
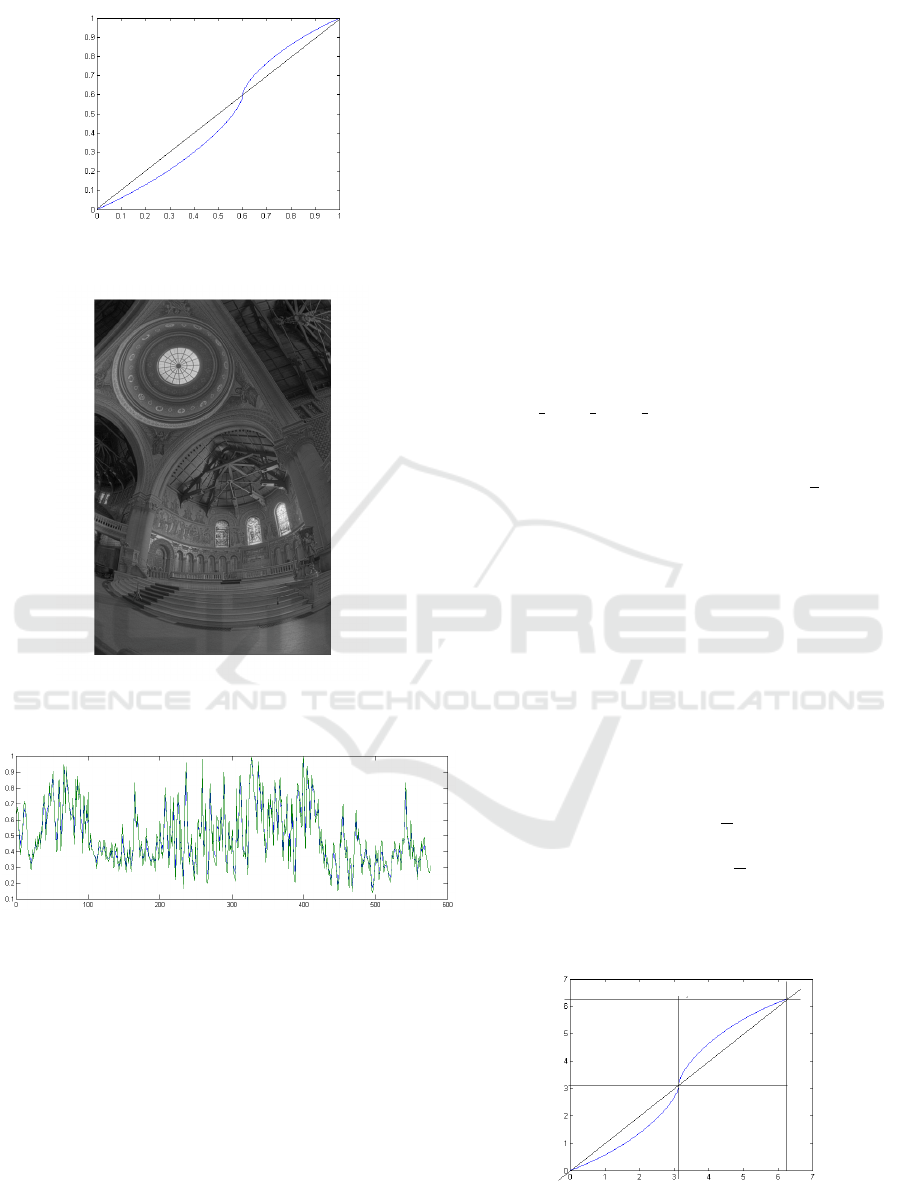
Figure 5: c=0.5, n=5, l=0.6.
Figure 6: The image in Figure 1, after the application of
bounded unsharp masking; c=0.3, n=1.
Figure 7: Application of the unsharp masking technique
to the column number 550 of the McGill-texture image
merry-mexico0140.tif; original signal in green and contrast-
enhanced signal in blue.
The difference between the signal and the smoothed
version is amplified accordingly. Figure 6 shows an
example of the application of the technique to the im-
age in Figure 1.
4 UNSHARP MASKING FOR
CIRCULAR SIGNALS
The angular hue variable h of the hsv color system
measures 0 degrees for RGB = 100, 120 degrees for
RGB = 010 and 240 degrees for and RGB = 001;
nevertheless, for better uniformity, yellow not being
a binary color (it is possible to talk of unique yel-
low,) the perceptual difference between red and yel-
low and that between yellow and green, are the same
as those between green and blue, and blue and red.
Thus, we transform the hue variable h of the hsv
and hsl systems to a modified hue H, also circular,
as follows. For angles h between 0 and (2/3)P, put
H=(3/2)h while for angles h between (2/3)P and 2P,
put H=(3/4)h + (1/4)2P. It is also convenient to de-
note each angle x with the complex number e
jx
, where
e
j0
,e
j2P
1
4
,e
j2P
1
2
,e
j2P
3
4
represent the basic hues red,
yellow, green and blue, respectively, and where the
binary hues are correspondingly in between, e.g. the
oranges are of the form e
jw
with 0 < w <
P
2
.
For the enhancing of hue contrast, the hue H of
each pixel is mapped to a hue m
t
(H); the function m
t
depends on the local hue t, which is computed using
e.g. the circular average or a circular median, (when
they exist, see (Mardia and Jupp, 2000) and (Restrepo
et al., 2007)) of the hues in the window. Here, we
use the circular mean. The map m
t
(H) has infinite
“slope” at the local hue t; in this way, the variations
of hue near the local hue are amplified. m
t
is defined
on the basis of a continuous, increasing function f :
[0,2P] → [0, 2P] with f (0) = 0, f (2P) = 2P, f (P) = P
such that the derivative of f is maximal at P. with
infinite slope at P given by
f (x) = x − cx(P − x)
1
2n
, x ∈ [0,P] (5)
f (x) = x + c(2P − x)(x − P)
1
2n
, x ∈ [P,2P] (6)
where the constant c ensures that f’ is positive every-
where.
Figure 8: n=1, c=.3; consider the rectangle [0, 2P]×[0, 2P]
as a torus split along a meridian and a longitude.
HSV-DOMAIN ENHANCEMENT OF HIGH-CONTRAST IMAGES - Power Laws and Unsharp Masking for Bounded
and Circular Signals
31
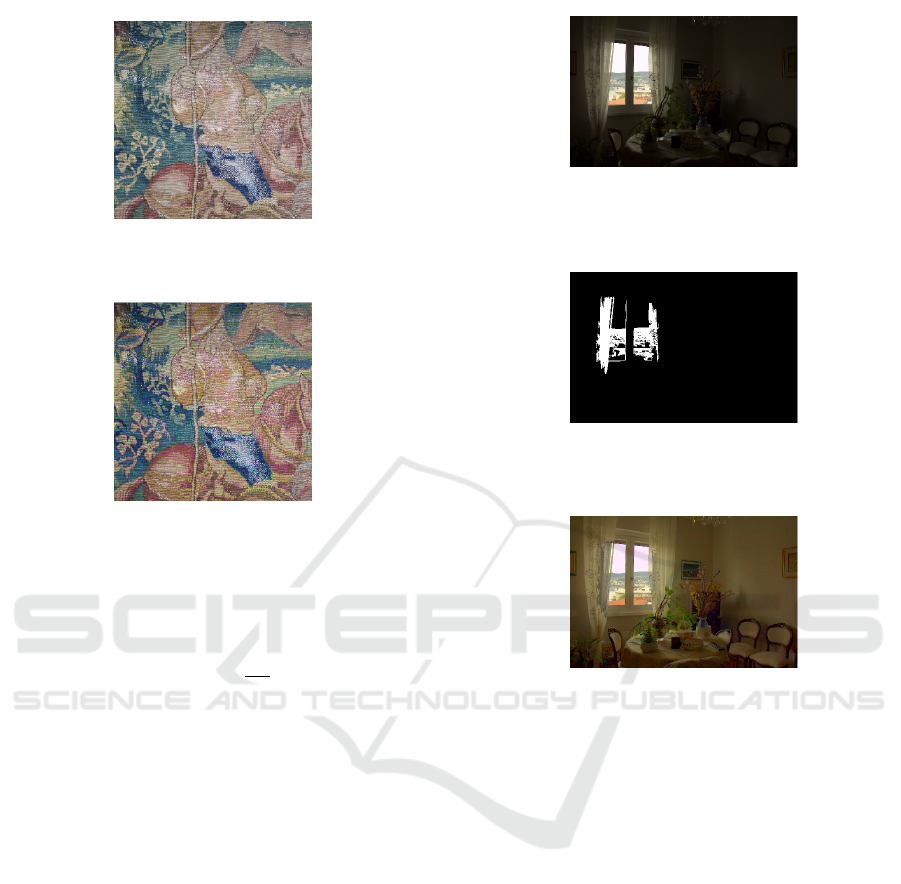
Figure 9: Image of a faded tapestry.
Figure 10: Chroma processing of the image in Figure 9;
saturation processing with g = 0.7 and hue processing with
c=0.3, n=1.
Now, for each t, let m
t
: S
1
→ S
1
(S
1
:=
{
z ∈ C :
|
z
|
= 1
}
is the unit circle) be the function
given by m
t
(H) = −e
jt
e
j f (∠
e
jH
−e
jt
)
where ∠z stands
for the angle of the complex number z. This effec-
tively implements a circular map,whose graph lives
on the torus S
1
× S
1
, that has infinite derivative at
t. It fixes local hue: m
t
(t) = t and has a convex
derivative m
0
t
; m
0
t
(H) is maximal at H = t, and min-
imal and smaller than one, at the opposed hue. As
in the previous section, the methodology presented is
of the unsharp masking type, circular in this case; the
technique compares well with that in (Restrepo et al.,
2008).
5 POWER-LAW LUMINANCE
AND SATURATION
ENHANCEMENT OF HC
IMAGES
Consider the enhancement of the HC image shown in
Figure 11.
Since it can be argued that the corrections needed
depend on the level of radiance coming from each
part in the 3D scene, rather than making corrections
to the image on the basis of pointwise luminance, we
Figure 11: An image of high contrast, resulting from a high
dynamic radiance scene.
Figure 12: The image is segmented into light and dark re-
gions.
Figure 13: The image in Figure 11, after adaptive saturation
and value enhancement.
segment the image using a standard region-growing
routine (Kroon, 2008) into light and dark regions and
apply a correction that depends on the region. See
Figure 12.
We use power laws on the saturation and value
components of the image. For saturation enhance-
ment, we used the exponents 0.95 (a slight adjust-
ment) and 0.7 for the clear and dark regions, respec-
tively. For the luminance component V, we applied
no correction in the light region and the exponent 0.5
in the dark regions. See the result in Figure 13. There
seems to be no reason to decrease the saturation at any
part of the image.
6 CONCLUSIONS
It is of value to have tools for increasing the con-
trast of signals with bounded range such as luminance
and saturation signals, and of signals with a circular
range such as hue and phase signals. The presented
VISAPP 2009 - International Conference on Computer Vision Theory and Applications
32

tools leave room for the choice of the location (lumi-
nance) and dispersion (contrast) estimators involved;
likewise, several parameters are tuned here in an ad
hoc fashion. For aesthetic reasons it may be conve-
nient to let an experienced user choose the parame-
ters; nevertheless, for the processing of large image
databases, it is convenient to use heuristics that auto-
matically determine the values of the parameters. We
are preparing a set of guidelines for automatic param-
eter selection but this is not a clear cut subject. In
(Restrepo and Ramponi, 2008) gamma is chosen so
that the correlation coefficient between luminance and
contrast is minimized. Regarding unsharp masking, if
both the V and the H components are sharpened the
image may become too crispy. The readability of an
HC image is usually improved manipulating the lu-
minance of the image; this nevertheless usually also
leads to a loss of depth (in the perceived 3D scene): a
compromise must be made.
Many continuous magnitudes in the physical
world are unbounded and linearly ordered and are
typically modeled on the real line or on the positive
real line. Transducers give bounded electrical read-
ings normally using a saturating nonlinearity. Both
bounded and circular magnitudes play an important
roles in image processing.
It is usually a fruitful strategy to simulate the
known mechanisms present in biological vision sys-
tems for their implementation in cameras and in im-
age processing software; nevertheless, it must not be
forgotten that, when seen, the image will again, in
some sense, be processed by the Human Visual Sys-
tem and there is a risk of overdoing things.
ACKNOWLEDGEMENTS
This work was partially supported by the FIRB
project no. RBNE039LLC and by a grant of the Uni-
versity of Trieste. The Ancient tapestry of Figure 9
belongs to the Museo Civico Sartorium of Trieste.
A. Restrepo is on leave of absence from the dpt. de
Ing. Electrica y Electronica, Universidad de los An-
des, Bogota, Colombia, (arestrep@uniandes.edu.co).
REFERENCES
A. Restrepo, A. Naranjo, M. V. M. D. and de la Vega, R.
(1995). Designing osed’s (order statistic edge detec-
tors). Proc. IEEE ICIP 1995, II:173–176.
Debevek, P. and Malik, J. (1997). Recovering high dy-
namic range radiance maps from photographs. SIG-
GRAPH’97, pages 369–378.
Drago, F., M. K. A. T. and Chiba, N. (1997). Adaptive log-
arithmic mapping for displaying high contrast scenes.
EUROGRAPHICS 2003, 22(3):419–427.
Kroon, D. (2008). http://www.mathworks.com/ matlabcen-
tral/fileexchange/.
Mardia, K. and Jupp, P. (2000). Directional Statistics. Wi-
ley, Chichester.
Meylan, L., Alleysson, D., and Susstrunk, S. (2007).
Model of retinal local adaptation for the tone map-
ping of color filter array images. J. Opt. Soc. Am. A,
24(9):2807–2816.
Meylan, L. and Susstrunk, S. (2006). High dynamic range
image rendering with a retinex-based adaptive filter.
IEEE trans. on Image Processing, 15(9):2820–2830.
Naka, K. and Rushton, W. (1966). S-potentials from colour
units in the retina of fish (cyprinidae). J. Physiol,
185:536–555.
Pridmore, R. W. (1999). Bezold-brucke hue-shift as func-
tions of luminance level, luminance ratio, interstim-
ulus interval and adapting white for aperture and ob-
jects colors. Vision Research, 39:3873–3891.
Restrepo, A., Marsi, S., and Ramponi, G. (2008). Chro-
matic enhancement for virtual restoration of art works.
EVA 08, Florence, April 2008, V. Cappellini and J.
Hemsley, eds.(Pitagora, Bologna):94–99.
Restrepo, A. and Ramponi, G. (”2008”). Word de-
scriptors of image quality based on local dispersion-
versus-location distributions. EUSIPCO 08, Lau-
sanne, Switzerland, August 25-29, 2008.
Restrepo, A., Rodriguez, C., and Vejarano, C. (2007). Cir-
cular processing of the hue variable: a particular trait
of image processing. Procs. VISSAP -Second Int.
Conf. on Computer Vision Theory and Applications,
Barcelona, March, 2007, 1(1):1.
Velde, K. (1999). Multi-scale color image enhancement.
IEEE Int. Conf. on Image Processing, 3:584–587.
HSV-DOMAIN ENHANCEMENT OF HIGH-CONTRAST IMAGES - Power Laws and Unsharp Masking for Bounded
and Circular Signals
33
