
AUTOMATED RISK DETECTION
What are the Key Elements Needed to Create a Multi-source, Pattern-based Risk
Detection System?
Ian Blunt, Xavier Chitnis and Adam Roberts
Healthcare Commission, Finsbury Tower, Bunhill Row, U.K.
Keywords: Information, Analysis, Risk, Regulation.
Abstract: The Healthcare Commission, the national regulator for health care in England, uses an innovative risk
detection system to target its inspections of National Health Service organisations. At the core of the
system is a tool that enables: gathering of information from a huge variety of sources, and of varying types;
mapping this information to the regulatory framework; and analysing this information in a comparable way
to detect patterns that could indicate risk. The tool has demonstrated itself to be flexible and reliable, and its
risk estimates have been consistently proven to be effective at discovering failure compared with non-
targeted inspections.
1 INTRODUCTION
From its creation in 2004, the Healthcare
Commission has always set out to be targeted and
proportionate in its work (Kennedy, 2003), relying
on intelligent use of information to guide its
inspections and reducing the regulatory burden on
well performing providers. This is in line with
modern regulatory thinking in the UK, which
advocates a risk-based approach to regulation
(Office for Public Sector Reform, 2003). Clearly,
this puts a focus on obtaining high quality
information, and managing and using it
appropriately.
A further change in England’s regulatory
landscape in 2004 was a move away from
performance assessment solely through key
performance indicators known as “star ratings”
(Healthcare Commission, 2005) and towards an
assessment against standards. By their nature,
standards tend to be broader and less well defined
than performance indicators. In this case, the
Standards for Better Health (Department of Health,
2004) are set at a very high level, meaning that there
is no single set of indicators that can measure them
accurately.
Our solution was to gather as many imperfect
measures as possible to try to describe performance
against the standard, while acknowledging their
imperfection by following up with inspection on
areas where our system detects risk of non-
compliance. In this way, the system produces
compliance risk estimates, not judgements. Given
that we are assessing 44 part-standards in nearly 400
organisations, a huge amount of information is
required and needs a highly sophisticated system to
manage and analyse it. This paper explores the
lessons learnt from developing that system, and the
emergent key elements that are required for any
system like this to function.
2 KEY ELEMENTS OF THE
SYSTEM
The system’s primary task is to support the
Commission’s main inspection programme, the Core
Standards Assessment, but also supports risk
targeting for many other assessments.
Through our programme of development, three
key functions of the system became clear;
1. Being able to align information (by analysis
unit)
2. Being able to map information (by analysis
topic)
3. Being able to compare multiple sources to
produce an overall result
393
Blunt I., Chitnis X. and Roberts A. (2009).
AUTOMATED RISK DETECTION - What are the Key Elements Needed to Create a Multi-source, Pattern-based Risk Detection System? .
In Proceedings of the International Conference on Health Informatics, pages 393-397
DOI: 10.5220/0001781803930397
Copyright
c
SciTePress
2.1 Structuring Information
2.1.1 Sourcing Data
One of the core principles of our risk targeting is
that we will not require any bespoke data collection,
but rely solely on existing information. Another is
that the system is opportunitistic, and does not rely
on good national coverage for inclusion. We aim to
use “everything the Commission knows” to risk
assess organisations.
Any member of staff can add data to the system,
a decision taken because we find that data are more
reliably stored if they are imported by staff using it
for their own ends, rather than hire administrative
staff solely to load data. Incoming data can come
from any source, any location, and any format,
although the majority of these arrive as spreadsheets
containing a handful of measures.
2.1.2 Formatting Data
Once data are received and assessed as fit for
purpose, they are transferred to a data template for
entry to main database.
The key unique identifier is the organisation
code (NACS code for NHS), although this could be
any consistent label to identify a specific unit of
analysis. If multiple measures have been supplied,
this is where they are divided into
value/numerator/denominator format, or category
name and rank if they are categorical. New
measures can also be created by combining separate
numerators and denominators from different sources
at this stage. The data template also stores metadata
to feed to the main database, as discussed in the next
section.
2.1.3 Storing Data & Structure
Each one of the measures described above is
referred to as an “item”, and each dataset is a “time
period” of that item which that consists of individual
“observations”, which are either a value, numerator
and denominator or a list of categories, depending
on their type. Items can have many “time periods”,
which allows us to align measures over time and
reduces the amount of metadata that have to be re-
entered.
Key meta data are information about: description
of the measure (including type, numerator and
denominator units); source details; dates that the
data relate to; audit trail data (file paths, URLs etc);
an assessment of reliability of the information; and
the “sentinel distribution” – which notes whether
high, low or extreme values should increase our
estimation of risk.
2.1.4 Handling Free Text Intelligence
As well as traditional numerical measures, the
system also makes extensive use of comments
derived from free text sources. This is an important
way of capturing input from patient groups and
including isolated, opportunitistic intelligence such
as investigation reports and information discovered
by our local staff.
This information is structured by a team of
analysts who code each comment against a
taxonomy (currently the Standards for Better
Health). As well as topic, they also assess whether
the information tells us something positive or
negative about an organisation and issues around the
reliability of the comment and the strength of
relationship between the comment and the taxonomy
element.
2.2 Mapping Information
The system is designed to analyse a range of
intelligence related to a user-created assessment
framework. The frameworks will be determined by
the goals of the assessment programme, rather than
the information available.
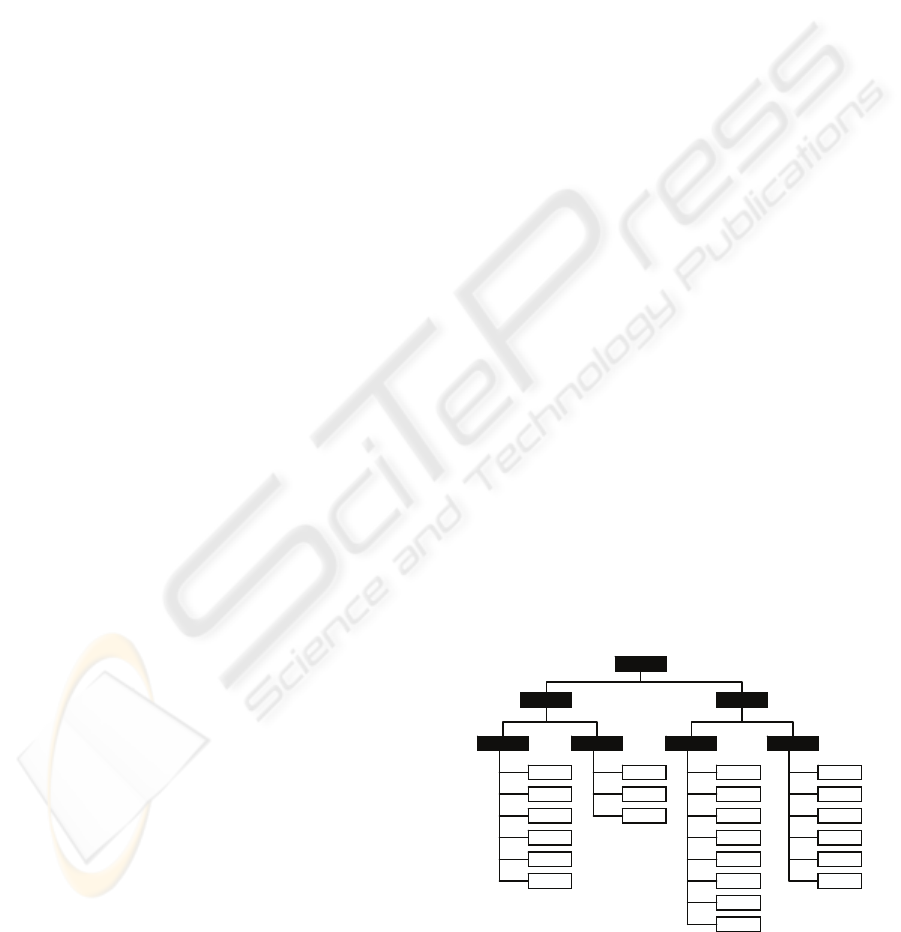
A very simple structure allows us to create item
groups (with descriptive metadata) and map items
against them to mimic these frameworks. We can
also create a multilayer framework by mapping item
groups to other item groups (a conceptual example is
shown in figure 1). The item groups can represent
any construct of the assessment framework, be it a
standard, a part standard, criteria, topic, question etc.
The system will analyse the most recent time period
available when the group result is requested.
Figure 1: Conceptual representation of a simple
framework containing items (white) and item groups
(black).
HEALTHINF 2009 - International Conference on Health Informatics
394

Clearly, some items will be more important in
the framework than others. Importance might be
due to how accurately it measures the framework
construct, the authority of the intelligence (e.g. a
formal judgement carries more weight than a data
analysis) and its “real world” value (e.g. mortality
measures should outweigh bureaucratic process
measures). Items are weighted accordingly as part
of the mapping process, and can even be given a
“super-weighting” that allows them to “trump”
everything else in group.
2.3 Analysing Information
2.3.1 Item Level
The analysis process brings together many different
types of data. For each item of information, we
assess the difference between the observed result for
a particular organisation and an expected level of
performance on a common scale using the most
appropriate analysis for that item. The outcome of
this analysis is an “oddness” score which is a
statistical measure of how far each organisation’s
performance is from the expected level for that
measure. None of our methods penalise (or reward)
organisations simply for being at the bottom (or top)
of a list - they are designed to look for genuine
differences from our expectation. It is entirely
possible that all organisations will be performing
similarly to expectation on a data item.
We make a number of “stock” analysis methods
available to the user, who will be heavily guided by
information type towards an appropriate choice.
The system will also suggest analysis settings based
on characteristics of the data.
Our analysis methods are tailored to data type
(proportions, ratios etc) and take account of the
possibility that an organisation’s results may be
affected by chance variation. To do this we use a
modified Z score (Spiegelhalter, 2005).
The expected level of performance against which
a organisation is compared can be calculated in
several ways. For some items, organisations are
compared against the national average of all
organisations. In other cases - such as waiting times
for example - an expected level of performance has
been set down for organisations in government
policies. For some data items we recognise that
organisations’ performance may be significantly
influenced by factors beyond their control. There are
two main ways we adjust for this. Either the ‘raw’
data are standardised (for example by age and sex)
before import or we may set our expectation for that
organisation as the average performance of a group
of other organisations with similar local
circumstances (referred to as the ‘benchmark
group’). We use various benchmarking groups in
our analysis, including deprivation, population
turnover and disease prevalence.
Where data are categorical, we achieve analysis
results on the common risk scale by assuming an
underlying normal distribution in the frequency data
and assessing distance between each observation and
the expectation (either an imposed target or set as
the ordinal category that contains the median
observation).
Our free text comments are scored by analysts as
discussed in section 2.1.4. These factors are then
translated into a score that is nominally equivalent to
the scores on the common risk scale.
2.3.2 Pattern Detection at Group Level
For organisations whose performance over a range
of items appears to be “oddly” poor, we infer that
there may be a risk of failure against the given
framework. However, there are many reasons why
an organisation that raises concerns in our analysis
might be found legitimately to be compliant by
inspection. The organisation will have access to
much better local sources of evidence than are
available to the Commission at a national level for
risk assessment. They will also have the benefit of
the most up-to-date information. It might also be
that, while the organisation is not performing well
compared with other organisations, they are still
meeting the minimum needed for acceptable
performance against the framework.
For each item of information, we assess whether
the organisation’s result was in line with what we
would expect, as outlined in section 2.3.1 above.
The results for all items mapped to an item group
(including qualitative information) are then
aggregated together. This produces an overall group
“oddness” score that is directly comparable to the
item oddness.
Our main method of combining the results from
each item of information is not to calculate a simple
average, but instead enables us to highlight patterns
of poor performance. For example, an item group
may be assessed as being at high risk where several
items of information are worse or tending towards
worse than expected, but none exceed the threshold
to be notable in their own right.
When combining this volume of information,
rules-based or directly weighted aggregation models
that finely balance every item against each other
become unsustainably complex. Our model uses
broad weights discussed in section 2.2 and then
automatically avoids double counting by adjusting
for the degree of auto-correlation within the item
AUTOMATED RISK DETECTION - What are the Key Elements Needed to Create a Multi-source, Pattern-based Risk
Detection System?
395
group. This allows us to include any relevant
measure without needing to consider whether it
measures the same underlying factors as other
measures.
Lastly, as the system takes item groups with
massively different amounts of information and
produces directly comparable risk estimates, we
need to consider the confidence we should have in
that risk estimate. In general, it would be
unreasonable and disproportionate to trigger an
inspection based on just one or two observations.
Other aggregation methods are also available,
which can include taking a conventional mean of
item results or counting the number of outlying
observations in each group.
2.4 Outputs
2.4.1 Selection Models
The core business output is to inform our selection
models that are run separately from the main system
to allow for swift customisation and adjustment.
However, they are all based in some way on the risk
estimates produced by Compass.
Typically selection models are either absolute, in
which any organisation with more than a certain
number of high risk item groups are inspected, or
prioritised, in which the X% most risky
organisations are selected dependent on resource
available. We have that facility to apply almost any
model that is desired by the assessment programme.
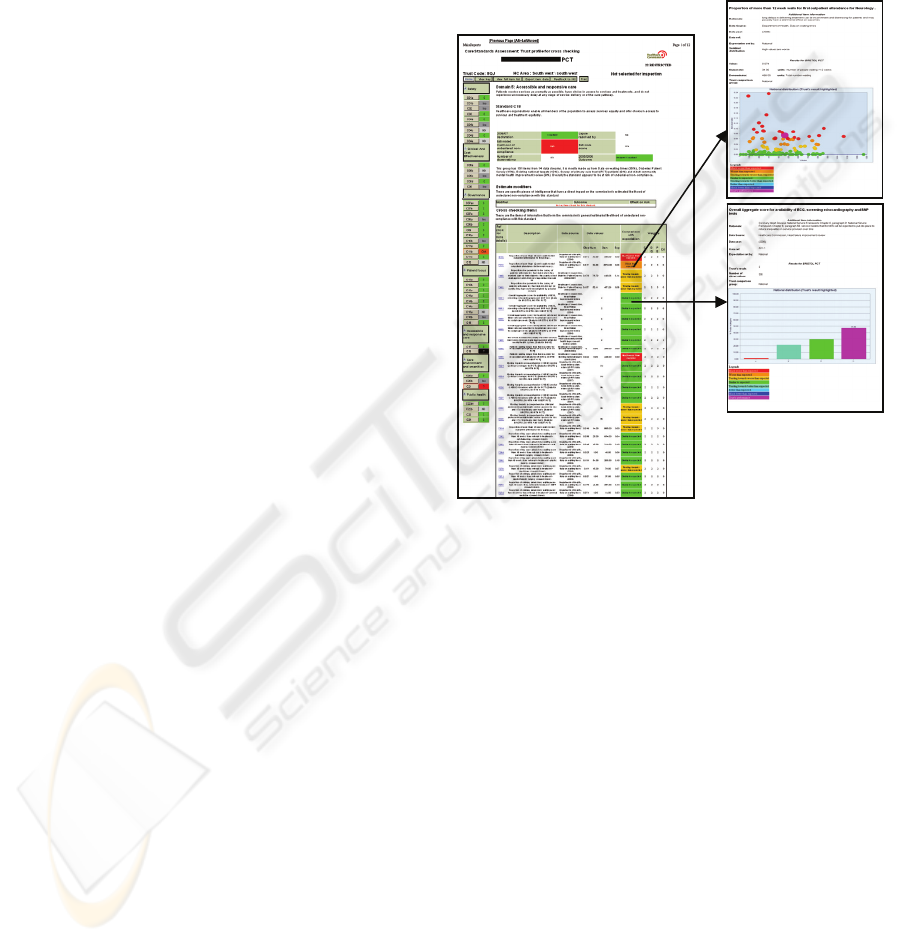
2.4.2 Presenting Results
In addition to triggering inspections, it is important
that the system can also display its results both to
help inspection staff engage with the risk assessment
and to provide an audit trail to the inspected
organisation to show that the selection was objective
and robust. We also make the results available to
the public on our website.
This is achieved with a customised reporting
tool, that takes a direct transfer from the “live”
system when a new set of results are released. A
screenshot example is shown in figure 2.
3 RESULTS AND USAGE
3.1 Core Purpose Results
Demonstrating the success of a risk targeting system
can often be problematic, as the resulting inspection
programmes tend to be entirely risk-based. Indeed,
most of our smaller reviews operate in this way.
However, our main inspection programme, the
Core Standards Assessment, contains a parallel
element of random selection, which allows us to
judge the effectiveness of our risk detection. Our
success criterion is simply that the system should
detect more non-compliance than selecting
organisations by chance alone.
Figure 2: Screenshot from our interactive reporting tool.
Users can drill down for more information on any item.
In the two years for which results are currently
available risk targeted inspections discovered twice
(2005/2006) and then three times more (2006/2007)
non-compliance than inspections selected at random
(Bardsley et al, 2008 1&2). Therefore the system
has achieved its core objective.
However, there is still scope to improve. For
example, we know that we can target some standards
more accurately than others, and this is often a
consequence of the information available.
We also know that our inspectors are
increasingly engaging with the system, as the
number of local intelligence reports submitted has
increased nearly five-fold since the first application
(1160 comments for 2005/2006 compared with 5508
for 2007/2008).
3.2 Additional Uses
Success of a system can also be measured by its
adoption in other business areas. In addition to
HEALTHINF 2009 - International Conference on Health Informatics
396

supporting most of the Commission’s NHS risk-
targeted work, the system also provides a regular
rolling update of risk status to our local staff
(independent of inspections) to prompt extra
gathering of local intelligence. The system can also
be exploited as an intelligence-base, and has
informed many other assessment programmes by
providing information but not targeting.
4 CONCLUSIONS / DISCUSSION
The system’s risk estimates have been proven to be
an effective method of targeting the Commission’s
inspections, and our approach to estimating
performance against frameworks using multiple
information sources has been validated. The success
of the system has led to wide scale adoption by the
Healthcare Commission, and it has also been used in
a number of other ways that build on the benefits of
having created such a large structured intelligence-
base.
Additionally, we believe that the range and scope
of the information that we have collected and
focused for a common purpose is unprecedented in
the field of healthcare information handling,
although several others have advocated the use of
investigating organisational performance by using
multiple measures (Yates & Davidge 1984, Harley
et al 2005).
One important innovation is the integration of
quantitative and qualitative intelligence, firstly to
maximise the use we make of our intelligence and
also because it has allowed our inspectors to engage
with a targeting system that some might consider
centralist. Being able to submit extra evidence to
influence the next round of risk assessment – and
seeing their input reflected – has increased their
feelings of ownership for the risk estimates that the
system produces. Another important effect has been
to help embed the approach of using data to prompt
further questions, as proposed by Lilford et al
(Lilford et al, 2004), rather than to pass judgement
directly.
This approach is extensible to any regulator
(even sectors other than health), and to any
organisation with good data on a large number of
sub-units, by applying the key elements identified in
this paper.
One of the current challenges for this approach is
to extend it to areas that are less rich with
information such as independent sector health care
and social care.
ACKNOWLEDGEMENTS
We would like to acknowledge the contributions
from many teams within the Healthcare Commission
but in particular members, past and present, of the
Screening Development Team and most notably
Martin Bardsley, David Spiegelhalter and Theo
Georghiou.
REFERENCES
Kennedy I., 2003. CHAI: A new organisation. London:
Commission for Health Audit and Inspection.
http://www.healthcarecommission.org.uk/_db/_docum
ents/04000020.pdf (accessed Sep 2008)
Office for Public Sector Reform, 2003. Inspecting for
Improvement. London: Office for Public Sector
Reform.
http://archive.cabinetoffice.gov.uk/opsr/documents/pdf
/inspecting.pdf (accessed Dec 2007)
Healthcare Commission, 2005. NHS Performance Ratings
2004/2005 London: Healthcare Commission.
http://www.healthcarecommission.org.uk/_db/_docum
ents/04018745.pdf (accessed Sept 2008)
Department of Health, 2004.. National Standards, Local
Action: Health and Social Care Standards and
Planning Framework 2005/6-2007/8. London:
Department of Health.
http://www.dh.gov.uk/en/Publicationsandstatistics/Pub
lications/PublicationsPolicyAndGuidance/DH_408605
7 (accessed Dec 2007)
Spiegelhalter D J., 2005. Funnel plots for institutional
comparisons. Statistics in Medicine, 24:1185-1202.
Bardsley M, Spiegelhalter DJ, Blunt I, Chitnis X, Roberts
A, Bharania S., 2008. Using routine intelligence to
target inspection of healthcare providers in England.
Quality and Safety In Health Care, In publication.
Bardsley M., Blunt I., Chitnis X., Spiegelhalter D., 2008.
Which NHS trusts get inspected by the Healthcare
Commission? (an update). International Forum on
Quality and Safety, Paris, France, April 2008
Yates J.M., Davidge M.G., 1984.. Can you measure
performance? British Medical Journal
1984;288:1935–6.
Harley M, Mohammed MA, Hussain S, Yates J, Almasri
A., 2005. Was Rodney Ledward a statistical outlier?
Retrospective analysis using routine hospital data to
identify gynaecologists performance. British Medical
Journal 2005;330:929-32
Lilford R., Mohammed M.A., Speigelhalter D., Thomson
R., 2004. Use and misuse of process and outcome data
in managing performance of acute medical care:
avoiding institutional stigma. Lancet 2004;363:1147-
54.
AUTOMATED RISK DETECTION - What are the Key Elements Needed to Create a Multi-source, Pattern-based Risk
Detection System?
397
