
ASSESSING THE VARIABILITY OF INTERNAL BRAIN
STRUCTURES USING PCA ON SAMPLED SURFACE POINTS
Darwin Mart
´
ınez
1,2
, Isabelle Bloch
1
and Jos
´
e Tiberio Hern
´
andez
1
1
TELECOM ParisTech (ENST) - CNRS UMR 5141 LTCI, Paris, France
2
Universidad Los Andes - Imagine Team, Bogot
´
a, Colombia
Keywords:
Anatomical variability, MRI images, Brain structures, Principal component analysis.
Abstract:
In this paper we propose to analyze the variability of brain structures using principal component analysis
(PCA). We rely on a data base of registered and segmented 3D MRI images of normal subjects. We propose to
use as input of PCA sampled points on the surface of the considered objects, selected using uniformity criteria
or based on mean and Gaussian curvatures. Results are shown on the lateral ventricles. The main variation
tendencies are observed in the orthogonal eigenvector space. Dimensionality reduction can be achieved and
the variability of each landmark point is accurately described using the first three components.
1 INTRODUCTION
Assessing the variability of natural objects has been
the purpose of many works in different domains. Con-
cerning human beings, the analysis of the variabil-
ity of morphological or functional features permits
a better description of the human body and its vari-
ous components, a categorization of populations, and
a study of differences between normal and patholog-
ical cases. The variability can be assessed from sev-
eral sources, such as morphometric measurements or
medical imaging. Conversely, in medical imaging,
variability has also been used to guide segmentation
and recognition applications in several works, for in-
stance based on shape and appearance models (Hill
et al., 1996; Cootes et al., 2001; Larsen and Hilger,
2003).
In this paper, we address the question of shape
variability of normal internal brain structures, ob-
served in 3D magnetic resonance imaging (MRI).
The proposed framework relies on a surface-based
representation of different samples of a given struc-
ture, leading to a matrix of landmark points, which
is further analyzed using principal component analy-
sis (PCA). This approach departs from similar works,
where PCA is typically applied to distance maps char-
acterizing the shapes (see e.g. (Pohl et al., 2004),
among others). As an example, results are illus-
trated on the left ventricle, which presents an impor-
tant inter-subject variability.
This paper is organized as follows. In Section 2
we summarize some related works about the variabil-
ity measurements in human body and in other con-
texts. In Section 3 we address the representation is-
sues. Two surface sampling methods are proposed,
one relying on a regular subdivision of space, and one
based on maximum curvature points. In Section 4
the estimation of the variability in a population us-
ing PCA is described. In Section 5 results on the left
ventricles are provided and analyzed.
2 RELATED WORKS
Studying the variability of a structure from a set of in-
stances of this structure allows us to characterize the
diversity in this set. This estimation can be made us-
ing different techniques based on the analysis of some
features of the structure to be analyzed.
In this paper we focus on human anatomical struc-
tures. However, inspiration can also be found in other
domains of application.
2.1 Variability in Human Body
Many works aim at measuring the differences in the
human body, usually focusing on specific organs. The
objective can be to describe the normal anatomy along
with its potential variations within a population, or to
172
Martínez D., Bloch I. and Hernández T. (2009).
ASSESSING THE VARIABILITY OF INTERNAL BRAIN STRUCTURES USING PCA ON SAMPLED SURFACE POINTS.
In Proceedings of the Fourth International Conference on Computer Vision Theory and Applications, pages 172-179
DOI: 10.5220/0001790801720179
Copyright
c
SciTePress

assess the presence of some abnormality indicating
some diseases.
In this section, we mention a few examples of
works in this domain, with the aim of illustrating the
variety of addressed problems. This list is of course
far from being exhaustive.
In (Suinesiaputra et al., 2004) the authors model
the myocardial contractility using independence com-
ponent analysis (ICA) in order to identify the dys-
functional myocardium. The authors present a model
of the two contours at distinct times (systole and di-
astole) to create a set of points in the middle of the
contours in order to perform the measurements with
ICA.
In (L
¨
otj
¨
onen et al., 2004) the authors model the
atria, ventricles and epicardium of the heart in a 3D
shape, as a combination of short and long axis car-
diac MR images. For this task the authors use a cor-
respondence voxel by voxel and then construct a set
of landmarks from the surface of the objects which
are used as input to PCA and ICA algorithms in order
to compute the shape variation.
In (Taron et al., 2007) the authors model the left
ventricle as a thin plate spline. An additional esti-
mation of registration uncertainties is included in the
model before applying ICA to capture the variations.
In the work of (Berar, 2007) PCA is used to per-
form a statistical reconstruction of skull and face. Us-
ing PCA in combination with a feature space repre-
sentation then produces a skull facial partial recon-
struction.
In (Nain et al., 2007), the authors present a new
strategy for multiscale shape representation and seg-
mentation of internal brain structures, in particular
caudate nucleus and hippocampus. The shape repre-
sentation is based on conformal mapping and spher-
ical wavelets adapted to a given population. Shape
variations are determined using a spectral partition-
ing of coefficients. The experimental results show the
power of this approach for capturing shape details and
integrating the model in a segmentation framework.
In a different domain, in (Bai et al., 2007) the au-
thors present ICA as a feature to find a similarity met-
ric between different sets of fMRI, and the indepen-
dent components are then used to describe the highly
activated regions. In this way, the similarity between
sets is evaluated as the value of the maximum size of
overlap between regions corresponding to activation
maps.
All these works show how different types of fea-
tures are studied in order to keep the most represen-
tative data set, which is enough to evaluate the differ-
ences between elements. The selection of the repre-
sentative set is an important step for posterior assess-
ment.
2.2 Variability in other Image
Applications
Let us now briefly mention a few other examples, in
other application domains.
In (Ekenel and Sankur, 2004) the authors focus on
the problem of feature selection for face recognition
and they propose a method to examine the subsets of
ICA and PCA features in order to increase recogni-
tion performance. For PCA they take the eigenvalues,
while for ICA they made some tests in order to select
the most descriptive/difference features.
In (Yang and Ding, 2002) the authors use a com-
bination of PCA and a symmetry plane (mirror) to
search the faces in a series of images. They divide the
space based on the mirror of the faces and apply PCA
to characterize the important elements in the face and
define the variations modes of each side.
In (Rogez and Orrite, 2005) the authors use ICA
and PCA in order to compute the variations of the hu-
man figure, and they model the human body as the
contour of the silhouette. Then they construct a mean
shape and use it as basis to find the differences of the
silhouette.
These studies present the analysis of variability
using the combination of PCA and ICA to identify the
sources of variation from global context using PCA
and local context using ICA. The studies show clearly
the difficulty to select the correct number of variation
modes in ICA.
In summary, there are two main aspects to con-
sider:
1. Shape representation: a concise representation
scheme has to be determined that will allow a
comparison between different individuals based
on the represented shape.
2. Analysis technique: it should make it possible to
characterize and localize the shape variability in
the studied family, in such a way that a new indi-
vidual can be characterized based on that analysis.
3 SHAPE REPRESENTATION
In our experiments, we use the MRI images of the
IBSR database
1
, which contains a set of images from
1
Internet Brain Segmentation Repository. The MR
brain data sets and their manual segmentations were
provided by the Center for Morphometric Analysis at
Massachusetts General Hospital and are available at
http://www.cma.mgh.harvard.edu/ibsr/
ASSESSING THE VARIABILITY OF INTERNAL BRAIN STRUCTURES USING PCA ON SAMPLED SURFACE
POINTS
173
18 normal subjects, and for which a segmentation of
the main anatomical structures is available.
From these segmented images, we select one
structure of interest that will be subject to variabil-
ity analysis. For illustration purposes, we consider
the left lateral ventricle as a typical example (see Fig-
ure 1).
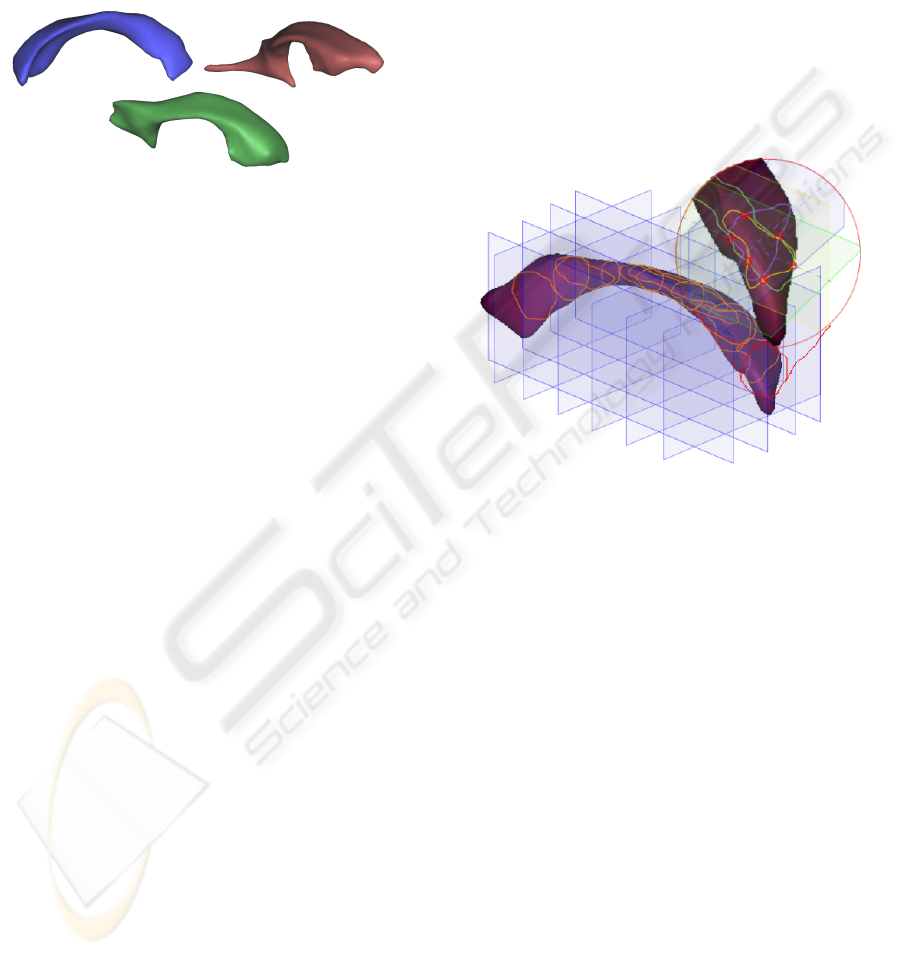
Figure 1: Left lateral ventricles from three different subjects
of the IBSR database, illustrating the variability of the shape
of this structure.
The first step in our approach consists in con-
structing the set of elements on which PCA will be
applied. These elements are points of the object un-
der study (i.e. one particular anatomical structure),
observed on several subjects. They should be a good
representation of the shape of the object. In this sec-
tion, we describe the chosen representations.
Usually, a representation is chosen according to
one or several criteria, such as expressiveness of the
representation (information it provides, precision of
the description), possibility of reconstructing the ob-
ject, and complexity of the representation (costs it in-
duces on storage space and computation time).
For our application, we need a representation of
3D objects that has a reasonable size, while preserv-
ing the information quality. This issue is particularly
important in medical imaging. The MRI images used
in this work have a spatial resolution of about 1mm
3
and contain about 8.10
6
points. Even if a particular
anatomical structure only occupies a restricted part of
this volume, the amount of data to be processed in-
creases rapidly. This is amplified here by the fact that
several images of different subjects are used in each
computation step. This advocates for a sampling of
the objects in order to derive the representation.
Since we are dealing with simply connected ob-
jects, which are adequately represented by their sur-
face, we choose a surface sampling approach. The
gain in the representation, with respect to volumetric
sampling, depends on the shape of the object (high for
a spherical object, low for an almost linear one), but
is in all cases appreciable.
In this paper, we propose to use two types of sam-
pling. The first one relies on a systematic and regular
decomposition of the space, while the second one is
shape-dependent and relies on high curvature points.
We denote by S
i
the surface of a given structure in
image i (i = 1..M), and by x
j
i
the jth sampled point on
S
i
( j = 1..N). The matrix X = ((x
j
i
)) will be the input
of PCA (see Section 4).
3.1 Description based on Regular Grid
This approach relies on a simple regular subdivision
of the bounding box of S
1
. The landmark points x
j
i
are
then defined as the intersections between the planes
defining the subdivision and S
1
. This is illustrated in
Figure 2.
Figure 2: Regular grid subdivision of the bounding box of a
structure and induced surface sampling.
These points are then projected on the other exam-
ples of the structures S
i
, for i = 2..M, using the ICP
method (Besl and McKay, 1992). This guarantees a
good correspondence between x
j
i
and x
j
i
0
for all j and
all examples S
i
and S
i
0
. This correspondence is re-
quired in order to be sure that the variability analysis
is based on similar features.
3.2 Curvature-based Description
The second approach we propose is to build the de-
scription from remarkable points on the surface, de-
rived from curvature information. This approach is
similar to the one developed in (Moreno et al., 2007;
Moreno et al., 2008) for constrained registration of
lung images. It is motivated by the fact that points
with high curvature are particularly relevant for de-
scribing a shape and distinguishing between different
shapes. We argue that they are also relevant for de-
scriptions aiming at variability analysis.
The proposed procedure is as follows. The Gaus-
sian and mean curvatures (defined as the product and
the average of the principal curvatures, respectively)
VISAPP 2009 - International Conference on Computer Vision Theory and Applications
174
are computed at all points of S
i
. This computation
is based on a finite difference approximation of the
derivatives.
Then two ordered lists of points are built, with
decreasing absolute value of Gaussian (respectively
mean) curvature.
Landmark points are selected starting from the
highest curvature points, by picking alternatively
from the two ordered lists. An additional constraint
is added in order to have an almost uniform distri-
bution on the surface: a point is selected only if its
distance to already selected points exceeds some pre-
set threshold. The distance is computed conditionally
to the surface (i.e. geodesic distance), using a prop-
agation method, like the classical chamfer algorithm
(Borgefors, 1986), adapted to the geodesic case (the
masks defining the local distances and used for prop-
agation are restricted to the surface points at each po-
sition during the propagation).
In order to deal with potentially flat areas, zero
curvature points are considered as well, so as to guar-
antee the uniformity constraint. The results on one
example are displayed in Figure 3.
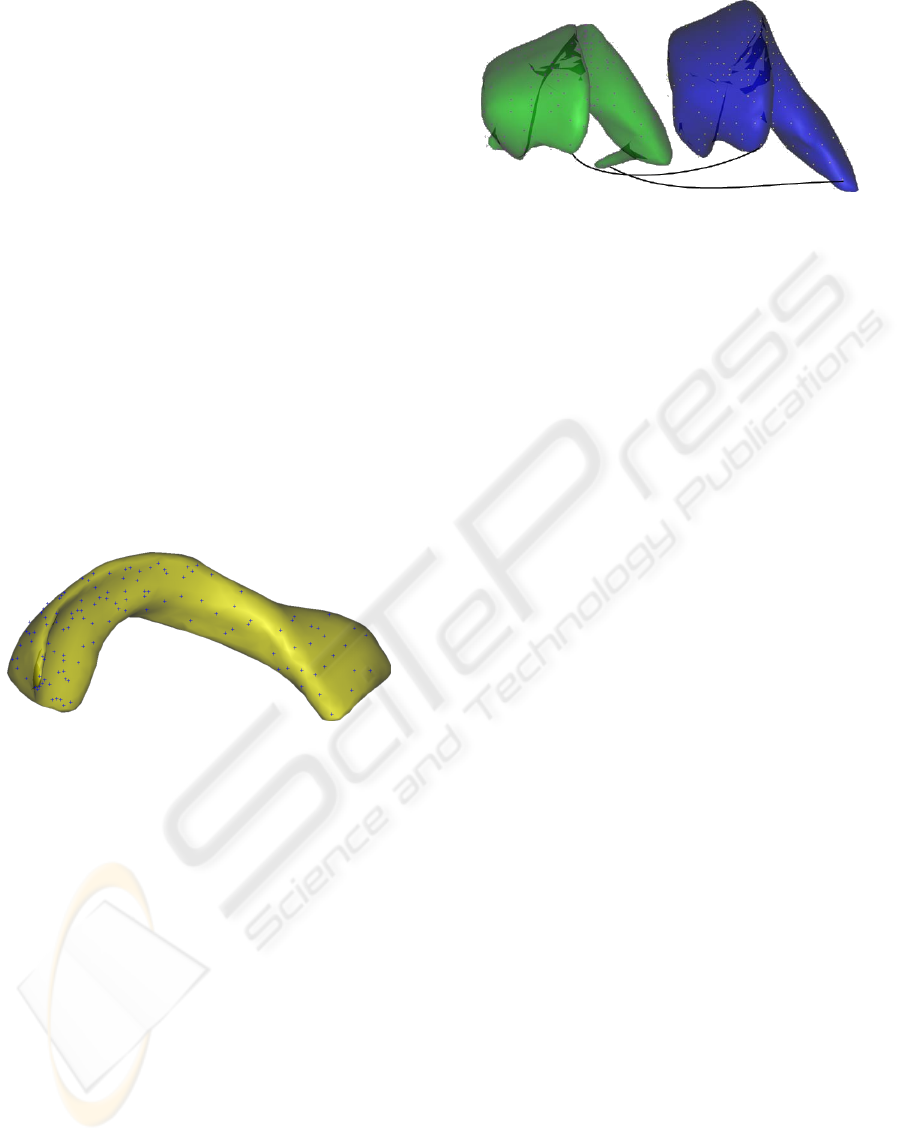
Figure 3: Distribution of points based on curvature calculus.
Finally, the selected points x
j
1
, j = 1..N are used
to find the corresponding points of the other exam-
ples S
i
, i 6= 1, again using the ICP method. It should
be noted that the projected points do not necessarily
correspond to the highest curvature points of S
i
. How-
ever, they are close to those points (see Figure 4), and
provide an appropriate representation of the shape.
The fact that similar landmark points are used in all
objects is important for the next steps, and this is guar-
anteed by the proposed approach.
The obtained landmarks provide an homogeneous
description of the shape, thanks to the distance con-
straint, and rely on significant points, thanks to the
curvature constraint. The correspondence between
these landmarks in all shape examples provides the
necessary information for variability analysis.
Figure 4: Landmark points computed on S
1
and their cor-
responding points obtained using ICP on another example
S
i
.
4 VARIABILITY MEASURES
BASED ON PCA
The choice of principal component analysis (PCA) as
a technique to model the variability among elements
of the same type is driven by its powerful feature of
proposing an order using the variance of the represen-
tative data of the examples of the analyzed set.
PCA is an orthogonal linear transformation be-
tween one data coordinate system to a new coordi-
nate system such that the new system takes advantage
of the variance associated to each axis. The compo-
nents are ordered according to the variance value and
the projections of the data on the first components ex-
press the largest variations.
The landmarks x
j
i
, for i = 1..M and j = 1..N, are
organized in a matrix X where each row X
i
is built
from the coordinates of the landmarks computed on
S
i
(i.e. each row has 3N components).
In order to minimize the variation induced by the
differences in the position (as illustrated in Figure 5)
each shape is centered: the center of gravity of each
set (x
j
i
), j = 1..N is computed and subtracted from
x
j
i
. It follows that all shapes are registered, with their
new center of gravity equal to the origin of the space.
Moreover, this also achieves the zero mean distribu-
tion constraint imposed when applying PCA. For sake
of simplicity, we still denote by X the matrix obtained
after this registration step. Figure 6 illlustrates the set
of centered structures.
The next steps consist of a classical application
of PCA: the covariance matrix of the centered data
C = XX
T
is computed. Then its eigenvectors V and
eigenvalues D are computed. The eigenvalues are
sorted in decreasing order. We denote by D
o
the vec-
tor of ordered eigenvalues and V
o
the corresponding
matrix of eigenvectors. The columns of V
o
are then
the principal components.
By analyzing the variance of each component and
its contribution to the global variation we can select
how many components should be taken into account
ASSESSING THE VARIABILITY OF INTERNAL BRAIN STRUCTURES USING PCA ON SAMPLED SURFACE
POINTS
175
to represent the variability. Usually, only a few com-
ponents are sufficient, thus leading to a reduced di-
mensionality.
Then we compute the projection of the centered
data on the new orthogonal space for each of the se-
lected components. We denote by P
k
= V
k
o
X the kth
projection where V
k
o
is the kth component of V
o
. Fi-
nally, we reconstruct the objects in the original space
by computing
˜
X
k
= P
−1
k
X for each of the selected
components. By adding again the mean value that
was subtracted during the registration step, we ob-
tain a comparable set of data. For instance, if the first
component is selected, then P
1
is the projection of the
data onto the first principal component and
˜
X
1
, which
is an M × 3N matrix, contains the projection of the
first principal component for each of the M samples.
In our experiments with 3D data, we obtain, for
each landmark and for each component of variation
mapped onto the original space, the direction and
magnitude of data variation in that direction.
5 EXPERIMENTS AND RESULTS
In this section, we illustrate the proposed approach on
the analysis of the left lateral ventricle (as illustrated
in Figure 1). We used the manual segmentations
available for the 18 examples of the IBSR database.
The images in the data base are globally registered
and have been “positionally normalized” into the Ta-
lairach orientation (rotation only). The left lateral
ventricles of the data base are shown in Figure 5. As
mentioned in Section 4, a further registration based
on a translation matching all centers of gravity is also
applied. The centered shapes are displayed in Fig-
ure 6. This registration guarantees position normal-
ization and avoids interpreting the difference in abso-
lute position as a variability factor.
Figure 5: The 18 left lateral ventricles of the IBSR database.
The general scheme of the processing is illustrated
in Figure 7. From the segmented objects, sampled
points are computed using the two methods described
in Section 3. Then PCA is applied on the resulting
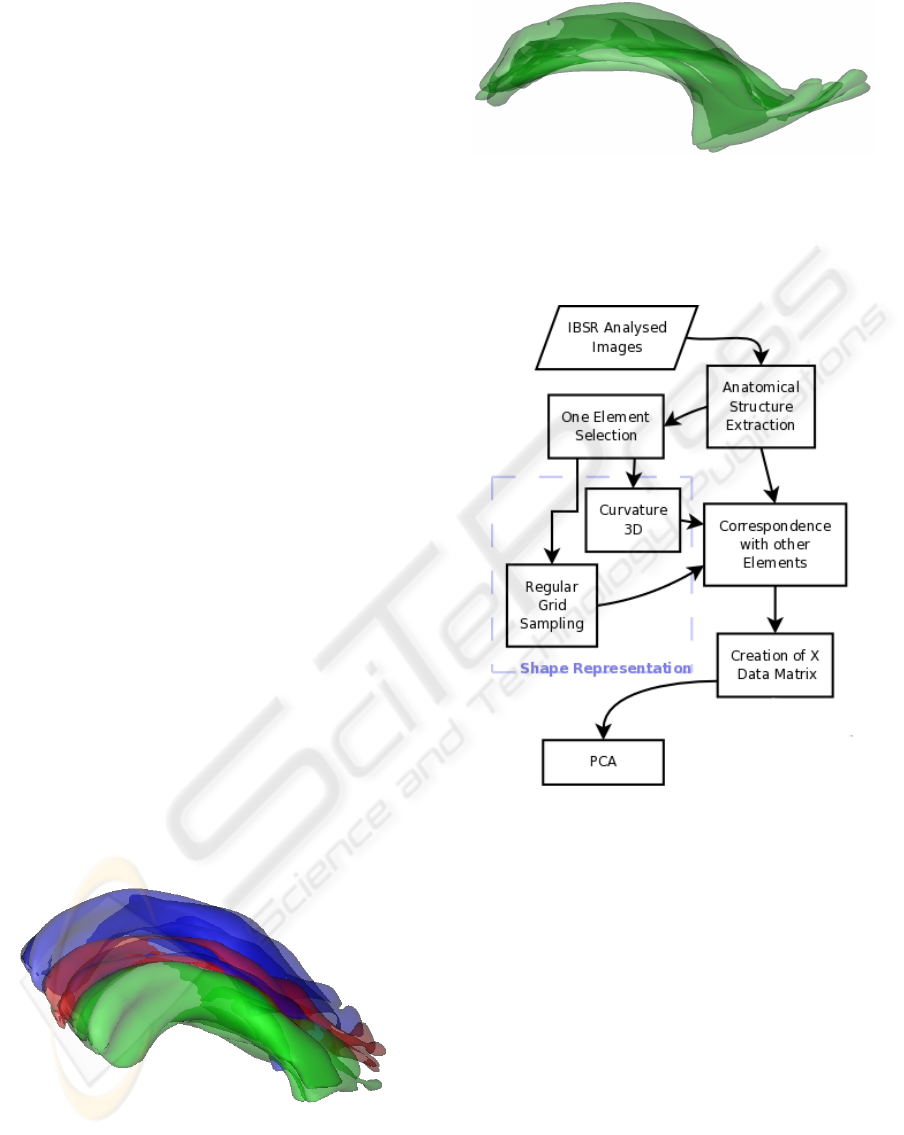
Figure 6: Set of centered structures.
matrices, as described in Section 4. The results are
analyzed based on the reconstruction using the main
components and the variance.
Figure 7: Experiment flowchart.
The results depend on the following parameters:
• density of samples;
• choice of the distribution (regular, based on cur-
vature);
• the number of main components in the reconstruc-
tion.
In order to test the shape representation ap-
proaches presented in section 3, both set of results
are presented (curvature and regular grid based mod-
els) below. The figures 8 to 12 have been obtained
with a selection of landmark points based on curva-
ture information. On the first example S
1
, 136 points
are selected according to the highest curvature and
uniformity criteria, and the corresponding points are
then computed on all other 17 examples. This re-
sults in a 18 × 408 matrix. The initial surfaces contain
VISAPP 2009 - International Conference on Computer Vision Theory and Applications
176
about 2400 points in average, which makes a density
of 0.06.
Applying the proposed approach to the left lateral
ventricle leads to the following results:
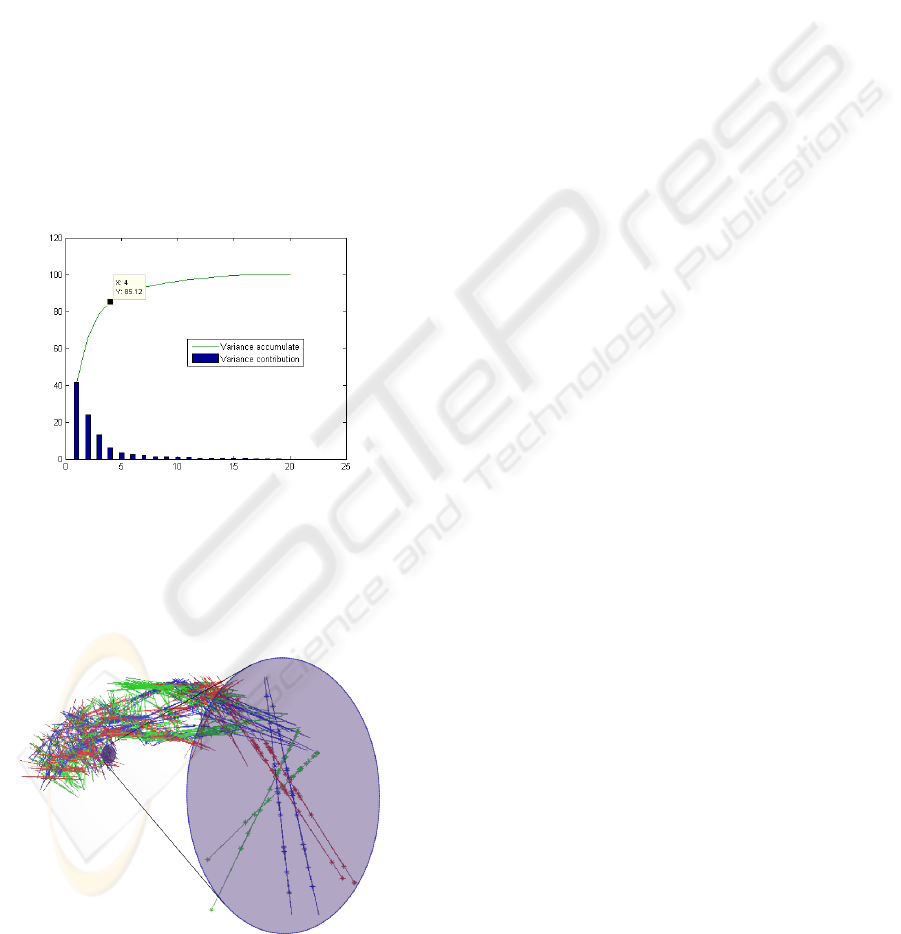
• The principal component analysis made it possi-
ble to explain 75.67% of the variation of the left
lateral ventricle (Figure 8) with only three compo-
nents.
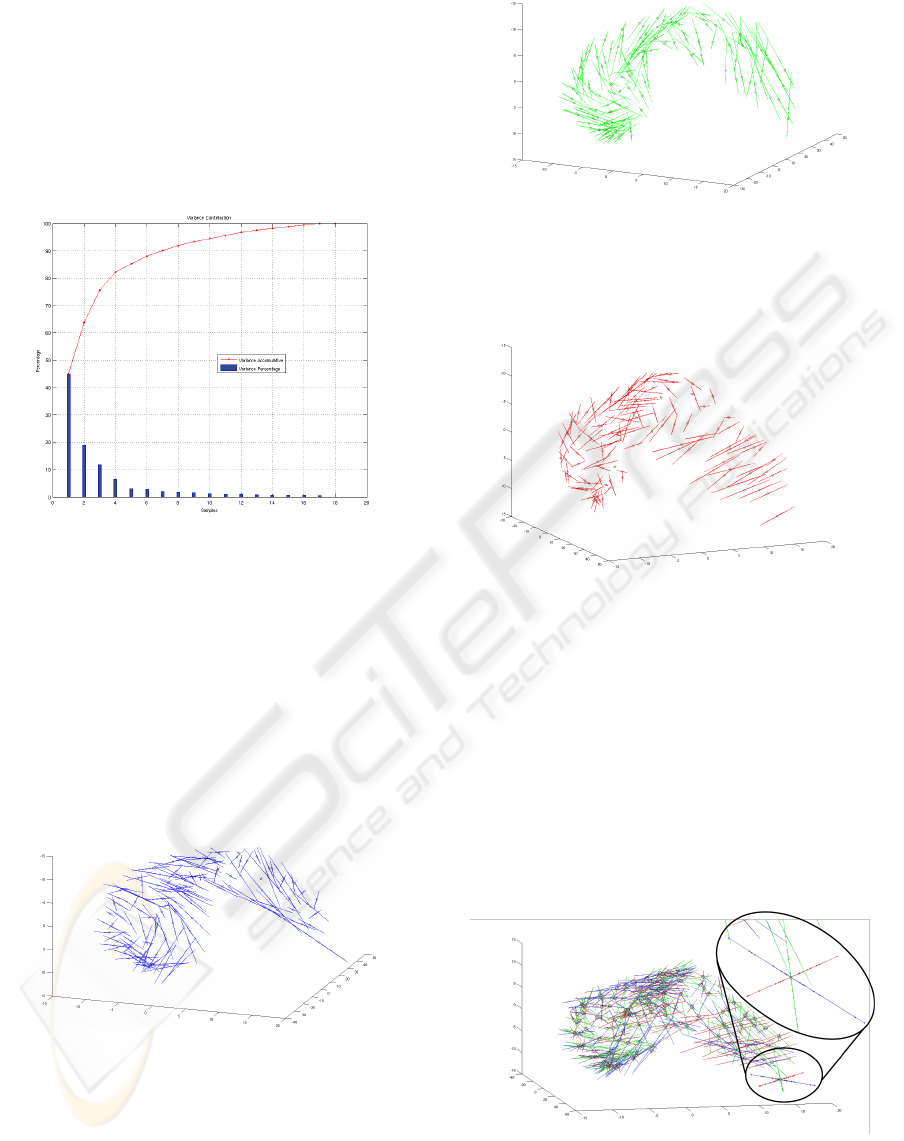
Figure 8: Variance of each of the principal components and
its contribution to the total variation.
• The first principal component represents 44.9% of
the variance in the set of shapes. Thus, with this
only component we can express almost the half of
the variance of the whole set. Figure 9 represents
the first mode of variation projected in the origi-
nal data space. Each point indicates the mean of
the landmark, while the line segments indicate the
direction and magnitude. These segments do not
exhibit strong structures, thus expressing each lo-
cal variation of the shapes.
Figure 9: First Component.
• The second principal component represents
18.94% of the variance. It is illustrated in Fig-
ure 10. It shows a kind of torsion between the
different shapes (the segments have a quite con-
sistent organization).
• The third principal component represents 11.83%
of the variance, and is shown in Figure 11. The
Figure 10: Second Component.
orientation of the segments on the right part of
the figure can be interpreted as a variance of the
global curvature of the shape.
Figure 11: Third Component.
Figure 12 presents the results of the three first
components projected in the original space. It illus-
trates the variation of all landmarks in the data set and
the representation and contribution to the variance of
each landmark to the total variation. It also shows that
all landmarks have a similar contribution to the vari-
ability and that it is difficult to assign the variation to
a particular subset of landmarks. This result was ex-
pected because PCA estimates the differences of a set
of samples (anatomical structures in this case) against
the mean values of the samples.
Figure 12: Three first components.
The zoomed area in Figure 12 shows the influence
of each component (blue: first component, green: sec-
ond component, red: third component). The inter-
ASSESSING THE VARIABILITY OF INTERNAL BRAIN STRUCTURES USING PCA ON SAMPLED SURFACE
POINTS
177
section of the three components corresponds to the
mean value of the landmark, and each little point on
the segment line represents the value of one projected
sample. This illustrates the range of variation of the
landmark and the set of points on each of the segment
lines shows an interesting distribution. We think that
it is an important characteristic that has to be evalu-
ated in the future because it can give us more specific
information about the variability in a population.
The results illustrated in the figures 13 and 14
have been obtained with a selection of landmark
points based on the regular grid division. For this ex-
ample (S
2
) 216 points are selected according of the
division by 10 of each side of the bounding box. The
point density over the surface is about 0.09% , which
is similar to the density we had in the curvature-
based point distribution. The corresponding points
are computed on all the other 17 examples, leading
to a 18 × 648 matrix to compute PCA.
Figure 13: Variance contribution using a point distribution
based on a regular grid.
The type of distribution (regular grid vs. curva-
ture based) does not affect representatively the vari-
ance contribution of the components, as shown in Fig-
ure 13. This figure is similar to Figure 8.
Figure 14: Three first components on regular grid. Zoom in
two nearest points.
Although, regular grid representation is attractive
due to its simplicity and regularity, the model presents
some disadvantages: first, it can miss some impor-
tant points (hidden points) for the shape representa-
tion and second, there is oversampling of points in
some shape sectors due to element form as is pre-
sented in Figure 14. The hidden points and oversam-
pling are risky for shape representation, and that is
why it is recommendable to use the curvature based
model and the geodesic distance on the surface, in
spite of its simplicity and computational performance
(1 / 10, regular grid / curvature).
6 CONCLUSIONS
In this paper, we have proposed a method for the study
of shape variability of anatomical structures in the hu-
man brain using information extracted from magnetic
resonance images. The main features of the method
are:
• representation of the surface of the structures, for
which two methods have been proposed for land-
mark selection, as well as a correspondence be-
tween points of different examples;
• construction of a data set with zero mean in each
sample in order to reduce the influence of position
variation between the structures;
• use of PCA as a technique of analyzing variabil-
ity;
• appropriate visualization of the results.
The experimental results show the interest of the pro-
posed approach for variability analysis and data re-
duction. In the illustrated example for the left lateral
ventricle, we could express the major contribution of
variability with only three components.
Further work aims at analyzing in more detail
the influence of the parameters of the method, and
comparing the results with those obtained using in-
dependent component analysis (Cardoso and Comon,
1996). Experiments on other brain structures will be
carried out as well. A potential application could be
to compare the observed variations in different popu-
lations (normal and pathological ones for instance).
ACKNOWLEDGEMENTS
This work has been partly supported by an ECOS-
Nord grant, Darwin Martinez is supported by a
COLCIENCIAS-Bonpland grant and Universidad de
los Andes project CIFI-56 of 2008.
VISAPP 2009 - International Conference on Computer Vision Theory and Applications
178

REFERENCES
Bai, B., Kantor, P., Shokoufandeh, A., and Silver, D. (2007).
fMRI brain image retrieval on ICA components. In
Proceedings of ENC’07, pages 10–17.
Berar, M. (2007). Mod
`
eles statistiques de la forme
d’organes du corps humain, application
`
a la recon-
struction faciale. PhD thesis, Institut National Poly-
technique de Grenoble, Grenoble, France.
Besl, P. J. and McKay, N. D. (1992). A method for regis-
tration of 3-d shapes. IEEE Transactions on Pattern
Analysis and Machine Intelligence, 14(2):239–256.
Borgefors, G. (1986). Distance transformations in digital
images. Computer Vision, Graphics, and Image Pro-
cessing, 34(3):344–371.
Cardoso, J.-F. and Comon, P. (1996). Independent com-
ponent analysis, a survey of some algebraic methods.
In ISCAS’96: 1996 IEEE International Symposium on
Circuits and Systems, volume 2, pages 93–96.
Cootes, T. F., Edwards, G., and Taylor, C. J. (2001). Active
appearance models. IEEE Transactions on Pattern
Analysis and Machine Intelligence, 23(6):681–685.
Ekenel, H. K. and Sankur, B. (2004). Feature selection in
the independent component subspace for face recogni-
tion. Pattern Recognition Letters, 25(12):1377–1388.
Hill, A., Cootes, T. F., and Taylor, C. J. (1996). Active shape
models and the shape approximation problem. Image
and Vision Computing, 14(8):601–607.
Larsen, R. and Hilger, K. B. (2003). Statistical shape analy-
sis using non-Euclidean metrics. Medical Image Anal-
ysis, 7(4):417–423.
L
¨
otj
¨
onen, J., Kivist
¨
ob, S., Koikkalainenc, J., Smuteka, D.,
and Lauermab, K. (2004). Statistical shape model of
atria, ventricles and epicardium from short- and long-
axis MR images. Medical Image Analysis, 8:371–386.
Moreno, A., Chambon, S., Santhanam, A., Rolland, J., An-
gelini, E., and Bloch, I. (2007). CT-PET Landmark-
based Registration using a Dynamic Lung Model. In
International Conference on Image Analysis and Pro-
cessing ICIAP 2007, pages 691–696, Modena, Italy.
Moreno, A., Chambon, S., Santhanam, A., Rolland, J., An-
gelini, E., and Bloch, I. (2008). Combining a Breath-
ing Model and Tumor-Specific Rigidity Constraints
for Registration of CT-TEP Thoracic Data. Computer
Aided Surgery, 13(5):281–298.
Nain, D., Haker, S., Bobick, A., and Tannenbaum, A.
(2007). Multiscale 3-D shape representation and seg-
mentation using spherical wavelets. IEEE Transac-
tions on Medical Imaging, 26(4):598–618.
Pohl, K. M., Warfield, S. K., Kikinis, R., Grimson, W. E. L.,
and Wells, W. M. (2004). Coupling statistical segmen-
tation and PCA shape modeling. In Medical Image
Computing and Computer-Assisted Intervention MIC-
CAI 2004, volume LNCS 3216, pages 151–159.
Rogez, G. and Orrite, C. (2005). Human figure seg-
mentation using independent component analysis. In
IbPRIA Pattern Recognition and Image Analysis, vol-
ume LNCS 3522, pages 300–307.
Suinesiaputra, A.,
¨
Uz
¨
umc
¨
u, M., Frangi, A., Kaandorp, T.,
Reiber, J., and Lelieveldt, B. (2004). Detecting re-
gional abnormal cardiac contraction in short-axis MR
images using independent component analysis. In
Medical Image Computing and Computer-Assisted In-
tervention, volume LNCS 5032, pages 737–744.
Taron, M., Paragios, N., and Jolly, M.-P. (2007). From un-
certainties to statistical model building and segmen-
tation of the left ventricle. ICCV 2007. IEEE 11th
International Conference on Computer Vision, pages
1–8.
Yang, Q. and Ding, X. (2002). Symmetrical PCA in face
recognition. In International Conference on Image
Processing, volume 2, pages 97–100.
ASSESSING THE VARIABILITY OF INTERNAL BRAIN STRUCTURES USING PCA ON SAMPLED SURFACE
POINTS
179
