CLASSIFYING AND COMPARING REGULAR TEXTURES FOR
RETRIEVAL USING TEXEL GEOMETRY
Junwei Han and Stephen J. McKenna
School of Computing, University of Dundee, Dundee, DD1 4HN, U.K.
Keywords: Regular texture, Texel geometry, Texel classification, Texel comparison.
Abstract: Regular textures can be modelled as consisting of periodic patterns where a fundamental unit, or texel,
occurs repeatedly. This paper explores the use of a representation of texel geometry for classification and
comparison of regular texture images. Texels are automatically extracted from images and the distribution
of texel shape and orientation is modelled. The application of this model to image retrieval and browsing is
discussed using examples from a database of art and textile images.
1 INTRODUCTION
Regular textures can be modelled as consisting of
periodic patterns where a fundamental unit (texel)
occurs repeatedly. Texture periodicity analysis has
attracted much attention recently and has been used
for texture tracking (Lin et al., 2007), synthesis
(Charalampidis, 2006), and retrieval (Liu et al.,
1996; Lin et al., 1999; Lee et al., 2005).
In common with much of the previous work, this
paper focuses on the study of so-called wallpaper
patterns. There exist 17 wallpaper groups which
together account for all patterns generated by two
linearly independent vectors (Liu et al., 2004). Here,
regular textures generated by translation only are
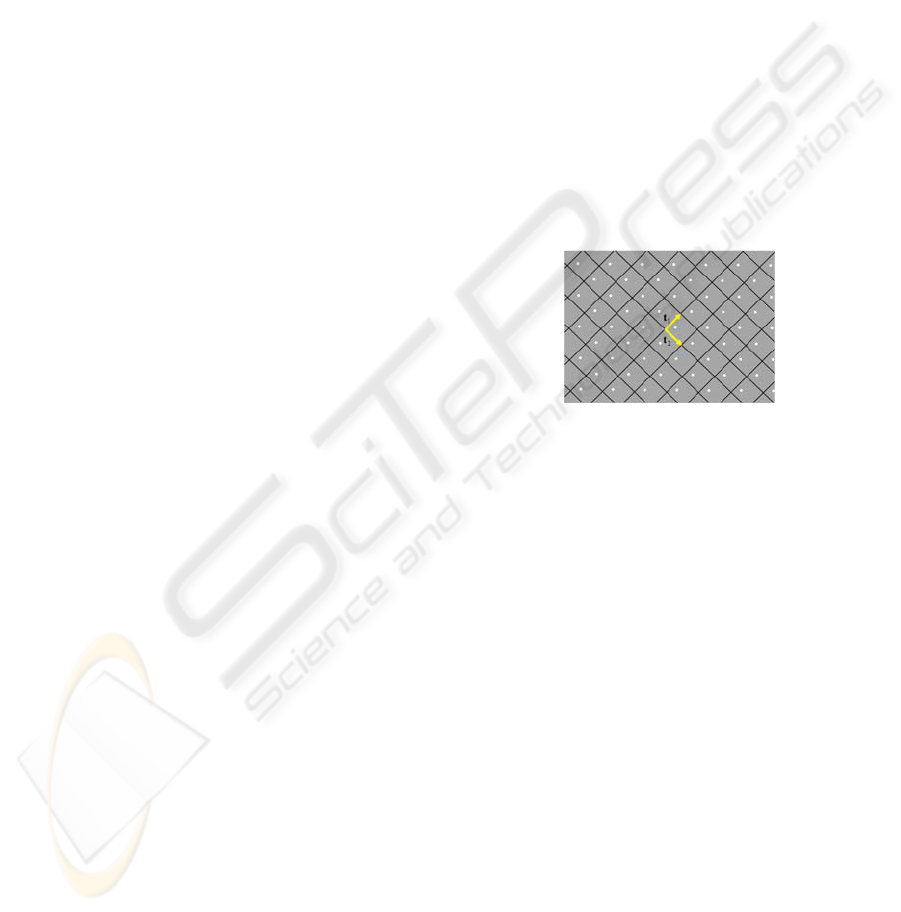
considered, as shown in Figure 1. A pair of vectors
with shortest length (two linearly independent
directions), (
1
t ,
2
t ) define a parallelogram which is
called the texel. The texel repeatedly tiles the image
to form a lattice structure.
1
t and
2
t define the size,
shape, and orientation of the texel.
Texel extraction is key to understanding regular
texture. Starovoitov et al. (1998) used features
derived from co-occurrence matrices to extract the
texel. Charalampidis (2006) achieved this in the
frequency domain based on the assumption that
fundamental frequencies hold the basic structure
information of regular texture. Lin et al. (1997)
obtained texels by detecting salient peaks in the
autocorrelation (AC) function of a texture image.
Liu et al. (2004) extended the work of Lin et al.
(1997) by adopting more dominant peaks of the AC
function.
Figure 1: A wallpaper pattern example with its two
placement vectors and lattice structure.
Several applications are based on the results of
texel extraction from regular texture. Chetverikov
(2000) and Leu (2001) measured the regularity
degree of images using features derived from the AC
function and similarity among texels, respectively.
The regularity measurement can be applied to
classify regular and irregular texture images. Texture
image retrieval and browsing systems have been
proposed in which the features used are related to
texture periodicity (Liu et al., 1996; Lin et al., 1999;
Lee et al., 2005). Charalampidis (2006) implemented
texture synthesis using extracted texels. Lin et al.
(2006) designed a geometric regularity score that
depended on both the magnitudes and directions of
1
t and
2
t to evaluate various texture synthesis
algorithms. Recently, Hays et al. (2006) and Lin et
al. (2007) extended regular texture models to extract
and track texels of near-regular texture, respectively.
As can be seen from Figure 1, texel geometry
indicates the spatial arrangement of a regular
texture. Lin et al. (2006) adopted texel geometric
information for the purpose of comparing
synthesized texels and original texels. The
347
Han J. and J. McKenna S. (2009).
CLASSIFYING AND COMPARING REGULAR TEXTURES FOR RETRIEVAL USING TEXEL GEOMETRY.
In Proceedings of the Fourth International Conference on Computer Vision Theory and Applications, pages 347-354
DOI: 10.5220/0001792703470354
Copyright
c
SciTePress

comparison was based on a Euclidean distance
without taking the intrinsic distribution of texels into
consideration.
This paper presents a method that takes
advantage of the geometric information from texels
to retrieve and browse images. Firstly, texels are
automatically extracted from regular texture images.
Then, aspects of the texel geometry are represented
as feature vector. Based on the distribution of a
collection of images in the resulting feature space,
clusters are defined such that each cluster
corresponds to a type of texel. Each cluster is
modelled as Gaussian and Bayes’ rule is used to
estimate the probability that a regular texture has a
certain texel type. The estimated distributions are
also used to measure similarity between texels.
Finally, the proposed techniques are applied to
perform image retrieval and browsing.
The main contributions of this paper are: 1) A
3D representation is proposed to characterize texel
geometry and embody the spatial arrangement
information of regular texture in a manner that is
invariant to translation and scaling in the image
plane. 2) Texel clusters are defined and modelled
based on the distribution of a collection of data. 3)
Instead of using Euclidean distance, texel
comparisons are made based on the probabilities that
the image belongs to each cluster and the intrinsic
cluster distributions. Finally, we show how these
methods can be applied to image retrieval and
browsing.
The rest of the paper is organized as follows.
Section 2 summarises the texel extraction algorithm.
Section 3 proposes a model of texel types based on
the distribution of a collection of images. Section 4
applies the model to image browsing and retrieval.
Experiments are presented in Section 5. Finally,
conclusions are drawn in Section 6.
2 TEXEL EXTRACTION
A previously published method (Han et al., 2008)
was used to extract texels, i.e. to estimate (
1
t ,
2
t ).
The algorithm is described here briefly for
completeness.
The texel extraction algorithm contains two
steps: texel hypotheses generation and hypothesis
comparison. The first step begins by computing the
AC function. Peaks in AC functions are always
associated with texture periodicity. Following the
ideas of Lin et al. (1997) and Liu et al. (2004),
salient AC peaks are selected and used to obtain
texels. Changing the number of peaks considered
can result in different texel candidates.
The second step compares all of the texel
candidates obtained from the first step using a
Bayesian model comparison framework. Let
I
be
an image and
),(
21
tt
≡
H denote a texel hypothesis
for
I
,
k
H the
th
k in a set of hypotheses, and
k
M
a statistical model defined based on
k
H with
parameters
k
θ
. Texel extraction can be formulated
as choosing the most probable texel hypothesis
given the image. By Bayes’ theorem, the posterior
probability is proportional to the likelihood of the
hypothesis times a prior:
(| )( )
(|) (|)()
()
kk
kkk
pI H pH
pH I pI H pH
pI
=∝ (1)
In the absence of prior knowledge favouring any
particular hypothesis, the prior is taken to be
uniform. For each
k
H , we define a unique
k
M deterministically so )|(
kk
HMp is a delta
function. Hence,
(|) (|) (|,)(|)
kkkkkkk
pH I pI M pI M p M d
θ
θθ
∝=
∫
(2)
The integral in Eq. (2) can be approximated
using Bayes Information Criterion (BIC). The details
of BIC approximation can be found in Raftery
(1995). The BIC for the model is:
ˆ
( ) log ( | , ) ( / 2)log log ( | )BIC M p I M d N p I M
θ
=− + ≈−
(3)
where
d is the number of parameters and
θ
ˆ
is a
maximum likelihood parameter estimate.
The hypothesis with the model that has the
largest marginal likelihood is selected. Using the
BIC approximation, hypothesis
k
H is selected by
)}({argmin)|(argmax
ˆ
kk
kk
MBICIHpk ==
(4)
The texel model
k
M should be able to account
for both regularity from periodic arrangement and
statistical photometric and geometric variability.
Here a Gaussian with covariance matrix of the form
I
2
σ
was used to model a texel’s appearance. The
reader is referred to Han et al. (2008) for further
details.
3 TEXEL GEOMETRY
This paper focuses on modelling the geometry of a
texel, (
1
t ,
2
t ), and not its pixel values. We opt for a
representation that is scale invariant since the
physical scale of the imaged objects is unknown.
VISAPP 2009 - International Conference on Computer Vision Theory and Applications
348
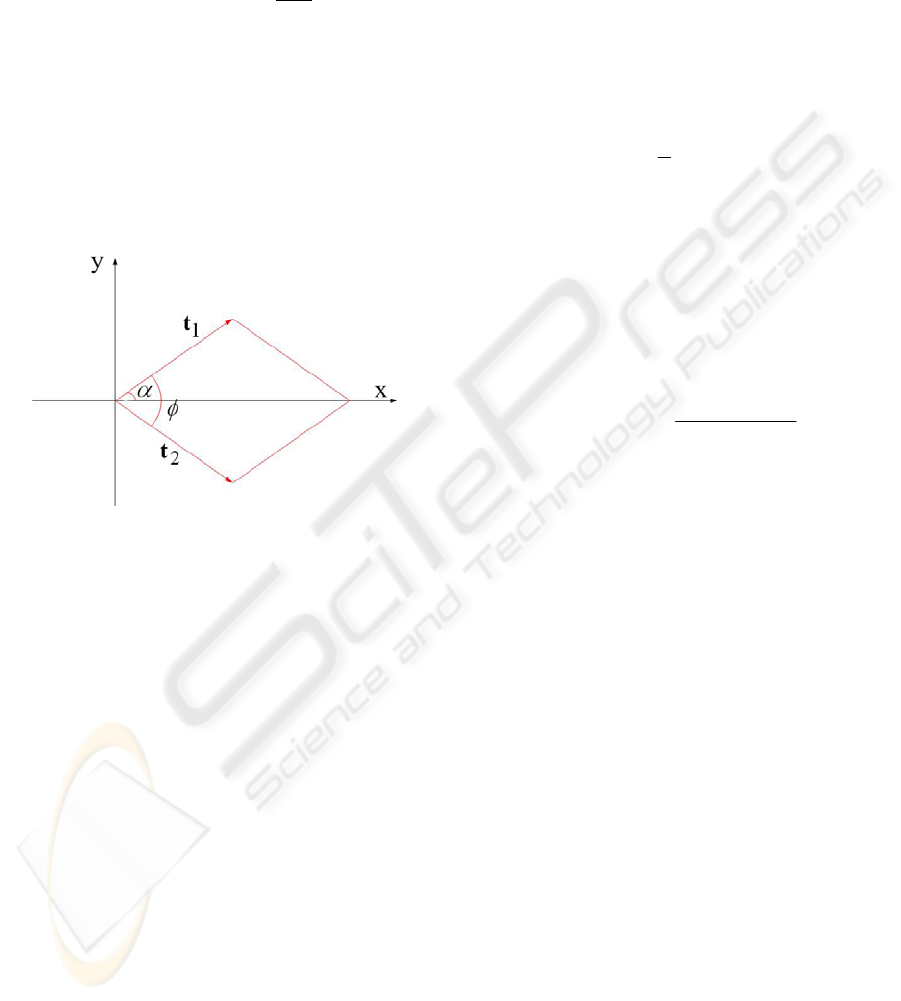
The following three features are used to describe the
spatial arrangement:
α
: the angle between
1
t and the image x-axis;
φ
: the angle between
1
t and
2
t ;
r
: the ratio of lengths, i.e.
||
||
2
1
t
t
=r .
Note that the angle between
1
t and the x-axis is
not larger than the angle between
2
t and the x-axis,
by construction. Figure 2 shows an example. The
value of
α
ranges from 0 to 90 degrees.
2
t is the
texel vector that subtends the smallest angle with
1
t ,
and that angle is
φ
. The value of
φ
for a wallpaper
pattern always lies between 60 and 90 degrees.
Figure 2: An example of the geometry of a texel.
The three-dimensional feature vector ),,( r
φ
α
is
automatically extracted from each regular texture
image using the method described in Section 2. A
distribution of 200 images in this 3D feature space is
shown in Figure 3. See Section 5 for details of the
dataset. Inspection of this distribution suggests
clusters. Each cluster can be considered to
correspond to a type of texel. Specifically, five
clusters of texels might be defined according to the
following five rules:
Cluster 1: texels are rectangles with
DD
90 ,0 ≈≈
φα
;
Cluster 2: texels are parallelograms with
DD
90 ,45 <≤
φα
;
Cluster 3: texels are parallelograms with
DD
90 ,0 ≈>
φα
;
Cluster 4: texels are parallelograms with
DD
90 ,45 <>
φα
;
Cluster 5: texels are parallelograms with
DD
90 ,0 <≈
φα
.
Any image in the dataset can be classified into a
cluster based on the defined rules. However, a model
of the cluster
distributions is more useful, enabling
the clusters to be parameterised and meaningful
texel similarity measures to be defined. Each cluster
can be modelled as a three-dimensional Gaussian
distribution with a probability density function
3/2 1/2
1
(| ) (2) | |
1
exp ( ) ( )
2
i
T
ii i
pC
π
−−
−
=
⎧
⎫
⋅−− −
⎨
⎬
⎩⎭
x Σ
x μΣx μ
(5)
where
),,( r
φ
α
=
x denotes the feature vector of an
image,
}5,4,3,2,1{,
∈
iC
i
, denotes the cluster index
or class,
i
μ denotes the mean for class i, and
i
Σ
denotes the covariance matrix for class
i. The
parameters
i
μ and
i
Σ can be estimated using
maximum likelihood. The class posterior probability
can then be estimated via Bayes’ theorem,
)(
)()|(
)|(
x
x
x
P
CPCP
CP
ii
i
= (6)
where the prior
)(
i
CP can be estimated from the
frequencies of the classes in the data.
4 IMAGE BROWSING AND
RETRIEVAL
Due to the rapidly growing number of digital images
in our lives, there is a great need for effective image
retrieval techniques. Content-based image retrieval
using image features such as color, shape, and
texture can be effective when the user has a query
image to hand. However, when the user’s intention
is ambiguous, image browsing can be more useful.
Browsing supposes that the images can be
categorized and ordered in meaningful ways. In the
case of retrieval and browsing of images exhibiting
regular texture, the spatial arrangement is obviously
quite an important feature. In this section, we
illustrate how the technique for describing and
modelling texel geometry (the spatial arrangement
of regular texture) can be applied to content-based
retrieval and browsing.
CLASSIFYING AND COMPARING REGULAR TEXTURES FOR RETRIEVAL USING TEXEL GEOMETRY
349
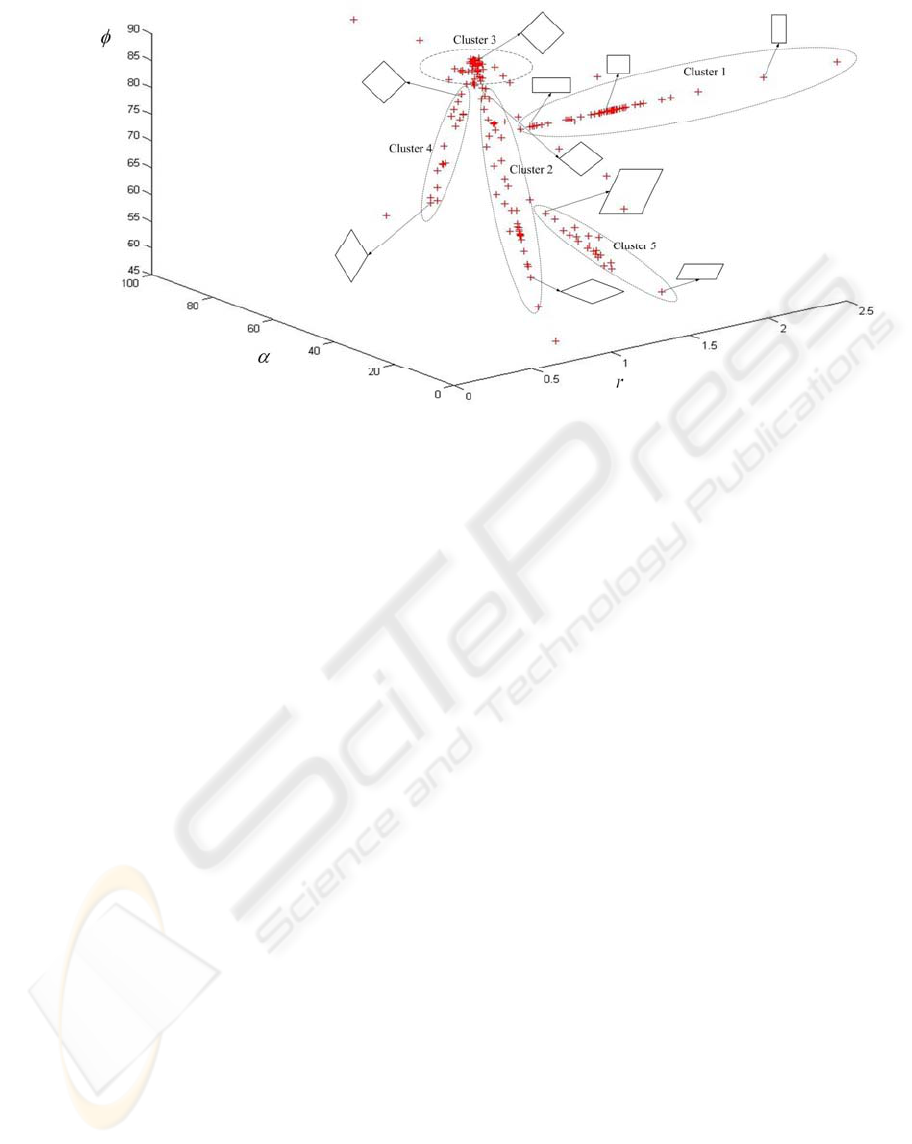
Figure 3: A distribution of 200 regular texture images in the 3D texel feature space.
4.1 Browsing a Texel Class
One approach to organising an image database for
browsing is to categorise the images and to then
display images within a category in a meaningful
way.There are then two problems: (i) how to
categorise images, and (ii) how to lay out images
within a category meaningfully for display. It is
proposed that regular texture images can be
categorised according to texel geometry. As shown
in Figure 3, data points within a cluster tend to be
scattered along a one-dimensional trend. This
corresponds to the direction of maximal intra-class
variance which is given by the principal component
of the class distribution. This direction gives a good
feature for intra-class discrimination and motivates
projecting data onto these principal components.
Ranking images according to the projected values
will reflect the intra-class variation of texel
geometry. More formally,
1. Given a set of training images from a texel
class, estimate the class mean
μ , the
covariance matrix
Σ , and the eigenvector
v of this matrix that corresponds to the
largest eigenvalue
λ
.
2. For each test image from the same texel
class, project the texel
),,( r
φ
α
=x onto the
first eigenvector:
T
μxv )( −=y .
3. List the images in ascending order of their
y
value.
Figure 4 shows an example of browsing an
image class. The original image is shown first,
followed by its lattice structure. In this category,
there were a total of 60 images. Due to limited
space, only a few images are shown. The first row
shows the three images placed at the front of the
ranking list, the second row shows the middle three,
and the third row shows the last three images. Texels
of this image class differ mainly in the value of
φ
which varies from approximately 60 degrees to
approach 90 degrees. Projecting the image data to
the trend of the first principal component retains the
‘most important’ variation. Images in this category
are thus sorted in order of increasing
φ
.
4.2 Image Retrieval
Key to image retrieval and browsing is to measure
similarity between images, whether between a query
and the database for retrieval, or between images in
the database for structuring the data for indexing and
visualisation. Consider the case of query-by-
example in which a query image
Q is to be
compared to an image
A
from the database.
Assume that
A
has been classified as belonging to
the class
}5,4,3,2,1{, ∈jC
j
. The similarity between
VISAPP 2009 - International Conference on Computer Vision Theory and Applications
350

Q
and
A
is estimated as follows.
1. Calculate the probability
)|( QCP
j
that
Q
belongs to class
j
C
. (See Eqs. (5) and (6)).
2. Project
Q and
A
onto the principal
component of class
j
C to obtain
T
μv )(
jjQ
Qy −= and
T
μv )(
jjA
Ay −= .
3. The similarity of
Q to
A
is computed as:
2/1
2/1
2
)2( where
)|(
2
)(
exp
1
j
j
j
AQ
QA
Z
QCP
yy
Z
S
λπ
λ
=
⎟
⎟
⎠
⎞
⎜
⎜
⎝
⎛
−
−=
(7)
The above processing is repeatedly performed to
every image in the database to yield a similarity to
the query. Then, the images are ranked in decreasing
order of similarity to the query. The similarity
measure in Eq. (7) takes into account the probability
that the query belongs to the same class and the
distance between the images in that class
(appropriately scaled).
Figures 5 and 6 show examples of the proposed
image retrieval algorithm. In each of these Figures,
the query image is shown at the top-left, and the top
eight returned images are shown. The images are
ordered from left to right and from top to bottom.
Recall that the texel geometry is represented in a
way that is scale invariant. Therefore, the similarity
measure is in terms of shape and orientation. As can
be seen, the returned images have their basic texture
units repeated in similar ways to the query images.
5 EXPERIMENTS
Three experiments were performed to evaluate the
proposed methods. The first experiment tested the
performance of the texel extraction algorithm. The
second experiment tested the ability of the Gaussian
cluster models to yield correct classification of
texels. The final experiment explored the ability of
the principal components to represent the clusters.
A dataset of 200 regular texture images was used
for evaluation, comprising 147 images of textiles
from a commercial archive and 53 images taken
from three public domain databases (the Wikipedia
Wallpaper Groups page, a Corel database, and the
CMU near-regular texture database). The images
ranged in size from 300
× 225 pixels to 2648
×
1372
pixels. The number of texel repeats per image
ranged from five to a few hundreds. This data set
includes images that are challenging because of (i)
appearance variations among texels, (ii) small
geometric deformations, (iii) texels that are not
distinctive from the background and are large non-
homogeneous regions, (iv) occluding labels, and (v)
stains, wear and tear in some of the textile images.
5.1 Evaluation of Texel Extraction
Two volunteers (one male and one female)
qualitatively scored and rank ordered the algorithms.
In cases of disagreement, they were forced to reach
agreement through discussion. (Disagreement
happened in very few cases). The observers were
shown extracted texels overlaid on images and were
asked to label each texel as obviously correct (OC),
obviously incorrect (OI), or neutral. They were to
assign OC if the texel was exactly the same or very
close to what they expected, OI if the result was far
from their expectations, and neutral otherwise. In
our texel extraction algorithm, variance of the
Gaussian model was the only free parameter and it
was set as
100
2
=
σ
. The numbers of OC, OI, and
neutral results were
164, 17 and 19, respectively.
Thus, the accuracy of texel extraction was
164/200=82%. Figure 7 shows some example
results.
5.2 Evaluation of Gaussian Model
A classification experiment was performed to assess
the suitability of the assumption of Gaussian
clusters. Images were classified as belonging to the
cluster with the largest posterior probability as
computed using Equations (5) and (6).
The data set of
200 images was divided into two
disjoint sets of
100 images each. One was used as a
training set and the other as a test set. The
experiment was then repeated after switching the
training and test sets. Training data and ground truth
were labelled using the rules in Section 3.2. The
classification rates for the two test sets were
91%
and
96% giving an average rate of 93.5%. The
confusion matrix averaged over the two test sets is
shown in Table 1. Regular textures from classes 2, 3,
and 4 were more likely to be misclassified, as would
be expected from inspection of Figure 3.
5.3 Evaluation of Texel Comparison
It was proposed that texels be represented by
projection onto their class-specific principal
component. The intra-class distribution is thus
modelled as a 1D Gaussian. An experiment was
CLASSIFYING AND COMPARING REGULAR TEXTURES FOR RETRIEVAL USING TEXEL GEOMETRY
351
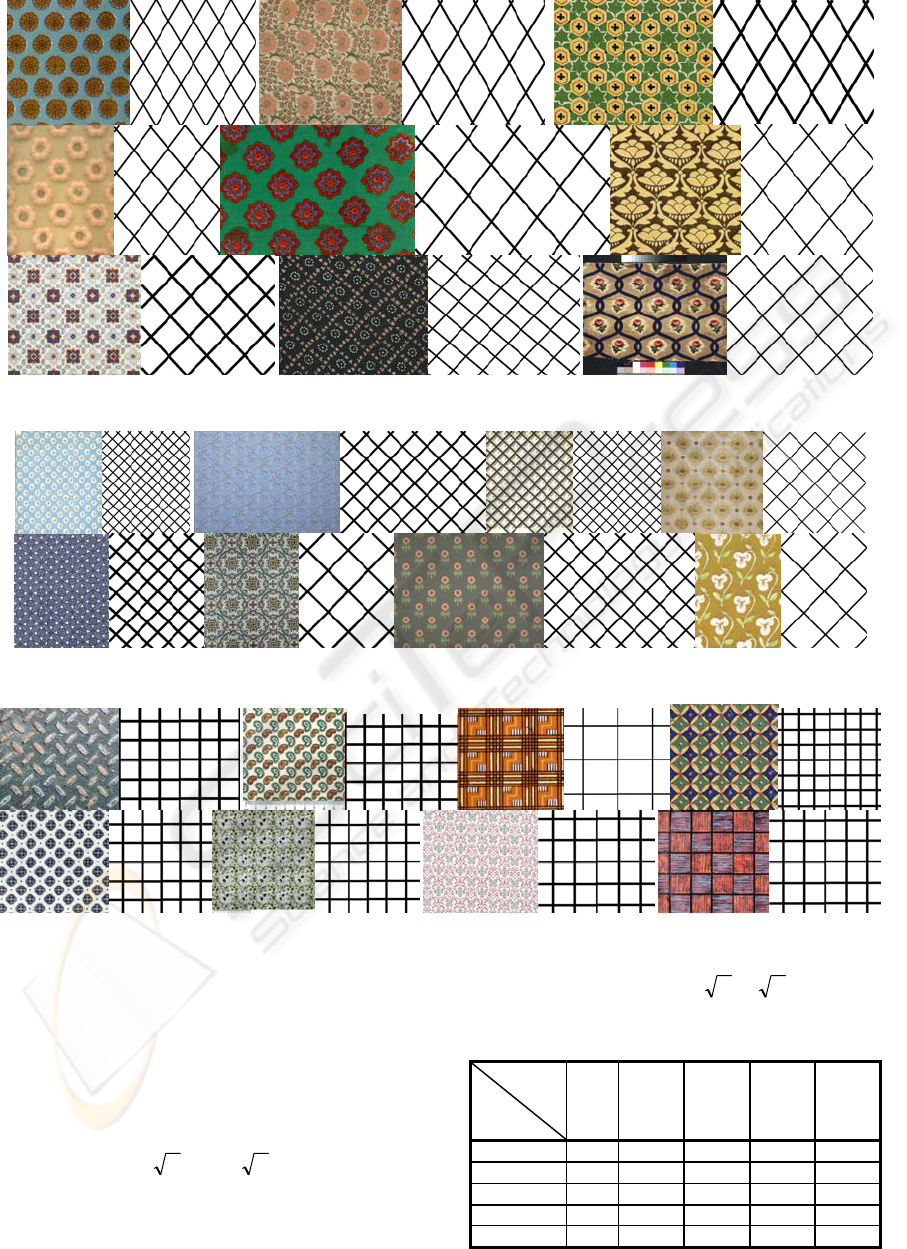
Figure 4: Image browsing example for class 4.
Figure 5: Query-by-example based on texel geometry. The query is top-left followed by the seven best matches.
Figure 6: Query-by-example based on texel geometry. The query is top-left followed by the seven best matches.
performed to explore the effect of this projection.
Texels from class i can be generated from this model
by:
ii
avμx
+
= (8)
where
a is an appropriately set weight. Weights
with large magnitudes result in texels far from the
mean. In practice, data will fall in a range such as
λλ
33 ≤≤− a (9)
where
λ
is the eigenvalue for eigenvector
i
v .
Table 2 shows texels synthesised from each of the
five classes by setting
λλ
2,,0 ±±=a .
Table 1: Confusion matrix for texel classification.
Predicted
True
1
2
3
4
5
1
29.5 0.5 0.0 0.0 0.0
2
0.0 22.0 2.0 0.0 0.0
3
0.0 1.5 21.5 0.0 0.0
4
0.0 1.5 1.0 10.0 0.0
5
0.0 0.0 0.0 0.0 10.5
VISAPP 2009 - International Conference on Computer Vision Theory and Applications
352
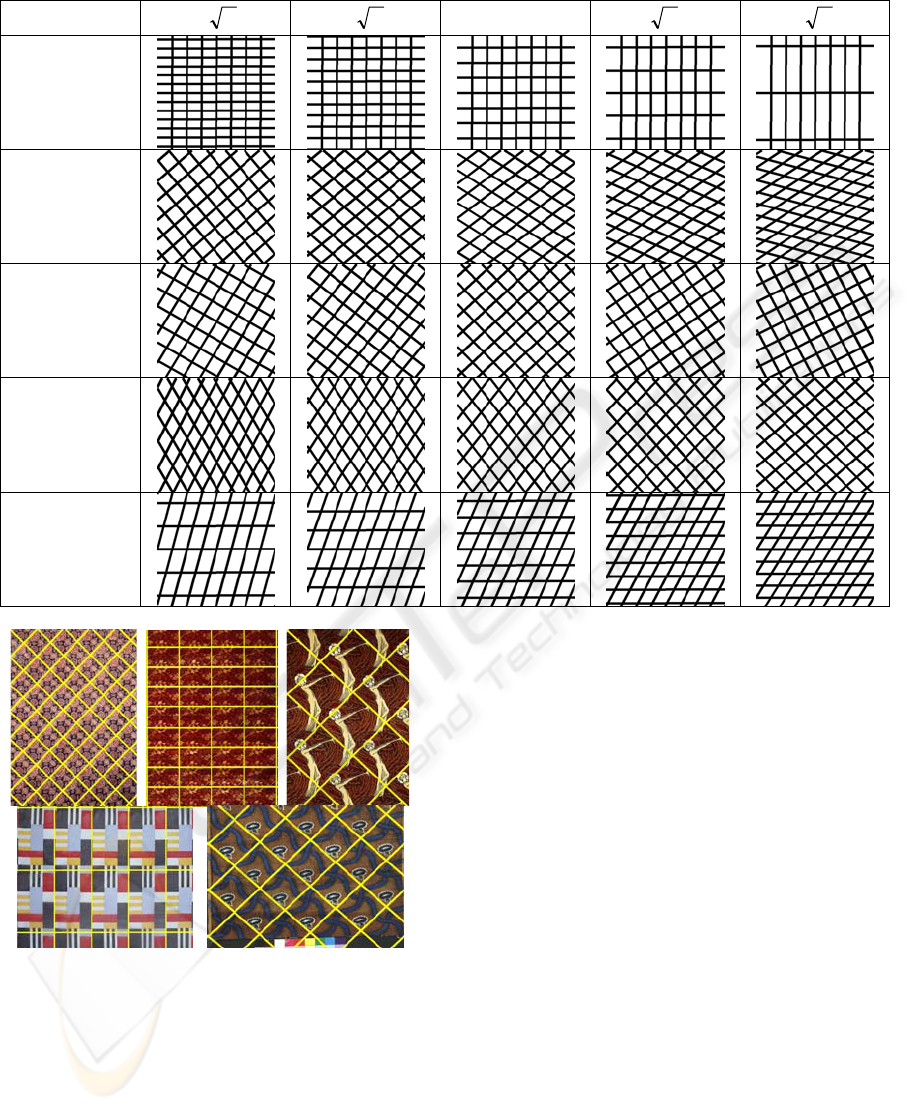
Table 2: Synthetic texels generated by the model.
a
-2
λ
-
λ
0
λ
2
λ
Class 1
Class 2
Class 3
Class 4
Class 5
Figure 7: Some results from the texel extraction algorithm.
It can be seen that the major mode of variation for
class 1 was the ratio of the lengths of
1
t and
2
t .
The major mode of variation for class 3 combined
the ratio of the lengths of
1
t and
2
t , and the
direction of
1
t . The major mode of variation for
classes 2 and 4 involved all three features. These
synthetic data suggest that the proposed model is
able to capture the variability of each class
effectively.
6 CONCLUSIONS
In this paper, a systematic study of the texel
geometry of regular textures has been presented. A
fully automatic algorithm using Bayesian model
comparison was used to extract texels. A feature
vector defined on the obtained texel was proposed to
characterize the geometry of a texel. The distribution
of a set of regular texture images in the feature space
was modelled. The proposed model is easy to
implement and was applied to guide image browsing
and retrieval effectively. Experiments on a collection
of regular texture images have demonstrated the
promise of the approach.
Various extensions to this work would be
interesting to investigate in future work. 1) It would
be useful to analyse other regular texture data sets to
investigate the breadth of applicability of the
proposed clustering model. 2) Evaluations of image
retrieval and browsing should be conducted on a
large-scale database combining the proposed
technique with other features that model the
CLASSIFYING AND COMPARING REGULAR TEXTURES FOR RETRIEVAL USING TEXEL GEOMETRY
353

appearance of the texels. 3) The proposed work has
been applied to image retrieval and browsing in this
paper. We believe it can also be extended to help
fabric designers to categorize and manage their
digital archives, and provide them with interesting
sources to spark and fuel design inspiration.
ACKNOWLEDGEMENTS
This research was supported by the UK Technology
Strategy Board grant ``FABRIC: Fashion and
Apparel Browsing for Inspirational Content'' in
collaboration with Liberty Fabric, System
Simulation, Calico Jack Ltd., and the Victoria and
Albert Museum. The Technology Strategy Board is
a business-led executive non-departmental public
body, established by the government. Its mission is
to promote and support research into, and
development and exploitation of, technology and
innovation for the benefit of UK business, in order
to increase economic growth and improve the
quality of life. It is sponsored by the Department for
Innovation, Universities and Skills (DIUS). Please
visit www.innovateuk.org for further information.
REFERENCES
Starovoitov, V., Jeong, S., and Park, R., 1998. Texture
periodicity detection: features, properties, and
comparisons. IEEE Trans. on Systems, Man, and
Cybernetics-Part A: Systems and Humans, 28, 839-
849.
Charalampidis, D., 2006. Texture synthesis: textons
revisited. IEEE Trans. on Image Processing, 15, 777-
787.
Lin, H., Wang, L., Yang, S., 1997. Extracting periodicity
of a regular texture based on autocorrelation functions.
Pattern Recognition Letters, 18, 433-443.
Liu, Y., Collins, R., Tsin, Y., 2004. A computational
model for periodic pattern perception based on frieze
and wallpaper groups. IEEE Trans. on Pattern
Analysis and Machine Intelligence, 26, 354-371.
Lin, W., Liu, Y., 2007. A lattice-based MRF model for
dynamic near-regular texture tracking. IEEE Trans. on
Pattern Analysis and Machine Intelligence, 29, 777-
792.
Lin, W., Hays, J., Wu, C., Kwatra, V., Liu, Y., 2006.
Quantitative evaluation of near regular texture
synthesis algorithms. In IEEE Conference on
Computer Vision and Pattern Recognition, 427-434.
Liu, F., Picard, R., 1996, Periodicity, directionality, and
randomness: wold features for image modeling and
retrieval. IEEE Trans. on Pattern Analysis and
Machine Intelligence, 18, 722-733.
Lin, H., Wang, L., Yang, S., 1999. Regular-texture image
retrieval based on texture-primitive extraction. Image
and Vision Computing, 17, 51-63.
Lee, K., Chen, L., 2005. An efficient computation method
for the texture browsing descriptor of MPEG-7. Image
and Vision Computing, 23, 479-489.
Chetverikov, D., 2000. Pattern regularity as a visual key.
Image and Vision Computing, 18, 975-986.
Hays, J., Leordeanu, M., Efros, A., Liu, Y., 2006.
Discovering texture regularity as a higher-order
correspondence problem. In European Conference on
Computer Vision, 522-535.
Leu, J., 2001. On indexing the periodicity of image
textures. Image and Vision Computing, 19, 987-1000.
Han, J., McKenna, S.J., Wang, R., 2008. Regular texture
analysis as statistical model selection, In European
Conference on Computer Vision, 242-255.
Raftery, A.E., 1995. Bayesian model selection in social
research. Sociological Methodology, 25, 111-163.
VISAPP 2009 - International Conference on Computer Vision Theory and Applications
354
