
PATTERN ANALYSIS FOR COMPUTER-AIDED DRIVING
Fr
´
ed
´
erique Robert-Inacio
IM2NP - UMR CNRS 6242, ISEN-Toulon, Place Pompidou, Toulon, France
Damien Outr
´
e, Mohamadou-Falilou Diop
ISEN-Toulon, Place Pompidou, Toulon, France
Franck Bertrand
Nodbox, 400 avenue Roumanille, Biot, France
Keywords:
Object detection, Pattern analysis, Color imaging, Road width, Road sign.
Abstract:
This study is based on the elaboration of a software for computer-aided driving. A video is acquired through
the windscreen while driving, showing the scene observed by the driver. The purpose is to extract characteristic
elements on each image of the video sequence in order to interpret them and help the driver to make a decision.
In this way, the road width is estimated. As well, road signs are extracted from the video and the information
they contain is interpreted. The presented works are based on a preliminary study giving a draft software and
experimental results are shown on several examples.
1 INTRODUCTION
In the last few years several studies have been led
concerning object detection in video showing road
scenes. Some of them concern number plates in or-
der to identify vehicles (Jia et al., 2007). Others are
related with vehicle recognition in order to determine
how a parking is occupied or what kind of vehicles are
in a traffic jam (Taktak et al., 1995)(Kaaniche et al.,
2005). And finally some of them aim to interpret
a road scene as seen by a human observer, in order
to help a driver to make a decision (Foedisch et al.,
2006). Furthermore some studies concern the driver
behavior in order to improve the road safety (Riener
and Ferscha, 2007).
In this study we will firstly show how to determine
the road width at each time. This information is very
important as it can influence the vehicle positioning
on the road. In a second time, road signs are extracted
from the video in order to be interpreted.
2 IMAGE ACQUISITION
In order to acquire video sequences, a camera is set up
inside the vehicle behind the windscreen and approx-
imatively in the middle. Digitized scenes represent
mainly the lane in which the vehicle is moving, but
also a part of the left lane and a part of the right road
side. Let us recall that vehicles move on the right side
in France. On such images we can distinguish both
road signs and runway markings. Fig. 1 shows an ex-
ample of acquisition. Video sequences are acquired
in urban context as well as in countryside.
Some complementary data are also available from
the full acquisition system, such as GPS coordinates
and video sequences on the rear. But in this paper no
correlation between the different datasets is achieved,
but it will be done in future works.
3 ROAD WIDTH ESTIMATION
3.1 Image Preprocessing
Road lane segmentation is a difficult task to achieve
as context can be of various kinds: urban context,
countryside, highways, etc. (Kang and Jung, 2003).
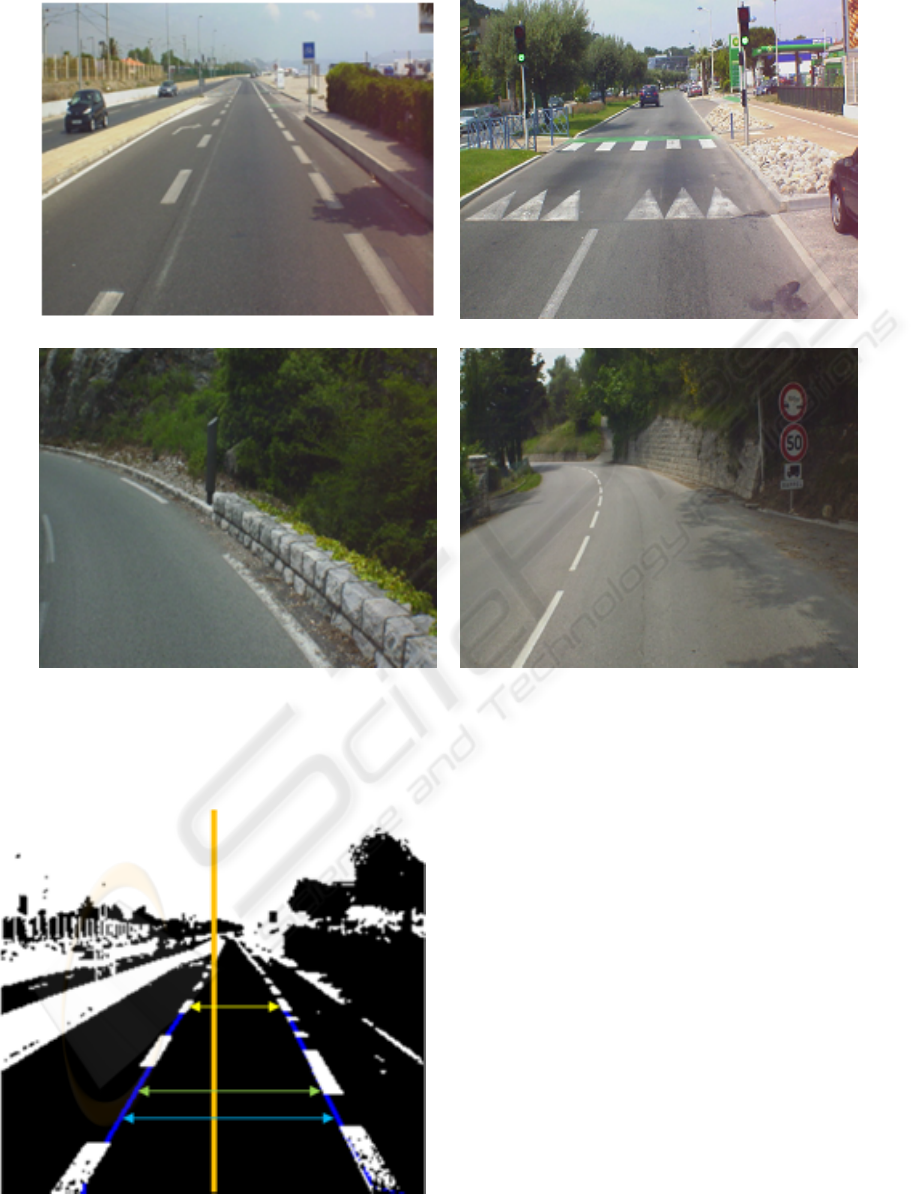
Road width estimation is based on runway marking
detection (Rebut et al., 2004). Fig. 2 shows examples
where the lane is bounded and examples where it is
not.
259
Robert-Inacio F., Outré D., Diop M. and Bertrand F. (2009).
PATTERN ANALYSIS FOR COMPUTER-AIDED DRIVING.
In Proceedings of the Fourth International Conference on Computer Vision Theory and Applications, pages 259-264
DOI: 10.5220/0001795202590264
Copyright
c
SciTePress
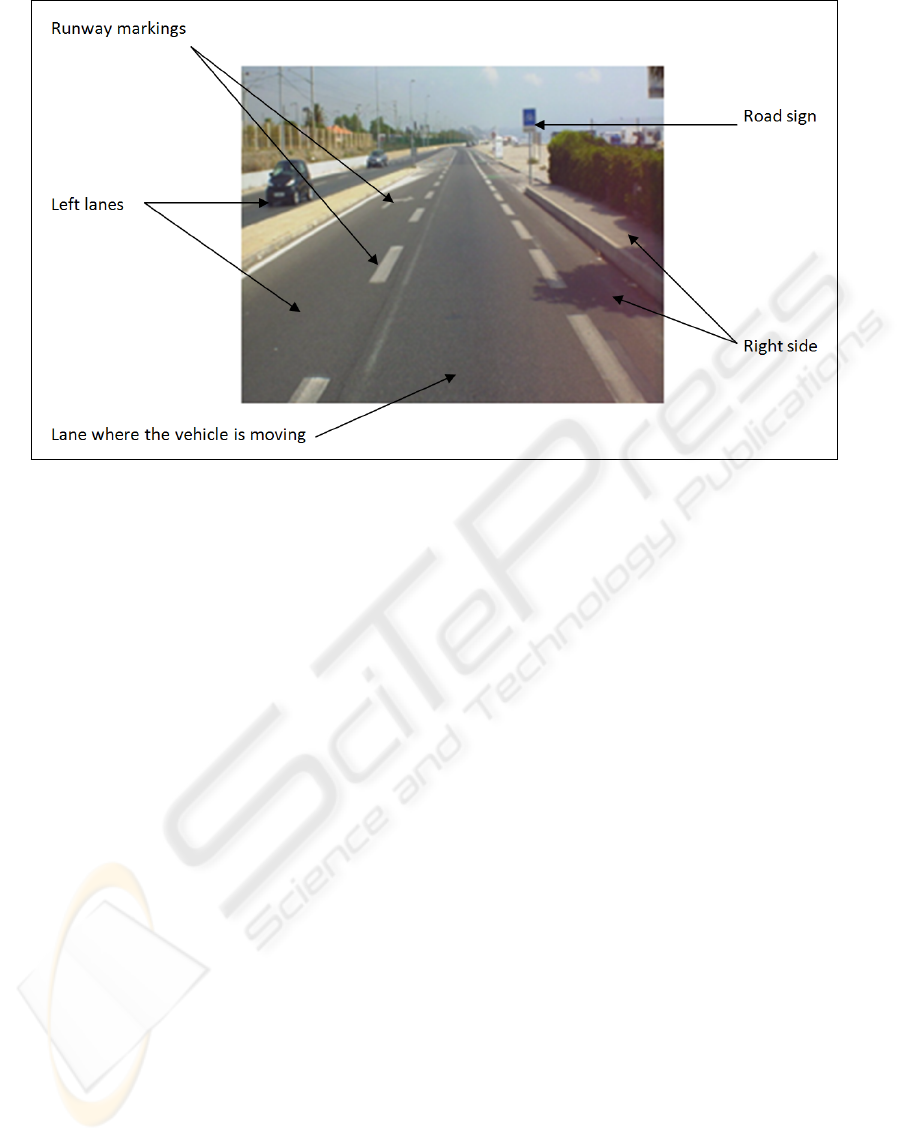
Figure 1: Example of video acquisition.
In this paper let us assume that the lane where the
vehicle moves is bounded on both sides by runway
markings or at least by a sidewalk of light color. Then
the main step of the preprocessing process consists of
the localization of those markings. This marking de-
tection is achieved by a marginal thresholding on the
three color planes of an image. The threshold value
is high: if v
max
is the maximal value of the consid-
ered plane, the threshold value is equal to 0.9 × v
max
.
In this way we keep only high values on the three
planes. Then if a high value is detected at the same
position in both red, green and blue planes, this is rep-
resentative of white or quasi-white points. The final
thresholded image contains only white or quasi-white
points. As runway markings are painted in white, they
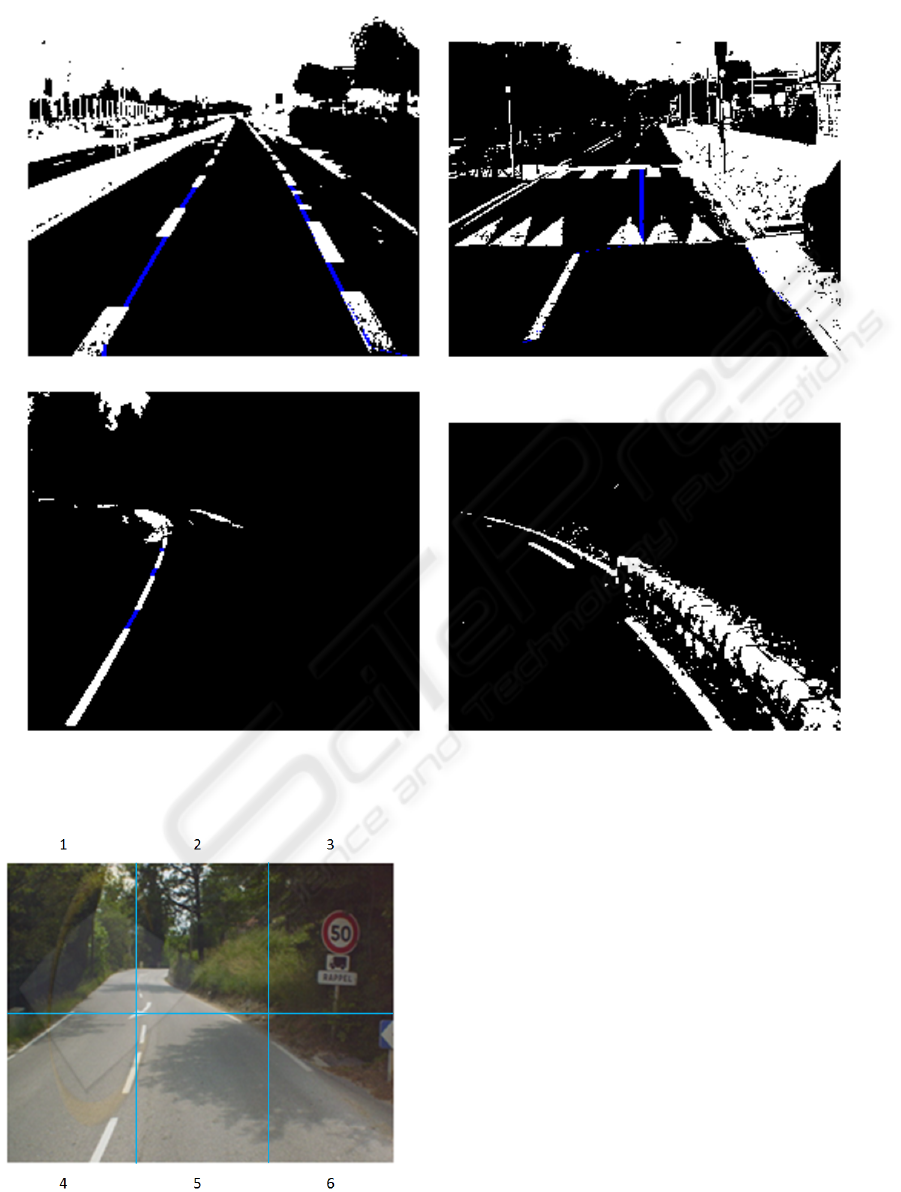
are detected on the resulting thresholded image. Fig.
3 shows thresholding results on images of Fig. 2.
3.2 Width Estimation
In order to measure the road width, an extraction of
runway markings is achieved from the thresholded
image. Then these markings need to be continued
so that the lane is fully bounded on each side. This
continuation process is done by considering the
vertical median line as the starting point set. This
median line is scanned from bottom to top until half
the image height. Then the first white point on the
right and the first white point on the left, if they exist,
are detected for each ordinate value. This gives two
different point sets: the one for points on the left
and the other one for points on the right. These sets
are arranged in order according to ordinate values.
When points are missing for some ordinates, a linear
interpolation is achieved to prolongate the markings
(Fig. 3a, b and c).
When the two lane sides are fully bounded (Fig.
3a and b), an estimation of the lane width can be
done. As shown in Fig. 4, the median line in orange
is scanned again in order to measure the horizontal
distance between a point of the left set and one of the
right set. These two points can belong either both to
the marking set (in yellow), or both to prolongated
lines (in cyan) or one to the marking set and the other
to the prolongated lines (in green). It makes no sense
to explore the image beyond the downer part because
the image is too distorted because of perspective de-
formation and measures will be too erroneous.
Depending on the ordinate value a scale ratio is
applied to each horizontal distance estimated in pix-
els in order to obtain a distance in meters. This scale
ratio obviously depends on the ordinate value as this
value is itself strongly correlated with the distance to
the vehicle. A calibration is achieved before the video
acquisition. From this calibration step, distances can
be estimated in meters from measures in pixels in the
transversal direction (horizontal on the image) and in
the longitudinal direction (vertical on the image) on
the bottom half of the image. In other words, dis-
tances can be estimated until a real distance of 20 me-
ters ahead from the vehicle.
VISAPP 2009 - International Conference on Computer Vision Theory and Applications
260
a b
c d
Figure 2: Examples of road views: a) road lane bounded by markings, b) road lane bounded by markings and light sidewalk
border, c) hairpin bend and d) road lane bounded by markings only on the left-hand side.
Figure 4: Horizontal distances between left and right points.
4 ROAD SIGN ANALYSIS
4.1 Road Sign Detection
Road sign interpretation is also a very important point
to deal with, as it implies modification of the driver
behavior. Several studies have been led to determine
how the driver detects and interprets road signs (Won
et al., 2007). In order to detect road signs the image
is roughly partitioned in several regions. Interesting
road signs are located on the right side of the road.
Furthermore it is of no interest to try to identify signs
that are too close or too far from the vehicle, because
the information contained in the sign can be highly
biased due to the road curvature (if too far) or to a
partial image of the sign (if too close). That is why
the study is restricted to a sixth of the whole image
(Fig. 5): part number 3.
The image is then thresholded in order to extract
PATTERN ANALYSIS FOR COMPUTER-AIDED DRIVING
261
a b
c d
Figure 3: Thresholded images corresponding to original images of Fig. 2. In blue, runway marking prolongations.
Figure 5: Image partition for road sign detection.
the sign itself. Based on the assumption that signs
are made of vivid colors, the thresholding stage is
achieved as well as in the first part for runway mark-
ing detection. But in this case, all light color val-
ues are interesting as road signs are mainly bordered
in white, yellow, blue or red. The thresholding step
is then achieved in a marginal way, before merging
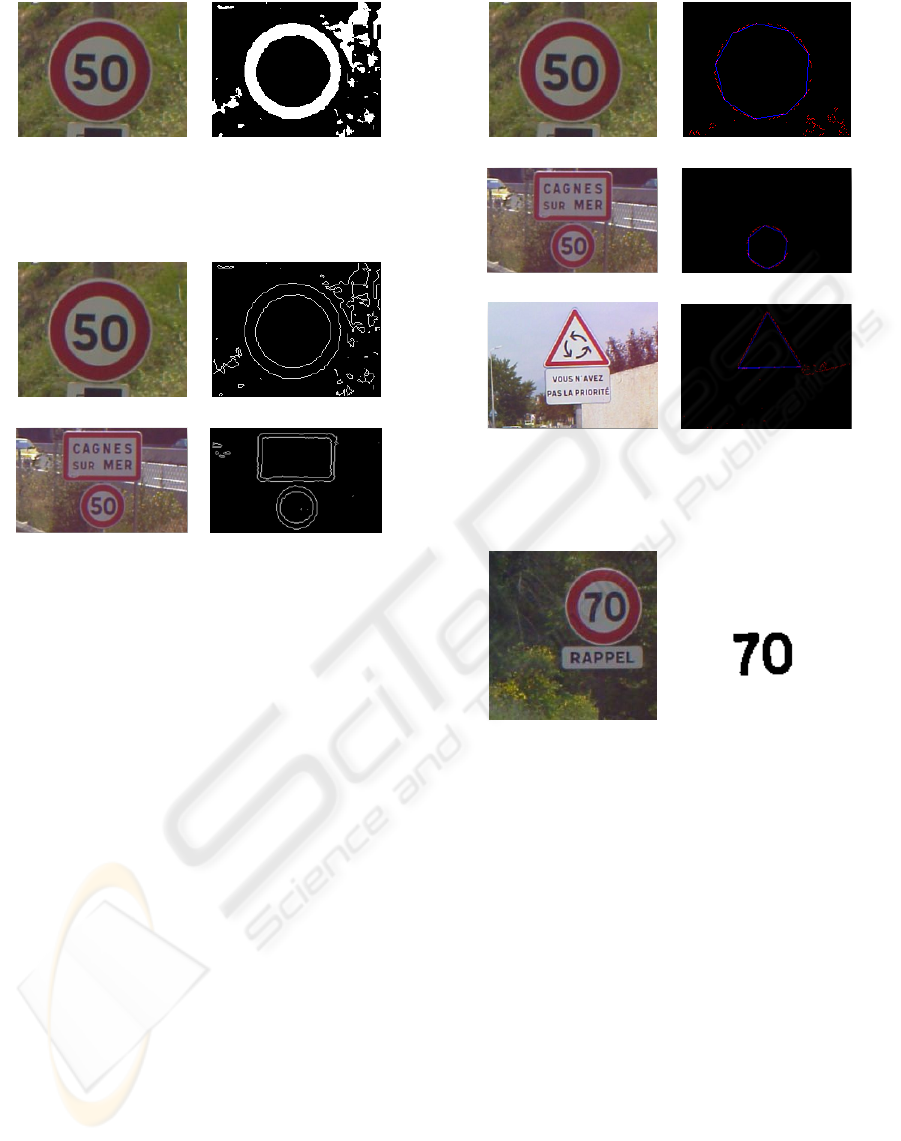
thresholded images. Fig. 6 shows a sign detection by
thresholding.
4.2 Information Extraction
Two different kinds of information are extracted to
identify a road sign: its content and its shape (Gao
et al., 2006). Actually, the meaning of a road sign
depends on its shape: for example triangular signs in-
dicate a hazard. This discriminates main families of
road signs as we are going to distinguish several el-
VISAPP 2009 - International Conference on Computer Vision Theory and Applications
262
a b
Figure 6: Image of a road sign (a) and detection by thresh-
olding (b).
a b
c d
Figure 7: Image of a road sign (a,c) and contour detection
(b,d).
ementary shapes: disks, rectangles, squares and tri-
angles. Furthermore, inside a given family, the in-
formation contained by the road sign enables to fully
identify the sign meaning.
So the contour of the road sign is extracted from the
thresholded image. Afterwards this set of points is
vectorized (Hilaire and Tombre, 2006) in order to
keep only a few points: three for triangles, four for
rectangles or squares and six at least for disks. Fig.
7 shows different contour extractions and Fig. 8 con-
tour vectorizations. The processing is achieved only
on the outer contour.
Depending on the point number resulting from the
vectorization step, a first classification is established
and the sign under study is associated with one of the
main families.
Finally information is extracted from the sign by
processing the image only inside the previously deter-
mined contour. In this way a basic thresholding gives
the result, as shown on Fig. 9.
4.3 Estimation of the Sign Height
Another information that can be helpful for computer-
aided driving is the road sign height or its post length.
In order to compute this height, we start from the
a b
c d
e f
Figure 8: Image of a road sign (a, c, e) and contour vector-
ization in blue (b, d, f).
a b
Figure 9: Image of a road sign (a) and extracted information
(b).
point in the middle of the sign bottom and we try to
go down through the post with respect to some cri-
teria. This progression stops as soon as homogene-
ity criteria in terms of colors are no more respected.
These homogeneity criteria are computed by deter-
mining a color distance between the next bottom point
and points already identified as part of the sign post.
The post height is then estimated by pixel counting,
when using a coefficient given by the calibration step
of the whole system, so that the height is converted
in meters. Fig. 10 shows an example of post detec-
tion. The red cross marks the last point identified as
belonging to the post. Unfortunately the homogeneity
criteria need to be improved as we did not reach the
post foot.
PATTERN ANALYSIS FOR COMPUTER-AIDED DRIVING
263
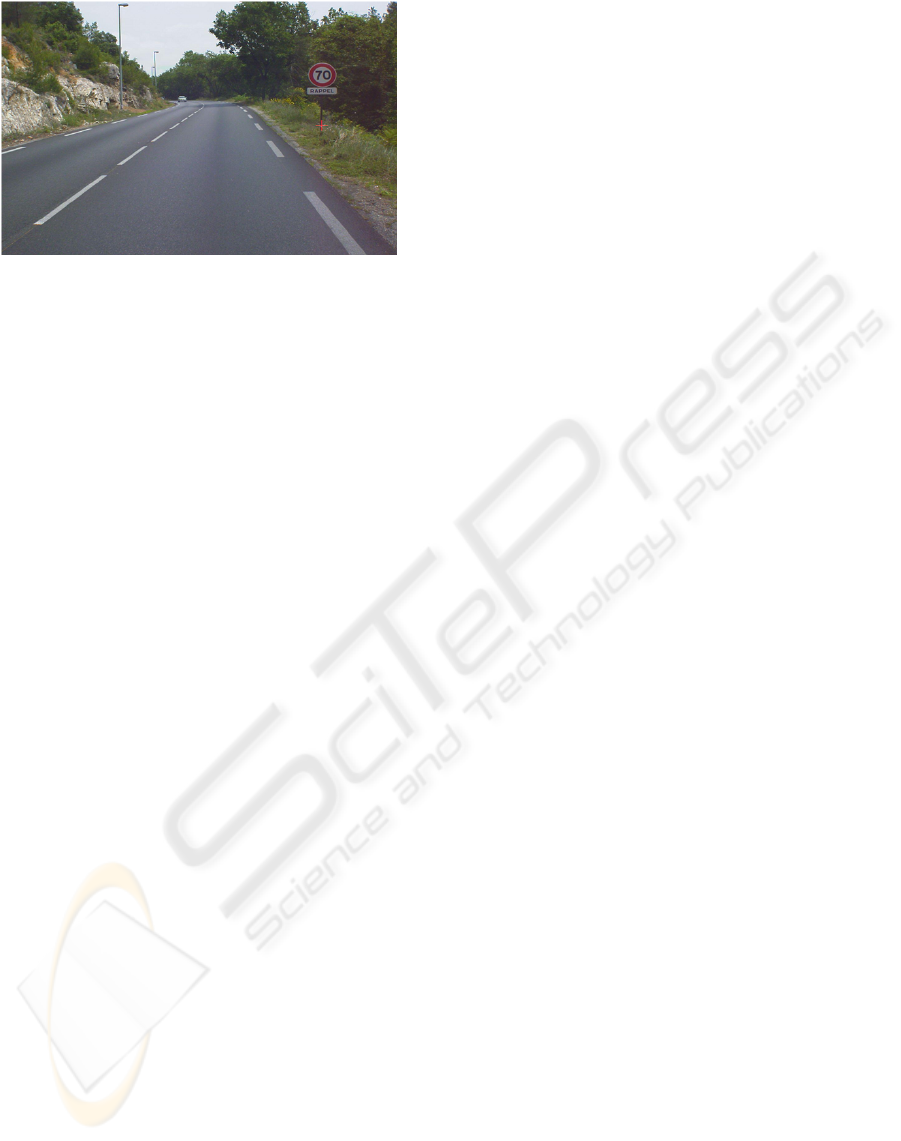
Figure 10: Image of a road sign and detection of its post
foot.
5 CONCLUSIONS AND FUTURE
WORKS
Up to now, the developed software is a prototype
version showing that it is possible to extract useful
informations from the video sequences. But in fu-
ture works we will have to solve several problems in-
volved by scene shading or weather. The scene light-
ning is also preponderant and it depends on many fac-
tors such as hour of the day or season.
Nevertheless, the presented works show that algo-
rithms have been successfully set up. Experimental
results are encouraging and computation time are low
enough not to prevent from real-time processing.
Furthermore we will have to deal with more com-
plex scenes including for example more than a sin-
gle sign. Concerning the road width, we also have
to improve our algorithm so that it will be able to
process images even if the road lane is not fully
bounded. That requires the detection of non-homo-
geneous road borders in terms of color, especially in
countryside scenes.
REFERENCES
Foedisch, M., Madhavan, R., and Schlenoff, C. (2006).
Symbolic road perception-based autonomous driving
in urban environments. In 35th Applied Imagery and
Pattern Recognition Workshop (AIPR’06), page 12.
Gao, X., Podladchikova, L., and Shaposhnikov, D. (2006).
Recognition of traffic signs based on their colour and
shape features extracted using human vision models.
Journal of Visual Communication and Image Repre-
sentation, 17:675–685.
Hilaire, X. and Tombre, K. (2006). Robust and accurate
vectorization of line drawings. IEEE Transactions on
Pattern Analysis and Machine Intelligence, 28/6:890–
904.
Jia, W., He, X., Zhang, H., and Wu, Q. (2007). Combining
edge and colour information for number plate detec-
tion. In Image and Vision Computing New Zealand
2007, pages 227–232, Hamilton, New Zealand.
Kaaniche, K., Dupuis, A., Lara, D., Pegard, C., and Vasseur,
P. (2005). Autonomous surveillance of road traffic.
In Twentieth Bristol International Conference on Un-
manned Air Vehicle Systems, Bristol, UK.
Kang, D. and Jung, M. (2003). Road lane segmentation us-
ing dynamic programming for active safety vehicles.
Pattern Recognition Letters, 24/16:3177–3185.
Rebut, J., Bensrhair, A., and Toulminet, G. (2004). Image
segmentation and pattern recognition for road mark-
ings analysis. In IEEE ISIE - International Symposium
on Industrial Electronics, pages 6 p on CD–ROM,
Ajaccio, France.
Riener, A. and Ferscha, A. (2007). Driver activity recogni-
tion from sitting postures. In Mensch und Computer
2007, Workshop Automotive User Interfaces, pages
55–63, Weimar, Germany.
Taktak, R., Dufaut, M., and Husson, R. (1995). Motorway
traffic inspection by using artificial vision and pattern
recognition. Revue d’automatique et de productique
appliquees ISSN 0990-7009, 8/2-3:339–344.
Won, W., Jeong, S., and Lee, M. (2007). Road traffic sign
saliency map model. In Image and Vision Comput-
ing New Zealand 2007, pages 91–96, Hamilton, New
Zealand.
VISAPP 2009 - International Conference on Computer Vision Theory and Applications
264
