
AN UNSUPERVISED LEARNING BASED APPROACH FOR
UNEXPECTED EVENT DETECTION
Bertrand Luvison, Thierry Chateau
LASMEA, Blaise Pascal University, Aubi`ere, France
Patrick Sayd, Quoc-Cuong Pham
CEA, LIST, Embedded Vision Systems Laboratory, Boˆıte Courrier 94, F-91191 Gif-sur-Yvette, France
Jean-Thierry Laprest´e
LASMEA, Blaise Pascal University, Aubi`ere, France
Keywords:
Motion learning, Kernel machine, Video surveillance.
Abstract:
This paper presents a generic unsupervised learning based solution to unexpected event detection from a static
uncalibrated camera. The system can be represented into a probabilistic framework in which the detection is
achieved by a likelihood based decision. We propose an original method to approximate the likelihood function
using a sparse vector machine based model. This model is then used to detect efficiently unexpected events
online. Moreover, features used are based on optical flow orientation within image blocks. The resulting
application is able to learn automatically expected optical flow orientations from training video sequences
and to detect unexpected orientations (corresponding to unexpected event) in a near real-time frame rate.
Experiments show that the algorithm can be used in various applications like crowd or traffic event detection.
1 INTRODUCTION
Surveillance is still essentially performed by hu-
man supervisors for visually inspecting video streams
from CCTV (Closed Circuit Television) networks.
However, the number of camera never stops increas-
ing. Indeed, public areas become more and more
crowded but also monitored. In this context, real-time
assisting monitoring systems which focus the opera-
tor on saliency cameras are more than necessary. This
type of systems have to deal with complex scenes and
a lot of information for extracting scarce subtle events
as in crowd or traffic monitoring.
Crowd analysis is a very complex problem due to
the variety of events to be detected and the difficulty
of modelling them. Examples of events to detect in
these crowded scenes may be abnormal trajectories,
person falls, panic movement, fighting or dangerous
trajectories and unadapted speed in the case of traffic
monitoring. Moreover, the solution must be a real-
time system since events have to be detected on the
fly. In order to reduce the scope of possible events,
researchers have generally addressed specific applica-
tions. For example, some systems focus on detecting
intrusion in a forbidden zone, while others are dedi-
cated to wrong way movement or motionless entities
detections.
In this paper, we propose a generic unsupervised
learning based system for detecting unexpected mo-
tions by vision within a structured area (traffic mon-
itoring for example). The system works on an effi-
cient and compact representation of the model learnt
adapted for real-time execution. Moreover, the learn-
ing method is fully automatic. It does not need neither
any calibration nor any labelled learning database.
The next section briefly sums up existing systems
dealing with crowd monitoring, Section 3 describes
our learning method and its application to the unex-
pected event detection. Finally, performances of the
system will be evaluated in Section 4, both on the
quality of the leanrt model and on the result obtained
in real situation over a long time testing.
506
Luvison B., Chateau T., Sayd P., Pham Q. and Lapresté J. (2009).
AN UNSUPERVISED LEARNING BASED APPROACH FOR UNEXPECTED EVENT DETECTION.
In Proceedings of the Fourth International Conference on Computer Vision Theory and Applications, pages 506-513
DOI: 10.5220/0001796705060513
Copyright
c
SciTePress

2 RELATED WORK
Crowd monitoring for unexpected event detection by
vision can be seen as a classification problem, where
each image of a video sequence must be classified
into one of the two classes: expected and unexpected
event. Related works can be divided into two cate-
gories: model based approaches and learning based
approaches.
To analyse crowd, some approaches require pre-
liminary analyses and treatments for extracting more
elaborated features, usually found thanks to model
based approaches. These features would then be anal-
ysed afterward for detecting unexpected events. For
example, the ellaborated features could be the people
of a crowd or their trajectories. In (Zhao and Nevatia,
2004), a geometric model (ellipse or omega shapes)
to detect body and legs or heads and shoulders into
crowd images is proposed. Fourier descriptors were
also used to characterize human shapes (Dong et al.,
2007). The segmented shapes are then tracked and
pedestrian trajectories are estimated in order to anal-
yse people behaviour. Other researchers mainly in-
terested in trajectories of entity in a crowd, postulate
that the different points tracked from a given person
roughly follow the same trajectory at the same speed.
These points are gathered either with a bayesian
framework as in (Brostow and Cipolla, 2006) and
(Li and Ai, 2007), or with the RANSAC algorithm
(Rabaud and Belongie, 2006). Hybrid methods com-
bine both approaches to segment the crowd, in or-
der to make the system more robust as in (Sidla and
Lypetskyy, 2006). In the case of traffic monitoring,
Hu (Hu et al., 2006) (with the additional hypothe-
sis that an entity cannot partially hide another one),
gathers features (spatial ones or trajectories) with K-
means algorithm. Instead of segmenting the crowd
in a set of pedestrians, Some approaches propose a
global analysis of the motion of the crowd. In (Ve-
lastin et al., 2006), a model of expected motion is built
from priors on circulation way for detecting wrong
way moving person or suspect motionless people.
The image motion is then estimated with optical flow
techniques, coupled with an additional foregroundex-
traction step. However, model based approaches are
very specific to a given environment and a given ap-
plication. Moreover, such approaches need priors that
are not always available.
In learning based approaches, the model of un-
expected events is learnt from a training set. This
training set can be built from expected object trajec-
tories (Singh et al., 2007; Junejo and Foroosh, 2007;
Hu et al., 2006). Resulting applications detect unex-
pected trajectories using a classification framework.
Trajectories can also infer interactions between indi-
viduals (people separating, coming closer, fighting ...)
(Blunsden et al., 2007). In (Andrade et al., 2006),
the main components (extracted from a SVD decom-
position) of crowd motion are learnt using a Hidden
Markov Model (HMM). Other learning machines aim
at classifying an entry between two classes which
correspond well to the wanted system. These two
class learning based classifiers like Support Vector
Machine (SVM) (Burges, 1998), Relevant Vector Ma-
chine (RVM) (Tipping, 2001) and Boosting (Freund
and Schapire, 1996) need both positive and negative
samples.
In this paper, we focus on the problem of motion
analysis, and especially detecting unexpected events
from a video sequence provided by a static camera.
Moreover, in order to be as generic as possible, we
choose a learning based approach. The output of the
algorithm is a binary decision associated to the can-
didate image (expected or unexpected). Nevertheless,
this problem is more complex than a common clas-
sification process like SVM or RVM since there is
no clear definition of what an unexpected event is,
and so no database of negative samples is available.
Although, one class SVM could have been used, the
features learnt do not spread on a high dimensional
space. We propose an unsupervised learning based
solution to build a model of expected events from a
set of videos with an algorithm simpler than one class
SVM.
3 PROPOSED METHOD
3.1 Overview
Giving an offline video stream from a fixed camera,
our system is able to learn from a cumulated opti-
cal flow orientation computed into regular blocks of
the image, a non-parametric likelihood representa-
tion. Since the complexity of non-parametric models
depends on the size of the training set, we propose
an original approach to build a sparse vector machine
based model by selecting only relevant samples for
approximatingthe non-parametriclikelihood. Finally,
a classification rule is deduced from this likelihood
to classify the main orientation on each block during
online analysis from the same fixed camera (see the
outline on fig.1).
This method has the asset to be completely auto-
matic: no camera calibration is needed, no labelling
task has to be done on the learning database. More-
over, our sparse representation is particularly adapted
for real-time classification during online analysis.
AN UNSUPERVISED LEARNING BASED APPROACH FOR UNEXPECTED EVENT DETECTION
507
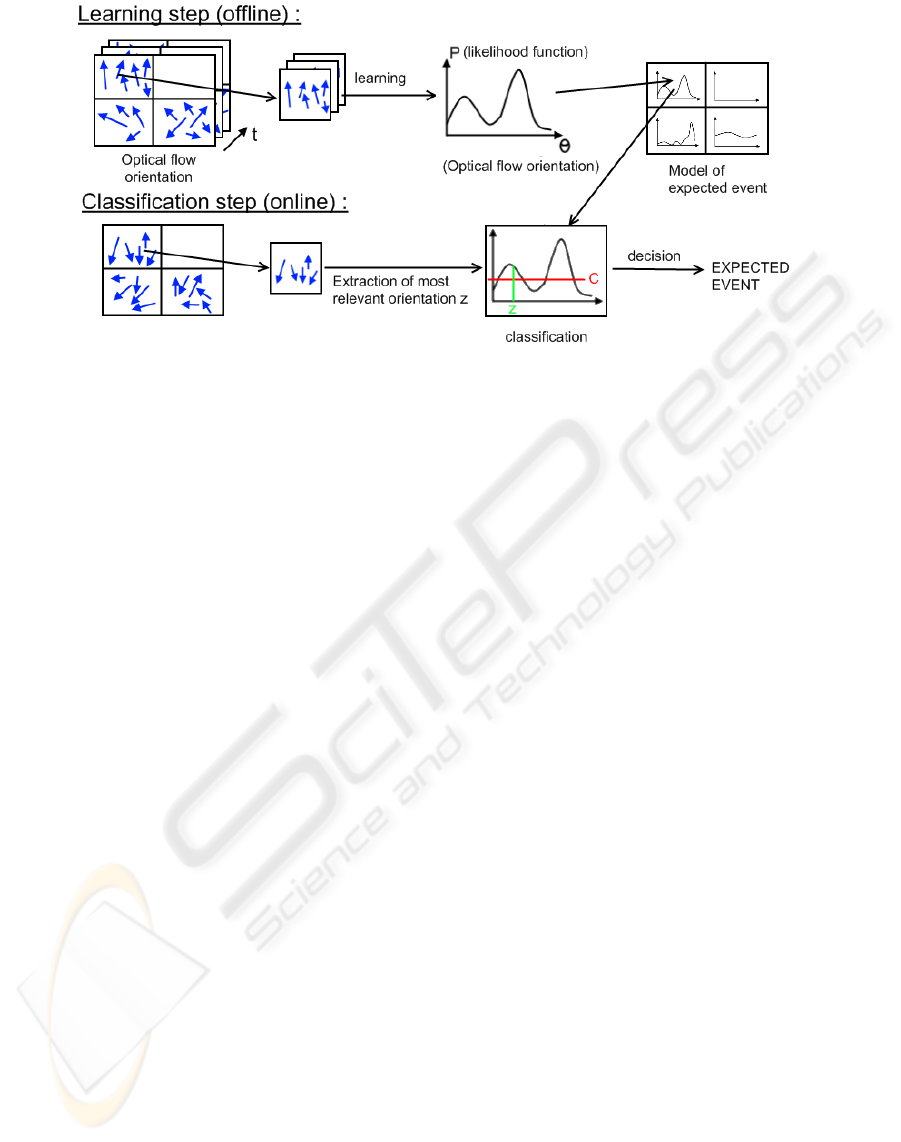
Figure 1: Outline of the system.
3.2 Likelihood based Decision
Let I denotes a training video sequence. Each im-
age is split into a set of N blocks and optical flow
orientations are associated to each block. Z
Z
Z
(n)
.
=
(z
(n)
1
,z
(n)
2
,...,z
(n)
K
)
T
represents a vector composed by
the history of all optical flow orientations.
We define a Bernoulli random variable ω
(n)
k
with
value in {ω
1
;ω
2
}: ω
(n)
k
= ω
1
if the event associated to
the block n is an expected event and ω
(n)
k
= ω
2
if the
event associated to the block n is an unexpectedevent.
Since nothing is known on the unexpected event like-
lihood function P(z
(n)
k
|ω
(n)
2
), we choose to define as
unexpected event, observations which cannot be suf-
ficiently reliably assigned to the expected likelihood
function P(z
(n)
k
|ω
(n)
1
). In other words, observations
with too low values in the expected likelihood distri-
bution are considered as unexpected.
b
ω
(n)
= ω
(n)
2
if P(z
(n)
k
|ω
(n)
1
) < C (1)
where C is a detection threshold experimentally de-
termined.
The likelihood P(z
(n)
k
|ω
(n)
1
) can be represented ei-
ther by parametric or non-parametric models.
In the first case, GMMs (Gaussian Mixtures Mod-
els) are widely used to approximate the likelihood.
For example Stauffer and Grimson in (Stauffer and
Grimson, 2000) used a fixed number of gaussians
GMM for background substraction. EM (Expec-
tation Maximization) algorithms are generally used
for GMM parameters estimation but without restric-
tions on the number of gaussians in recent version
(Figueiredo and Jain, 2002). Recently, Han in (Han
et al., 2008) proposed a mean-shift based approach to
approximate a given distribution with GMMs.
Non parametric models approximate the distri-
bution from samples using kernel based estimation
(Parzen windows model (Duda et al., 2001)):
b
P(z
(n)
k
|ω
(n)
1
) ≈K
−1
K
∑
k
′
=1
φ
(n)
k
′
(z
(n)
k
) (2)
where φ
(n)
k
′
(z
(n)
k
) is a kernel function (not neces-
sarly gaussian). With such a model, no assumption
needs to be done over the number of mode of the dis-
tribution. Nevertheless, one of the drawbacks of this
model is that the estimation of the probability is pro-
portional to the number of samples used. Reduced
models can be designed by randomly selecting a sub-
set of Z
Z
Z
(n)
. We propose another solution wherein a
sparse model is obtained by approximating eq. (2)
by a weighted sum of basis functions. In order to be
as generic as possible, we choose the non paramet-
ric model instead of GMM aiming at being able to
adapt to more atypical distribution. More specific ker-
nel functions may be more appropriated than classical
gaussians for these distributions.
3.3 A Sparse Vector Machine Model for
Density Estimation
Equation 2 can also be expressed with the compact
form:
b
P(z
k
|ω
1
) ≈w
w
w
T
(φ
φ
φ(z
k
)) (3)
with w
w
w
T
= (1,...1)
T
/K is a vector of size K and
φ
φ
φ(z
k
) is a vector function defined by φ
φ
φ(z
k
) =
(φ
1
(z
k
),φ
2
(z
k
),...,φ
K
(z
k
)). For the sake of clarity,
the bloc index has been left out. This model has the
same form as models used for Support Vector Ma-
chines (Burges, 1998) or Relevant Vector Machines
(Tipping, 2001).
VISAPP 2009 - International Conference on Computer Vision Theory and Applications
508

We propose to obtain a sparse model from equa-
tion (3) by fixing most of the parameters of w
w
w to zero
as it is classically done. Let Φ denote, a matrix of
size K ×K associated to the block n and built such
as the element of the line i and column j is given
by Φ
i, j
= φ
i
(z
j
). Φ is a square and symmetric ma-
trix, from which, an estimator of the likelihood as-
sociated to the sample z
k
of the training set is given
by
b
P(z
k
|ω
1
) ≈ (1
1,K
)Φ(0
1,k−1
,1,0
1,K−k+1
)
T
(the sum
of the elements of the line or the column k of Φ). A
likelihood vector ϕ
ϕ
ϕ related to the training set is built:
ϕ
ϕ
ϕ = Φ(1
K,1
)/K (4)
The sparse model is built in a two step recursive pro-
cess:
1. The sample of the training set which has the maxi-
mum likelihood is selected fromϕ
ϕ
ϕ and considered
as a relevant vector:
v(m) = argmax
i
ϕ
m,i
(5)
where ϕ
m,i
is the i
th
element of ϕ
ϕ
ϕ
m
and ϕ
ϕ
ϕ
m
= ϕ
ϕ
ϕ for
m = 1.
2. The likelihood estimator is updated:
ϕ
ϕ
ϕ
m+1
= ϕ
ϕ
ϕ
m
−
ϕ
m,v(m)
Φ
v(m),v(m)
φ
φ
φ
z
v(m)
(6)
Steps one and two are repeated until m = M such
as ϕ
M,v(M)
/ϕ
1,v(1)
> t
v
. The parameter t
v
represents
the precision of the likelihood approximation. For a
coarse approximation t
v
can be increased. In this case
the number of used vectors decreases. Illustration of
the effect of this parameter is given in section 4.1. Fi-
nally, the estimator is written by:
b
P(z
k
|ω
1
) ≈
˜
w
w
w
T
˜
φ
φ
φ(z
k
) (7)
with
˜
w
w
w
T
=
ϕ
1,v(1)
Φ
v(1),v(1)
,
ϕ
2,v(2)
Φ
v(2),v(2)
,...,
ϕ
M,v(M)
Φ
v(M),v(M)
(8)
and
˜
φ
φ
φ(z
k
) =
φ
v(1)
(z
k
),φ
v(2)
(z
k
),...,φ
v(M)
(z
k
)
T
(9)
This approach enables to give a good approxi-
mation of the likelihood with few vectors. Initially,
the non parametric model set Z
Z
Z contained K ele-
ments whereas the sparse vector machine model
e
Z
Z
Z =
(v(1),v(2),...,v(M)) contains only M elements with
M ≪K. Let us remember that this reduction in size is
compulsory since it makes the real-time classification
possible.
3.4 Online Classification Step
Online classification based on equation (1) which can
be rewritten with our sparse model by :
b
ω = ω
2
if
˜
w
w
w
T
˜
φ
φ
φ(z) < C (10)
For the area n, a set of optical flow orientation is
computed. The most relevant vector z is then esti-
mated using equation (5) by changing Z by the set of
optical flow orientations associated to the area n.
4 EXPERIMENTS
This section presents the experiments done in order
to validate the proposed method. The first part shows
the ability of the sparse model to approximate the dis-
tribution of optical flow orientation. The second part
discusses the performances of the algorithm in two
cases of traffic monitoring.
4.1 Non Parametric Representation
We make the common choice to use Gaus-
sian data-centred basis functions, φ
(n)
k
′
(z
(n)
k
) =
1
σ
l
√
2π
exp{−
d
2
θ
(z
(n)
k
,z
(n)
k
′
)
2σ
2
l
}. Moreover, d
θ
(z
(n)
k
,z
(n)
k
′
) is a
distance between two angles defined by :
d
θ
(θ
1
,θ
2
) =
min( (θ
2
−θ
1
),|θ
2
−(θ
1
+ 2π)| )
π
with θ
1
< θ
2
(11)
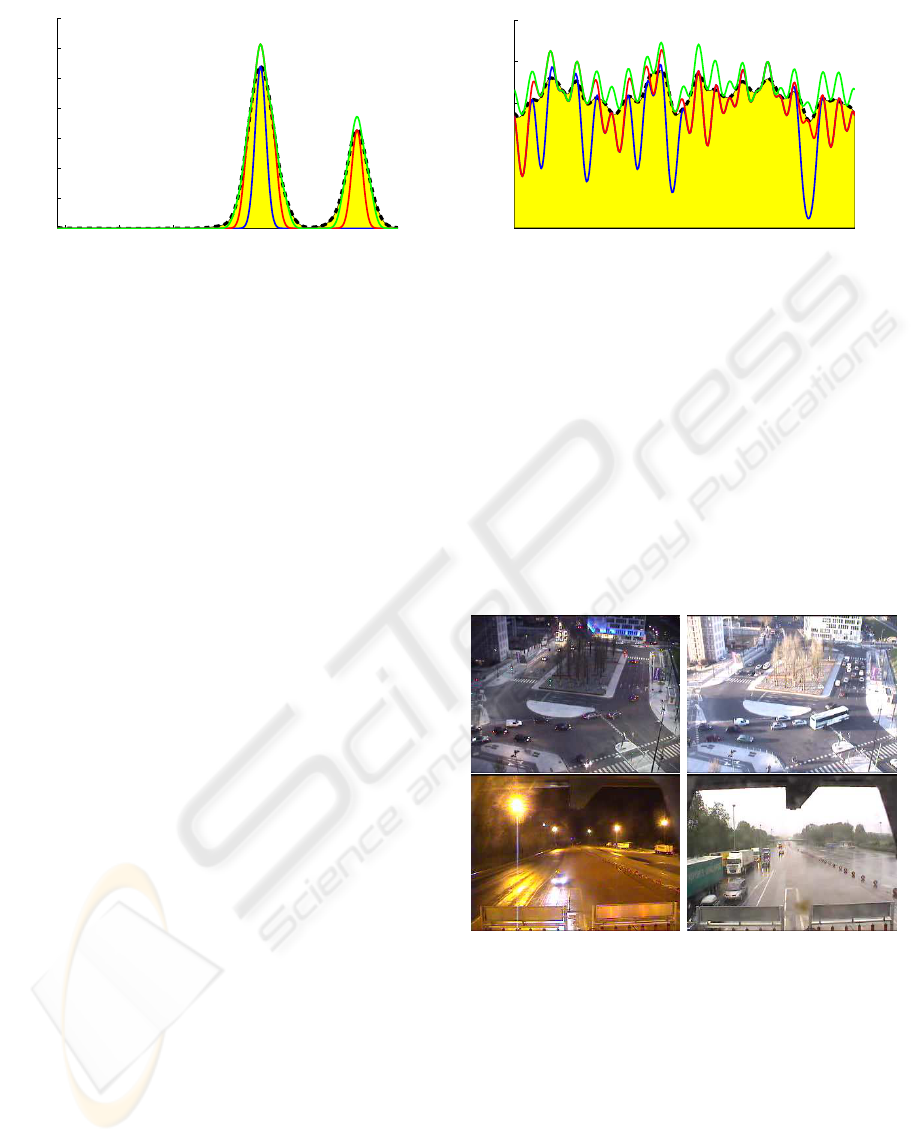
The sparse non parametric approximation
e
Z
Z
Z
(n)
presented before has been compared to the expanded
one Z
Z
Z
(n)
. To make this comparison, the theorical
probability representing the non parametric estimator
of the likelihood of equation (2) has been represented
with the yellow area limited by the black dashed curve
on fig.2. The sparse probability
e
Z
Z
Z
(n)
has been drawn
for several values of t
v
with the blue, red and green
curves on fig.2.
The sparse kernel based model curves on fig.2
show that our reduced representation
e
Z
Z
Z
(n)
match the
theorical probability. The variance parameter σ
l
should be chosen large enough to have a sufficient de-
crease in the number of selected vectors with a correct
approximation, but also not to big to separate differ-
ent modes. Experimentally a value of σ
l
= 0.1 has
been chosen. Concerning t
v
which determines how
many selected vectors will be kept or in other words
the precision of the likelihood approximation. We can
see on the two mode distribution of fig. 2 that for high
value of t
v
(blue and red curves), the bandwidth of the
AN UNSUPERVISED LEARNING BASED APPROACH FOR UNEXPECTED EVENT DETECTION
509
−3 −2 −1 0 1 2 3
0
0.2
0.4
0.6
0.8
1
1.2
1.4
Orientation angle (radian)
Normal event likelihood
−3 −2 −1 0 1 2 3
0
0.05
0.1
0.15
0.2
0.25
Orientation angle (radian)
Normal event likelihood
Figure 2: Appoximation of the kernel based non parametric density estimation with a spare kernel base model on two different
kind of distribution: The yellow area limited by the black dashed curve shows the kernel based non parametric density
estimation. The blue curve (t
v
= 0.7), the red one (t
v
= 0.4) and the green one (t
v
= 0.08) show the sparse kernel based density
estimation.
sparse density approximation mode is truncated com-
pared to the non parametric density. Smaller modes
can even be forgotten (blue curve). The number of se-
lected vectors, that is to say the number of gaussians
needed for the approximation are respectively 1, 4 and
8 for the blue, the red and the green curves. For a
uniform random distribution, a lot of selected vectors
are needed for a correct approximation. Therefore,
the parameter t
v
needs to be small enough to approx-
imate correctly all the orientations possible contrary
to the blue curve which underestimates some specific
orientations. Here 21, 26 and 39 gaussians have been
needed for the approximation for the blue, the red and
the green curves respectively.
4.2 Classification
The performance of the system has been evaluated on
two different scenes: a traffic cross-road with clear
circulation way and a toll barrier. Sequences for both
scenes were captured on real webcams in very various
weathers going from sunny to cloudy through rainy
condition, but also under very different light condi-
tions such as projected shadows, specular lights, re-
flects on the ground, etc (e.g. fig.3). Each video of
the dataset is a quite low resolution, 320x240 size at
about 12 fps with sometimes very poor objective lens.
The videos taken every 20 minutes, last about 30 sec-
onds each. The learning has been done over one hun-
dred videos. The block are 10x10 size, that is to say a
total of 768 blocks for each image.
For the movement evaluation, different optical
flow techniques have been tested, from Lucas &
Kanade and its variants to “Block matching method”
(Barron et al., 1992) through Proesmans method
(Proesmans et al., 1994) and others. From all the
different techniques, the Black & Anandan method
(Black and Anandan, 1996) has been kept for its ro-
bustness and the cleanliness of its result compared to
others methods, but also for its relative fast computa-
tion. This method is based on a piecewise affine mo-
tion assumption which is generally satisfied for our
type of scene.
Moreover, the use of this techinque makes the
system work whichever lighting condition since opti-
cal flow techniques are usually invariant to illumation
changes.
Figure 3: Example of weather conditions in the video
database used for learning. Top row images are taken from
the traffic cross-road sequence and the bottom one from the
toll.
The classification performance of the system has
been evaluated in real conditions. The analysis has
been done over 162 videos for the traffic cross-road
and 256 videos for the toll. The anomalies researched
were of different types from pedestrians not walking
on zebra crossing to scooters leaving the pavement
through wrong way mouvement or cars pulling out
just before the toll. The classification was done on
a P4 3.4GHz. The optical flow is computed in 0.11s
VISAPP 2009 - International Conference on Computer Vision Theory and Applications
510
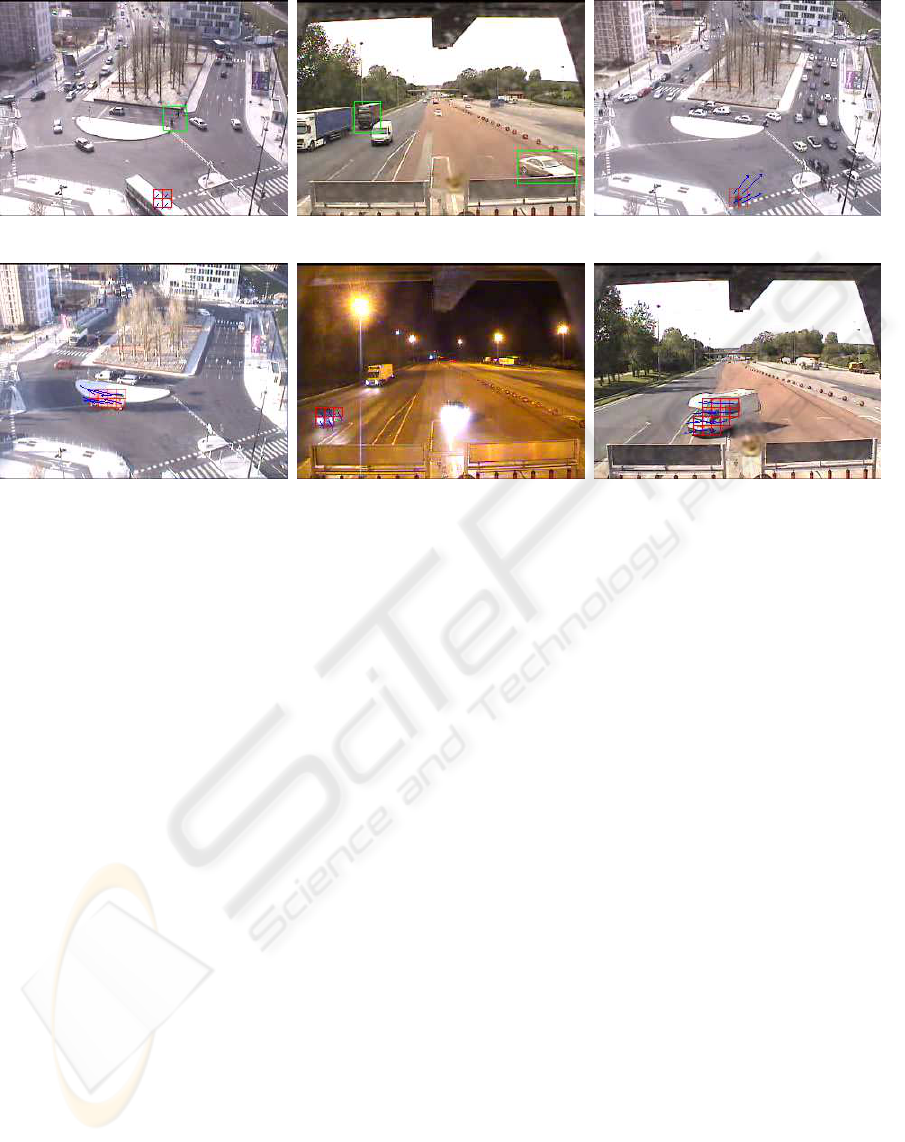
(a) (b) (c)
(d) (e) (f)
Figure 4: Different unexpected event samples. The red square represents the unexpected block detected according to the most
relevant vector of this block at time t represented with the blue arrow. The green squares point out missed unexpected events.
(a) Unexpected pedestrians crossing out of zebras and false alarm example on the bus at the bottom, (b) Double missing
detection on a car on the right and on a truck on the left that are both suddenly pulling out, (c) Scooter leaving the pavement
following an unsual trajectory, (d) Firefighter truck going wrong way to avoid held up lanes, (e) Car changing direction at the
last minute on the left of the camera, (f) Motorhome going across several lanes to reach heavyweight lane
per frame. The computation time for analysing one
block depends on displacement vector density in the
block. Non computed for motionless blocks, it takes
about 5ms, that is an average of 0.2s per frame. For
the sequence studied so far, these computation per-
formances are close to real-time even with a non op-
timized code. Moreover, the real-time classification
lends itself very well to parallelization on graphic
cards or multithread architectures in order to increase
the framerate.
An unexpected event is considered to be detected
if the system has pointed out at least one block on
the guilty object during the unexpected event (e.g.
fig.4(d)). False alarms have been counted on the same
way, when at least one block appears on an area with-
out true anomaly still during the manoeuvre length
(e.g. fig.6). This manual count has been done from
the warnings per image provided by the classifier.
Even though the system gives a frame warning in-
stead of an event warning (no temporal consistency
on events is performed), we choose to present an event
count as it is a measure of the performance of the sys-
tem very close to what it is expected to do. Indeed,
the system should alert a security officer when some-
thing goes wrong, no matter where the problem oc-
curs which is usually obvious for a human. The sys-
tem parameters have been chosen in order to have the
maximum of good detections with the minimum false
alarms.
The parameter C is deciding to guarantee a low
rate of false alarm, the higher it is, the smaller a devi-
ation from a learning orientation will be considered as
abnormal. As a consequence, to avoid false alarm due
to noise, orientation compution imprecision, etc, pa-
rameter C should be chosen quite low even if correct
detections are missed.
With the parameter C equals to 0.3, 17 warnings
have been raised over toll sequences total length of
7680 seconds, that is to say an average of one warn
every 451 seconds. On these 17 warnings, 16 were
real unexpected events whereas the last warning was
a false alarm. Traffic cross road sequences is far more
harder situation to monitor since the circulation ways
are more intricate, the vehicle are smaller, etc. How-
ever, the system still warns 7 times over the 5160s of
the total length , that is to say on average of one warn
every 737 seconds. Over these 7 detections only 3
were real unexpected events. More events could have
been detected for both sequences but with a tremen-
dous increase in the false alarms as shown on table
AN UNSUPERVISED LEARNING BASED APPROACH FOR UNEXPECTED EVENT DETECTION
511
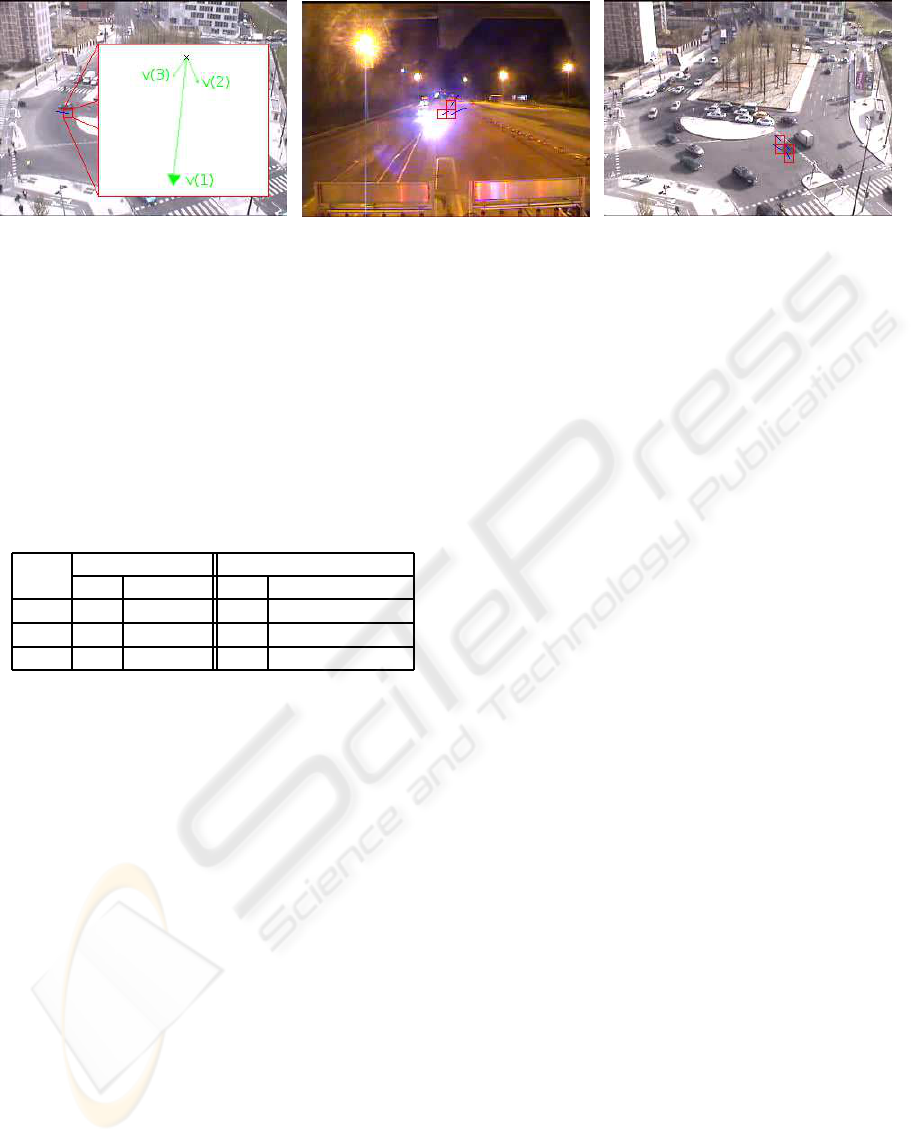
Figure 5: Example of false alarm due
to wrong learning orientation. The three
vectors kept in sparse model have been
represented in green. All of them go
downward.
Figure 6: Example of false alarm due to
the aperture problem. The optical flow
vector are normal to the light beam edge
giving completely wrong results.
Figure 7: Example of false alarm due to
projected shadow. The shadow expands
on areas where no movement from down
right corner to up left corner are never
seen.
1. Figures 4(c)-4(f) illustrate the events to detect, the
main direction for each guilty block but also the de-
tection conditions for each videos (especially lighting
condition). Nevertheless, figures 4(a) and 4(b) show
missing detections surrounded with a green square.
Table 1: Detection results for different C values. CD stands
for Correct Detection and FA stands for False Alarm.
C
Toll sequences Cross-road sequences
CD FA CD FA
0.3 16 1 3 4
0.43 28 10 4 38
0.58 38 113 13 164
Due to a large number of wrong positive de-
tections that punctually appear, blurrings have been
applied to the classifier output. Assuming that an
anomaly remains for several frames and spreads from
one block to an adjacent one, a temporal blurring has
been applied by finding the best relevant orientation
among the orientations of the last k frames. Experi-
mentally, using k = 2 deletes some detection noises
due to error in the displacement field computation.
Furthermore, a first order temporal filter with a spatial
blurring which balances the response of the neighbour
blocks has been applied.
Most of the remaining wrong positive detection
(wrong unexpected event detected) are mainly due to
three reasons: The first one is a possible motion that
has not been learnt (this motion has not been seen
enough into the training database). An illustration of
this, is shown on fig.5 where the learning orientation
has been represented in green. We can see that the
learning on this block forgets the relevant orientation
towards the left leading to warnings when a car comes
from the right. The second reason occurs when the
low level (optical flow) provides noisy features. Here,
the aperture problem during optical flow computation
is the main cause of noisy features. This problem is
intrinsic to the way optical flow is computed. This
problem often appears on shadows or beams of head-
lights returning completely wrong displacement di-
rection (e.g. fig.6). To attenuate these unwanted ef-
fects, a correlation of the optical flow with an Harris
score (Harris and Stephens, 1988) has been done in
order to compute the optical flow only on corner fea-
tures. The third reason is the projection of shadows
of objects on the floor. In those case, the shadow gen-
erate artefacts, moving in the same direction as the
real object, but that could spread over areas with com-
pletely different learnt directions (e.g. fig.7). This last
problem is hard to deal with.
5 PERSPECTIVES AND
CONCLUSIONS
We have proposed a generic system for unexpected
event detection by vision. The latter learns the orien-
tations of motion on a scene and checks those orien-
tations afterward during live real-time analysis. We
have proposed a sparse representation of the distribu-
tion of local optical flow orientation by a linear kernel
based model. The resulting algorithm has been tested
on real sequences and we have shown that the method
is able to classify unexpected events like wrong way
movement, car pulling out in toll line-up or turn-
ing back, etc. Even though the test has been done
over traffic sequences, this algorithm can also be use-
ful for monitoring pedestrians in indoor corridors as
shown on fig.8, where two people are detected go-
ing wrong way since the pedestrians normally walk
counter clock-wise, that is to say upward on the right
side and downward on the left side. Future work
will aim at reducing the wrong detections, often due
to noisy features provided by the optical flow algo-
rithm. Several solutions are under consideration : to
replace the optical flow by other approaches like de-
VISAPP 2009 - International Conference on Computer Vision Theory and Applications
512
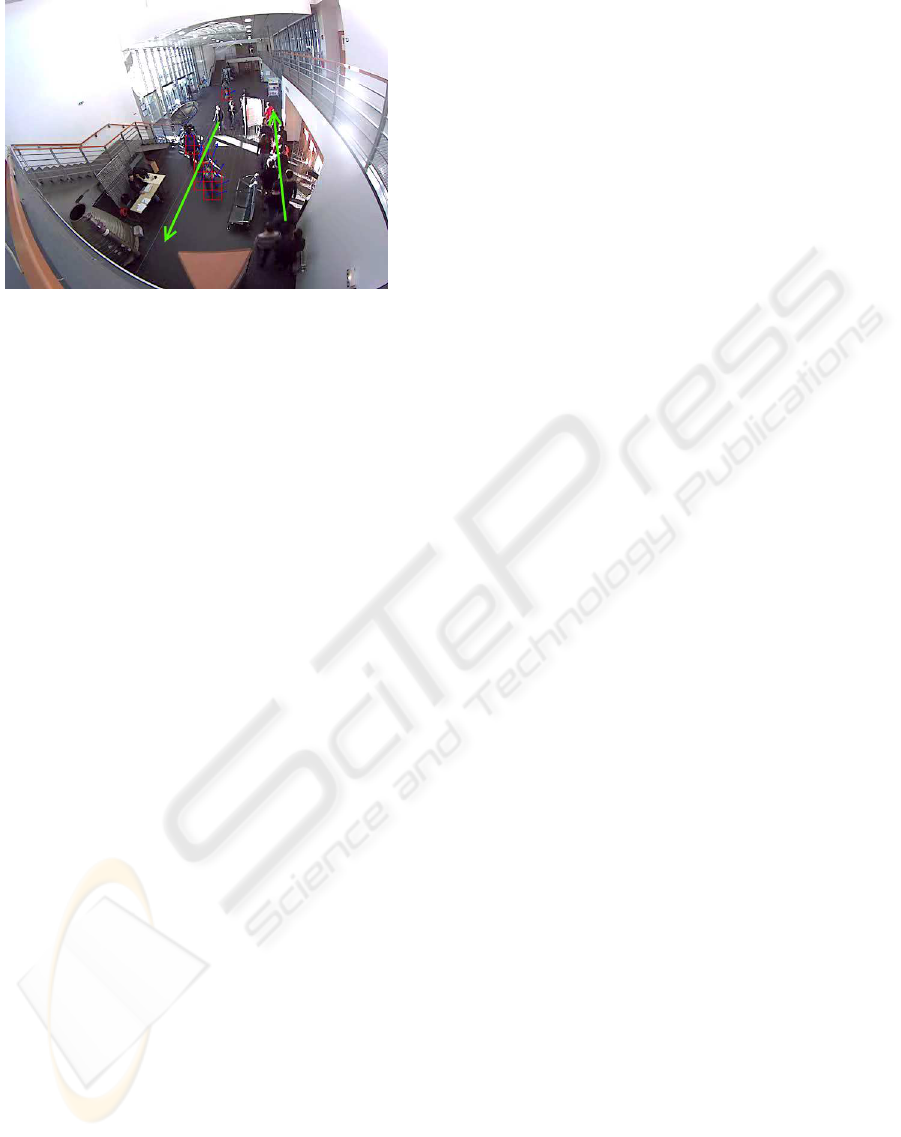
Figure 8: Crowd monitoring example. The expected circu-
lation way has been represented with the green arrows.
tection/matching, to add more efficient temporal blur-
ring in order to have event warning instead of image
warning, to make a discussion over the best type of
kernel to use and finally to compute an adaptative de-
tection threshold C in relation to the learnt distribu-
tion. Moreover, the system only detects anomalies
linked to motion. Expansion to motionless or micro
movement detection is also expected for future in or-
der to enlarge the types of anomalies to detect (person
on the ground, suspect parking ...).
This method has been designed in order to be as
generic as possible with no supervising, as a conse-
quence it may also be used in completely different
fields than video surveillance. We can imagine to use
this approach for detecting perturbations on satellite
imaging of solar streams for example.
REFERENCES
Andrade, E. L., Blunsden, S., and Fisher, R. B. (2006).
Hidden markov models for optical flow analysis in
crowds. In International Conference on Pattern
Recognition (ICPR), volume 1, pages 460–463.
Barron, J., Fleet, D., Beauchemin, S., and Burkitt, T.
(1992). Performance of optical flow techniques.
Computer Vision and Pattern Recognition (CVPR),
92:236–242.
Black, M. J. and Anandan, P. (1996). The robust estima-
tion of multiple motions: parametric and piecewise-
smooth flow fields. Computer Vision and Image Un-
derstanding (CVIU), 63(1):75–104.
Blunsden, S., Andrade, E., and Fisher, R. (2007). Non para-
metric classification of human interaction. In Pattern
Recognition and Image Analysis (PRIA).
Brostow, G. j. and Cipolla, R. (2006). Unsupervised
bayesian detection of independant motion in crowds.
In Computer Vision and Pattern Recognition (CVPR).
Burges, C. J. C. (1998). A tutorial on support vector
machines for pattern recognition. Data Mining and
Knowledge Discovery, 2:121–167.
Dong, L., Parameswaran, V., Ramesh, V., and Zoghlami, I.
(2007). Fast crowd segmentation using shape index-
ing. In International Conference on Computer Vision
(ICCV).
Duda, R., Hart, P., and Stork, D. (2001). Pattern Classifica-
tion. John Wiley & Sons Inc.
Figueiredo, M. and Jain, A. (2002). Unsupervised learning
of finite mixture models. Pattern Analysis and Ma-
chine Intelligence, 24(3):381–396.
Freund, Y. and Schapire, R. E. (1996). Experiments with
a new boosting algorithm. In Proceedings of the
30th International Conference on Machine Learning
(ICML), pages 148–156.
Han, B., Comaniciu, D., Zhu, Y., and Davis, L. S. (2008).
Sequential kernel density approximation and its appli-
cation to real-time visual tracking. Pattern Analysis
and Machine Intelligence, 30:1186–1197.
Harris, C. and Stephens, M. (1988). A combined corner
and edge detector. In Alvey Vision Conference, pages
147–151.
Hu, W., Xiao, X., Fu, Z., Xie, D., Tan, T., and Maybank,
S. (2006). A system for learning statistical motion
patterns. IEEE Pattern Analysis And Machine Intelli-
gence, 28:1450–1464.
Junejo, I. N. and Foroosh, H. (2007). Trajectory rectifica-
tion and path modeling for video surveillance. In In-
ternational Conference on Computer Vision (ICCV).
Li, Y. and Ai, H. (2007). Fast detection of independent mo-
tion in crowds guided by supervised learning. In In-
ternational Conference on Image Processing (ICIP).
Proesmans, M., Gool, L. V., Pauwels, E., and Oosterlinck,
A. (1994). Determination of optical flow and its dis-
continuities using non-linear diffusion. In European
Conference on Computer Vision (ECCV).
Rabaud, V. and Belongie, S. (2006). Counting crowded
moving objects. In Computer Vision and Pattern
Recognition (CVPR).
Sidla, O. and Lypetskyy, Y. (2006). Pedestrian detection
and tracking for counting applications in crowded sit-
uations. In Advanced Video and Signal Based Surveil-
lance (AVSS).
Singh, S., Machiraju, R., and Parent, R. (2007). Visual anal-
ysis of trajectory clusters for video surveillance.
Stauffer, C. and Grimson, W. E. L. (2000). Learning pat-
terns of activity using real-time tracking. IEEE Pat-
tern Analysis And Machine Intelligence, 22:747–757.
Tipping, M. E. (2001). Sparse bayesian learning and the rel-
evance vector machine. Journal of Machine Learning
Reasearch 1.
Velastin, S. A., Boghossian, B. A., and Vicencio-Silva,
M. A. (2006). A motion-based image processing
system for detecting potentielly dangerous situations
in underground railway stations. Transportation Re-
search Part C: Emerging Technologies, 14.
Zhao, T. and Nevatia, R. (2004). Tracking multiple humans
in complex situations. IEEE Pattern Analysis And Ma-
chine Intelligence, 26:1208–1221.
AN UNSUPERVISED LEARNING BASED APPROACH FOR UNEXPECTED EVENT DETECTION
513
