
EVALUATION OF A ROAD SIGN PRE-DETECTION SYSTEM BY
IMAGE ANALYSIS
Philippe Foucher, Pierre Charbonnier and Houssem Kebbous
ERA 27 LCPC, Laboratoire des Ponts et Chauss
´
ees, 11 rue Jean Mentelin, B.P. 9, 67035 Strasbourg, France
Keywords:
Image analysis, Road sign detection, Road sign inventory, Color, Shape, Symmetry, Evaluation.
Abstract:
In this paper, we introduce a pre-detection algorithm dedicated to French danger-warning and prohibitory
road signs. The proposed method combines color, shape, location and symmetry features to select among
large image databases, a small subset of pictures that probably contain road signs. We report the results of
a systematic experimental assessment that we performed on five image databases, comprised of more than
26,000 images, covering 176 km and containing 371 traffic signs, among which a non-negligible amount
(about 5% in average) is damaged. The experiments show that about 10% images of the sequences are selected
and more than 87% traffic signs are detected. The missed objects always correspond to dirty, worn-out or badly
oriented signs that would be difficult to detect even for a human operator.
1 INTRODUCTION
In this paper, we address the problem of road sign
inventory. In our application, evenly spaced still-
images of the roadway and its close surroundings (see
e.g. Fig. 1) are collected by inspection vehicles along
itineraries, typically one image every 5 or 10 meters.
These image databases are then processed off-line by
human operators, which is fastidious and prone to
oversights. Our research aims at proposing image
analysis tools for automating the operator’s task. In
particular, it may be useful to select, among all the
data set, the small number (typically, 5 to 10 %) of im-
ages that probably contain road signs. We propose in
this paper such a pre-detection procedure, that relies
on color, shape, location and symmetry features. The
algorithm is described in the case of French danger-
warning and prohibitory signs, which are red, but may
readily be extended to other types of colored road
signs. The second contribution of the paper is that
we perform a systematic and objective evaluation of
the pre-selection procedure on large image databases,
taken by various cameras.
The paper is organized as follows. We first pro-
pose a brief review of related work (Sect. 2). Then,
Sect. 3 describes the three steps of the pre-detection
algorithm. Sect. 4 presents the experimental setup
and in Sect. 5 we comment the experimental results.
2 RELATED WORK
Traffic sign detection and recognition by image anal-
ysis are useful for many applications such as road sign
inventory, driving assistance or autonomous systems.
In the last two decades, many research teams have
been interested in this topic, see e.g. (Barnes et al.,
2008) for a recent survey. Detection methods gener-
ally rely on the fact that road signs are manufactured,
standardized objects, whose shape, dimensions, color
and location are fixed by norms. However, detection
systems encounter typical problems of computer vi-
sion in uncontrolled environments, such as: variations
in lighting conditions (brightness, reflections, shad-
ows...), geometric distortions (rotations), complex-
ity of road scenes (neighboring objects with similar
color, occlusions), object’s wear and tear. In many re-
searches, the detection system uses a combination of
color and shape information. Color-based segmenta-
tion is commonly applied first, to extract pixels corre-
sponding to the color of the road sign. The Hue com-
ponent, which is not sensitive to lighting changes, is
usually used for this task (Shaposhnikov et al., 2002;
de la Escalera et al., 2003). However, an efficient
alternative is to consider the normalized component
R/(R + G + B) which is also independent on light-
ing changes (Dutilleux and Charbonnier, 2007). Sec-
ondly, the connected components are selected accord-
ing to some shape parameters, e.g. size of the ob-
ject area (Maldonado-Bascon et al., 2007), geometri-
362
Foucher P., Charbonnier P. and Kebbous H. (2009).
EVALUATION OF A ROAD SIGN PRE-DETECTION SYSTEM BY IMAGE ANALYSIS.
In Proceedings of the Fourth International Conference on Computer Vision Theory and Applications, pages 362-367
DOI: 10.5220/0001801003620367
Copyright
c
SciTePress

cal properties of edge segments (Piccioli et al., 1996)
(note that in (Piccioli et al., 1996), the robustness of
the shape detector to occlusions is not discussed).
Some authors directly work with grey-level im-
ages to avoid the difficulties of color-based segmenta-
tion. For instance, (Loy and Barnes, 2004) adapt the
Fast Radial Symmetry detector described by (Loy and
Zelinsky, 2003) to the detection of regular polygon.
This paper presents a systematic evaluation of the
performance of the pre-detection algorithm on differ-
ent sets of sequences. In the literature, the evaluation
of road sign detectors often concerns only a limited
number of images and/or situations. To our knowl-
edge, quantitative evaluation on a large database was
only performed in (Priese et al., 1993). In this project,
a detection and recognition algorithm was tested on
20000 images and the performance were given in
terms of true detections and false alarms. More re-
cently, (Barnes et al., 2008) uses the Receiving Op-
erating Characteristic (ROC) curves to perform a sys-
tematic evaluation of a detection and recognition al-
gorithm.
3 METHODOLOGY
The symmetry algorithms applied to large-size color
image implies a prohibitive computation time. Cur-
rently, computing in Matlab the polygonal symmetry
transform on a single 1280 × 1024 image takes 1273
seconds. Even if an implementation in C may acceler-
ate the process, a pre-selection of connected compo-
nents based on color and shape information seems to
be appropriate. Therefore, our complete pre-detection
algorithm consists of three steps: (1) color-based seg-
mentation (2) selection of resulting connected com-
ponents according to the size, shape and position of
the candidates (3) selection by a symmetry criterion.
3.1 Color
In most countries, warning and prohibitory traffic
signs have a thick red border, which is a very discrimi-
nant characteristic. In the first step of the method, pix-
els are (individually) classified into red/non-red. An
(R,G,B) pixel is considered as red if (Dutilleux and
Charbonnier, 2007):
R > α(G + B)
R − max(G,B) > β[max(G,B) − min(G, B)]
(1)
The first expression selects pixels whose normalized
red component R/(R + G + B) dominates. Normal-
ization provides robustness to lighting changes. The
second expression filters out pixels that tend either
towards yellow or towards magenta (Dutilleux and
Charbonnier, 2007). The threshold β has not been em-
pirically determined but we found the rule β = 2α sat-
isfactory for all the sequences we encountered. More-
over, our experience is that the best values for α, in
terms of classification performance, range between
0.55 and 0.6, the former being a less selective value
than the latter. An exemple of red classification map
is shown on fig. 1.
3.2 Size, Shape and Position
After pixel classification, red connected components
are examined according to several geometric parame-
ters, which reduces the number of candidates.
1. Connected components are first filtered according
to their area. The thresholds of course depend on
the characteristics of the image acquisition sys-
tem.
2. The position of the center of mass of the con-
nected component must be in a region-of-interest
which correspond to the standard road sign setting
in right-hand traffic countries (see Fig. 1).
3. The eccentricity of the components must be
smaller than a threshold, whose value results from
a trade-off between sensitivity to elongated ob-
jects (e.g. poles), that may result in false alarms,
and sensitivity to partial occlusions, that decrease
the capacity of detection. This value is empiri-
cally determined, as explained in Sec. 5.
4. Red connected components that correspond to
road signs are relatively empty objects. The ex-
tent of a connected component corresponds to the
ratio between its area and the area of its bound-
ing box. Bounds on the extent are set by taking
margins around the values deduced from norms.
This allows distinguishing yield signs from dan-
ger signs, for example.
5. In the case of warning signs, the orientation of
edges is a discriminant characteristic. The angles
between the lateral sides of the connected compo-
nent and the horizontal are checked. The valid-
ity range accounts for a certain margin around the
theoretical value of 60
◦
, to provide some flexibil-
ity with respect to badly oriented traffic signs.
3.3 Symmetry
The last selection step checks if the remaining con-
nected components are symmetric. To this end, we
compute the Fast Radial Symmetry transform (or its
extension to polygonal objects) of the luminance im-
age, on a window that corresponds to the bounding
EVALUATION OF A ROAD SIGN PRE-DETECTION SYSTEM BY IMAGE ANALYSIS
363
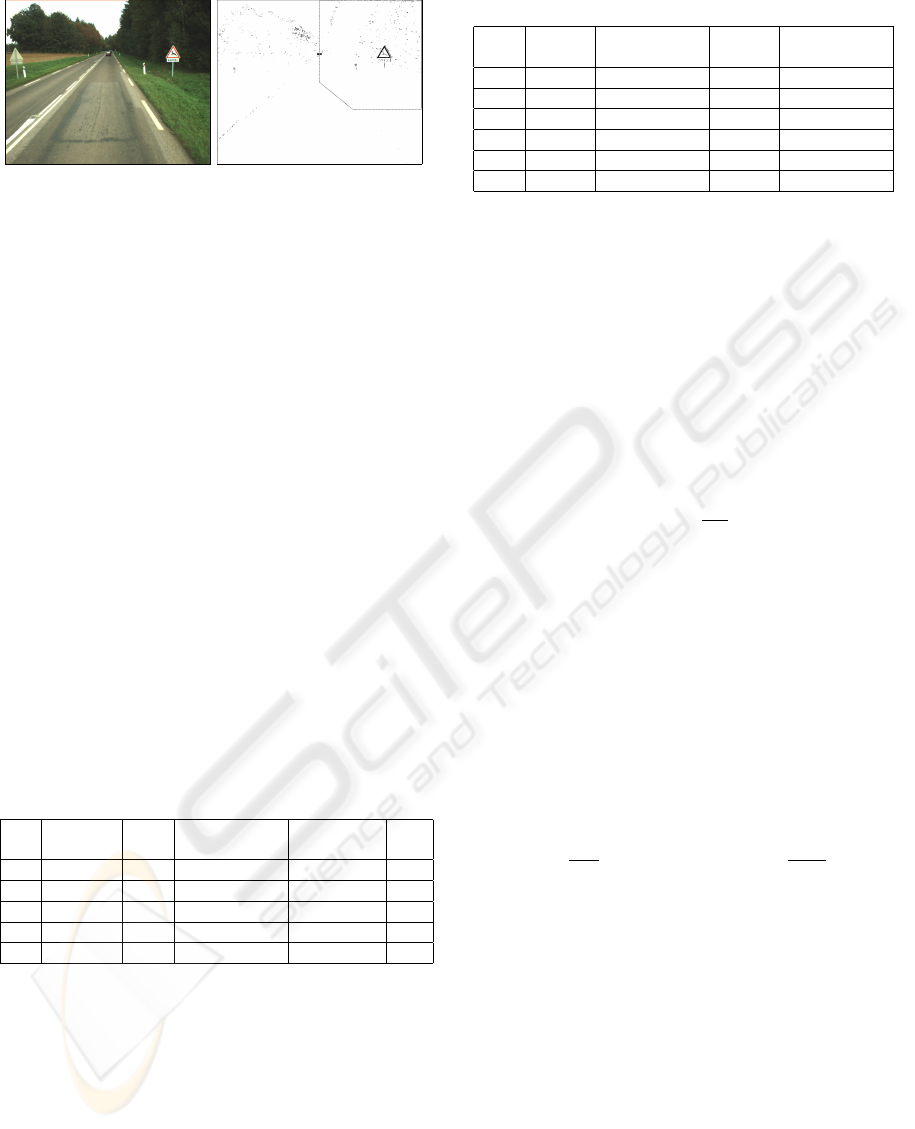
Figure 1: Road scene example (left); red/non-red pixel clas-
sification (right). The dotted polygon shows the search re-
gion for the selection of connected components. Pixels clas-
sified as red are shown in black.
box of each selected component. Checking the sym-
metry of an object simply amounts to thresholding
the resulting vote image. When all connected com-
ponents have been examined, the image is selected or
not, according to the number of remaining objects.
4 EXPERIMENTAL SETUP
4.1 Evaluation Data Sets
In this experimental validation, we consider real-
world image sequences acquired by frontal cameras
mounted on top of inspection vehicles. The charac-
teristics of the test sequences are given in Tab. 1. Im-
ages are taken every 5 or 10 meters, with several kinds
of CCD cameras under various, uncontrolled lighting
conditions. Note that the evaluation databases com-
prises about 26,000 images and covers more than 175
km of rural roads, urban roads and highways.
Table 1: Characteristics of the test sequences.
Seq. Number
of images
Step Camera Size (pixels) Size
(Ko)
S1 3436 5 m Basler A101 1280 ×1024 156
S2 3436 5 m Basler A101 1280 ×1024 156
S3 10420 5 m Marlin F145-C2 1280 × 1024 95.6
S4 890 10 m Pike F210-C 1920 × 1080 209
S5 8103 10 m Pike F210-C 1920 × 1080 223
4.2 Ground Truth
The test sequences were manually processed using
a specially designed software to establish a ground
truth, i.e. to list those images where road signs are
visible. Of course, a particular instance of road sign is
most of the time visible in several images. We there-
fore distinguish between the number of traffic signs
and the number of images that show traffic signs.
These numbers are given in Tab. 2 (WS stands for
warning signs and PS stands for prohibitory signs).
Table 2: Ground truth (manual analysis of test sequences).
Seq. Number
of WS
Numb. of im-
ages with WS
Number
of PS
Numb. of im-
ages with PS
S1 25 123 18 93
S2 12 81 5 44
S3 64 383 61 445
S4 9 36 18 63
S5 70 377 89 540
Total 180 1000 191 1185
We note that among the total number of road
signs, some of them (about 5% in average) are either
worn-out, dirty, badly oriented, or non-standard.
4.3 Evaluation Metrics
To evaluate the performances of the pre-detection sys-
tem, we use ROC curves, which plot the True Positive
Rate (TPR) vs the False Positive Rate (FPR). Each
point on a ROC curve corresponds to a particular set-
ting of the detector’s parameters.The False Positive
Rate is given by:
FPR =
FP
N
(2)
where FP is the number of images that contain at least
one false alarm. Note that false alarms may occur in
images that show a road sign, as soon as the detected
component does not fit in the ground-truth bounding
box. Hence, N is the total number of images in the
sequence.
In our application, it suffices to detect a sign once
over the series of images it appears in. Therefore, we
define two different true positive rates: the first one,
TPR
i
, for evaluating the detection of images with traf-
fic signs and the second one, TPR
rs
, for assessing the
detection of road signs. These are defined as:
T PR
i
=
T P
i
P
i
and T PR
rs
=
T P
rs
P
rs
(3)
where TP
i
is the number of selected images with traf-
fic signs, P
i
is the actual number of images with traffic
signs, TP
rs
is the number of detected traffic signs and
P
rs
is the actual number of traffic signs.
5 EXPERIMENTAL RESULTS
In this section, the results on our five test sequences
are presented and discussed. Some parameters are a
priori fixed from theoretical characteristics of traffic
signs. For example, the minimum size of connected
component is 200 pixels (corresponding to a 30 pixels
high object) and the maximum size is 2.5% the image
size (the size of the biggest observed sign corresponds
VISAPP 2009 - International Conference on Computer Vision Theory and Applications
364

to 1.5% the image size). The upper extent threshold
is fixed at 0.35 for the warning signs. The prohibitory
signs category includes the “no entry” sign, so the ex-
tent threshold is fixed at 0.65 at the risk of a higher
false alarm rate. The lower threshold is not used, to
accept occluded objects. The validity range for angle
in the case of warning signs is set to [50
◦
,70
◦
].
Sequences S1 and S4 are used to set the value α
and the thresholds of eccentricity and symmetry. The
algorithm is then tested on sequences S2, S3 and S5.
5.1 Considering Color and Eccentricity
In this series of experiments, the symmetry selection
is disabled, to focus on the effect of colour and ec-
centricity criteria. The influence of the red classi-
fication parameter, α and of the eccentricity thresh-
old is illustrated by the ROC curves plotted on fig. 3
for prohibitory signs and on fig. 5 for warning signs.
In these experiments, the eccentricity threshold varies
over the range [0.6, 1], and α is fixed to 0.55 or 0.6.
For both categories, α = 0.55 naturally yields more
false alarms than α = 0.6 but it may also be noticed
that the number of true positive is lower. In fact, since
more pixels are classified as red when α = 0.55, so
the red component that corresponds to the sign border
may connect with background elements and then, be
filtered off by the shape analysis stage. The influence
of the color parameter might be worth a more thor-
ough study. However, the value of α = 0.6 will be
considered in the remaining of the paper.
Concerning eccentricity, the best detection scores
are obtained for a threshold of 1, but at the price of
a high false alarm rate. When the test becomes more
selective, typically for thresholds under 0.85, partly
occulted objects are more difficultly detected. No-
tice that, for prohibitory signs, varying the eccentric-
ity threshold from 0.85 to 0.9 improves the true de-
tection rate faster than the false alarm rate. Moreover,
true detection rate almost reaches its maximum for a
threshold of 0.9. Hence we retain this value for the
rest of our experiments. Similarly, we chose the value
of 0.85 in the case of warning signs.
The ROC curves for S4 are easily distinguishable
from those corresponding to S1. The false alarm rate
is much higher in S4 than in S1. Possible explanations
are different cameras, colorization settings, compres-
sion rates and nature of scenes (S4 being more urban
than S1, for example). This shall be investigated in a
near future.
It may be noticed that for prohibitory signs, a
100% true positive rate (TPR
i
) is never reached.
Some non-detected traffic signs correspond to far-
away signs that may be detected when they appear
closer. When TPR
rs
is considered, the detection rate
reaches 94.4% for the S1 sequence (1 road sign is
never detected) and 83.3% for the S4 sequence (3 road
signs are missed). Non-detected signs correspond to
a severely worn-out sign (see Fig. 2(e)) and to signs
parallel to the axis of the road. In the case of warning
signs, non-detected objects in S1 correspond to old-
fashioned, non-standard, worn-out or temporary signs
and to one sign with yellow flashes (see Fig. 2(f)).
Note that all warning signs are detected in S4.
5.2 Influence of Symmetry
In this experiment, the symmetry threshold varies
over the range [0, 70]. The value 0 corresponds to
no symmetry selection. The resulting ROC curves
are plotted on fig. 4 and fig. 6. Examples of good
detection, including difficult scenes, are presented on
fig. 2(a)-(d). Selection based on symmetry has a no-
ticeable impact on the false alarm rate. This effect
is less obvious for warning signs than for prohibitory
signs due to a higher extent threshold. However, the
initial false positive rate was already weak for warn-
ing signs, thanks to a more selective geometrical cri-
terion, namely selection according to angles. Re-
call that the extent criterion is also more efficient for
warning signs than for prohibitory ones. This raises
the question of the utility of selection on symmetry,
which is rather costly in terms of computation time
for polygonal objects, since the number of false posi-
tive may already be low for certain sequences.
In general, selection on symmetry tends to discard
the first image of the series a road signs appears in,
but this has no impact in our application. For circular
signs, 3 worn-out “no parking” signs are lost in S1. In
France, these signs have a red ring and a blue interior.
The lack of contrast between the two colors explain
the non-detection. This might be overcome by using
other modalities than luminance. For warning signs,
selection on symmetry does not decrease the true pos-
itive rate TPR
rs
, except for a high threshold.
In conclusion, selection on symmetry allows
strongly decreasing the number of false positives for
radial objects. Its interest appears more clearly than
for polygonal road signs.
5.3 Validation
The above experiments have lead to the choice of 0.9
for the eccentricity and 40 (resp. 30) for the symmetry
threshold in the case of prohibitory (resp. warning)
signs. We also take α = 0.6, and the other parameters
are set as explained at the beginning of sec. 5. In this
validation experiment,we apply the detector with the
EVALUATION OF A ROAD SIGN PRE-DETECTION SYSTEM BY IMAGE ANALYSIS
365

same set of parameters to sequences S2, S3 and S5.
The results are gathered in tab. 3 for prohibitory road
signs and in tab. 4 for warning signs.
Table 3: Detection of prohibitory signs (PS).
Seq. TPR
i
TPR
rs
FPR Rate of selected images
S1 0.67 0.78 0.05 0.07
S4 0.77 0.83 0.175 0.23
S2 1 1 0.015 0.03
S3 0.84 0.9 0.08 0.12
S5 0.86 0.95 0.07 0.12
Table 4: Detection of warning signs (WS).
Seq. TPR
i
TPR
rs
FPR Rate of selected images
S1 0.77 0.84 0.02 0.05
S4 0.61 1 0.185 0.21
S2 0.88 1 0.01 0.03
S3 0.63 0.875 0.03 0.05
S5 0.67 0.95 0.07 0.11
The results on S2 are similar to those obtained on
S1, which was expected since both are part of a single
sequence. The results on S5 are even better than those
on S4. In fact, the same camera was used, but the ac-
quisition conditions were different and the itinerary is
less urban. Results on S3, i.e. with a different cam-
era, that was not involved in the parameter selection
process, are of the same quality, which is very satis-
factory. The true positive rate is lower then 90% on
S3 for warning signs, but this sequence contains more
damaged signs and compression artifacts than others.
6 CONCLUSIONS
In this paper we proposed a method for pre-selecting
images that potentially contain road signs in large im-
age databases. The method quickly filters objects ac-
cording to colour, shape, location and symmetry cri-
teria. We applied this algorithm on five large real-
world image sequences featuring damaged and badly
oriented traffic signs. In general, about 10% images
are selected, which fulfills the requirements of our ap-
plication, and would also be a good starting point for
more automatic detection and recognition algorithms
(Dutilleux and Charbonnier, 2007) that will hopefully
further reduce the false alarm rate. The true detection
rates (TPR
rs
) are quite good on this kind of difficult
image sequences: the missed objects always corre-
spond to dirty, worn out or badly oriented traffic signs
that sometimes would not be detected by human op-
erators either. We notice that the symmetry algorithm
(Barnes et al., 2008) directly applied on the whole im-
age may not detect the damaged traffic signs. More-
over, our complete algorithm takes 3500 sec. to pro-
cess the whole S1 sequence (3436 images) while the
symmetry method takes 1200 sec. for one image.
REFERENCES
Barnes, N., Zelinsky, A., and Fletcher, L. (2008). Real-time
speed sign detection using the radial symmetry detec-
tor. IEEE Transactions on Intelligent Transportation
Systems, 9(2):322–332.
de la Escalera, A., Armingol, J. M., and Mata, M. (2003).
Traffic sign recognition and analysis for intelligent ve-
hicles. Image and Vision Computing, 21(3):247–258.
Dutilleux, G. and Charbonnier, P. (2007). M
´
etaheuristiques
biologiques pour la d
´
etection de la signalisation
routi
`
ere. In Siarry, P., editor, Optimisation en traite-
ment du signal et de l’image, Trait
´
e IC2, s
´
erie traite-
ment du signal et de l’image, chapter 10, pages 271–
294. Hermes.
Loy, G. and Barnes, N. (2004). Fast shape-based road sign
detection for a driver assistance system. In IEEE/RSJ
International Conference on Intelligent Robots and
Systems (IROS’04), volume 1, pages 70–75, Sendai,
Japan.
Loy, G. and Zelinsky, A. (2003). Fast radial symmetry for
detecting points of interest. IEEE Transactions on Pat-
tern Analysis and Machine Intelligence, 25(8):959–
973.
Maldonado-Bascon, S., Lafuente-Arroyo, S., Gil-Jimenez,
P., Gomez-Moreno, H., and F.Lopez-Ferreras (2007).
Road-sign detection and recognition based on support
vector machines. IEEE Transactions on Intelligent
Transportation Systems, 8(2):264–278.
Piccioli, G., Micheli, E. D., Parodi, P., and Campani, M.
(1996). A robust method for road sign detection and
recognition. Image and Vision Computing Journal,
14:209–223.
Priese, L., Rehrmann, V., Schian, R., and Lakmann, R.
(1993). Traffic sign recognition based on color image
evaluation. In IEEE Intelligent Vehicles Symposium,
pages 95–100, Tokyo, Japan.
Shaposhnikov, D., Lubov, N., Podladchikova, L., Golovan,
A., Shevtsova, N., Hong, K., and Gao, X. (2002).
Road sign recognition by single positioning of space-
variant sensor window. In 15th International Con-
ference on Vision Interface, pages 213–217, Calgary,
Canada.
VISAPP 2009 - International Conference on Computer Vision Theory and Applications
366
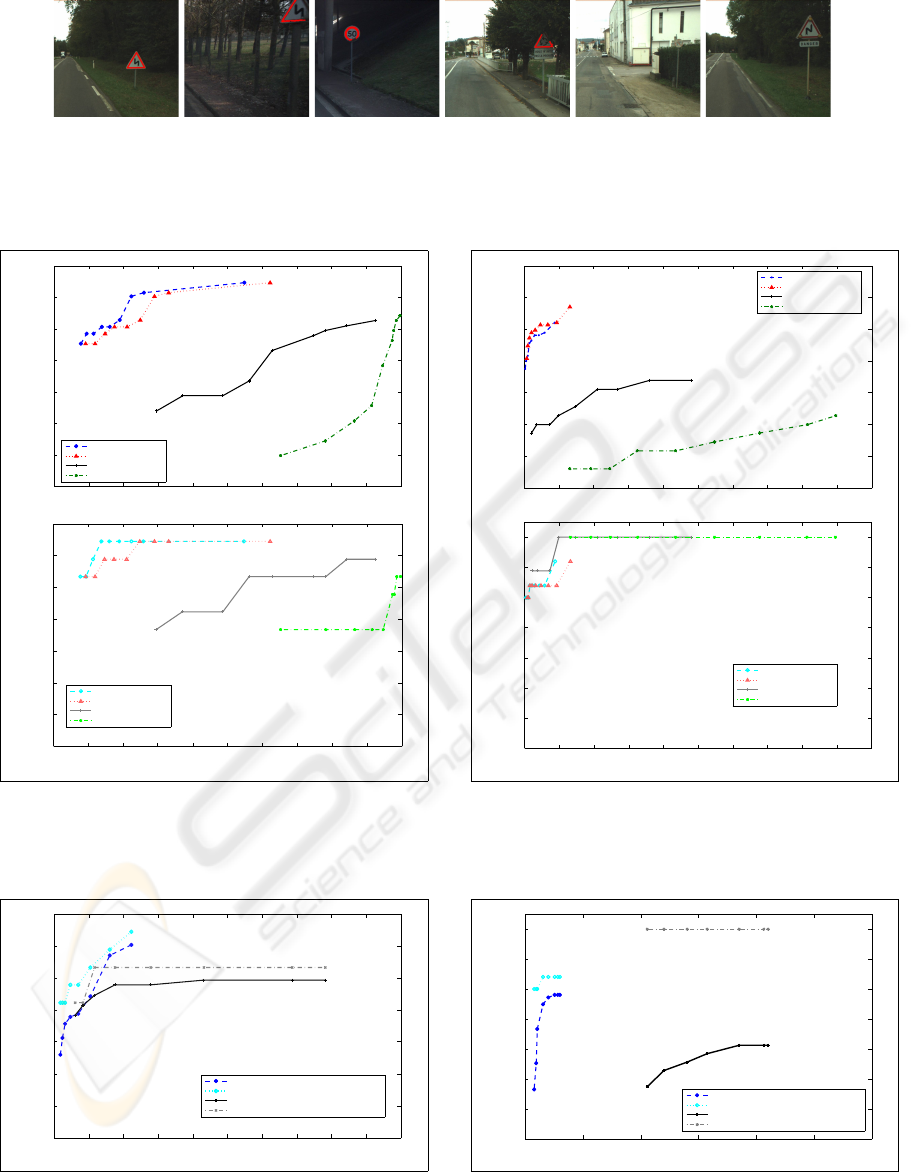
(a) (b) (c) (d) (e) (f)
Figure 2: Detection of traffic signs : (a) simple case; (b)old WS ; (c) dirty sign border; (d) occulted WS; (e) severely worn-out
PS ; (f) non detected WS with flashes. Detected objects appear in red, superimposed on the original image.
0 0.1 0.2 0.3 0.4 0.5 0.6 0.7 0.8 0.9 1
0.3
0.4
0.5
0.6
0.7
0.8
0.9
1
False Positive Rate
True Positive Rate
0.6
0.65
0.9
0.95
1
0.6
0.65
0.75
0.8
0.85
0.9
0.95
1
0.6
0.65
0.7
0.75
0.8
0.85
0.9
0.95
1
0.6
0.65
0.7
0.75
0.8
0.85
0.9
1
S1 sequence, color 0.6
S1 sequence, color 0.55
S4 sequence, color 0.6
S4 sequence, color 0.55
0 0.1 0.2 0.3 0.4 0.5 0.6 0.7 0.8 0.9 1
0.3
0.4
0.5
0.6
0.7
0.8
0.9
1
False Positive Rate
True Positive Rate
0.6
0.6
0.7
0.75
1
0.65
0.7
0.8
0.9
0.95
1
0.6
0.65
0.7
0.75
0.8 0.9
1
0.6
0.65 0.7
0.8
0.85
0.95
S1 sequence, color 0.6
S1 sequence, color 0.55
S4 sequence, color 0.6
S4 sequence, color 0.55
Figure 3: Influence of color and eccentricity parameters on
the detection of PS, using TPR
i
(top) and TPR
rs
(bottom);
the eccentricity threshold varies over [0.6,1].
0 0.1 0.2 0.3 0.4 0.5 0.6 0.7 0.8 0.9 1
0.3
0.4
0.5
0.6
0.7
0.8
0.9
1
False Positive Rate
True Positive Rate
0
30
50
60
70
0
20
40
010
20
3040
010
20
3040
70
S1 sequence (TPR)i , color 0.6 , eccentricity 0.9
S1 sequence (TPR)rs, color 0.6 , eccentricity 0.9
S4 sequence (TPR)i , color 0.6 , eccentricity 0.9
S4 sequence (TPR)rs , color 0.6 , eccentricity 0.9
Figure 4: Influence of symmetry on the detection of PS; the
symmetry threshold varies over [0,70].
0 0.1 0.2 0.3 0.4 0.5 0.6 0.7 0.8 0.9 1
0.3
0.4
0.5
0.6
0.7
0.8
0.9
1
False Positive Rate
True Positive Rate
0.6
0.95
1
1
0.6
0.65
0.75
0.8
0.85 0.9
0.95
1
0.6 0.7
0.8
0.85
0.9
0.95
1
S1 sequence, color 0.6
S1 sequence, color 0.55
S4 sequence, color 0.6
S4 sequence, color 0.55
0.85
0 0.1 0.2 0.3 0.4 0.5 0.6 0.7 0.8 0.9 1
0.3
0.4
0.5
0.6
0.7
0.8
0.9
1
False Positive Rate
True Positive Rate
0.6
1
0.95
1
0.6
0.75
1
0.6 0.85
0.75
1
S1 sequence, color 0.6
S1 sequence, color 0.55
S4 sequence, color 0.6
S4 sequence, color 0.55
Figure 5: Influence of color and eccentricity parameters on
the detection of WS, using TPR
i
(top) and TPR
rs
(bottom);
the eccentricity threshold varies over [0.6,1].
0 0.05 0.1 0.15 0.2 0.25 0.3
0.3
0.4
0.5
0.6
0.7
0.8
0.9
1
False Positive Rate
True Positive Rate
0
30
40
50
60
70
0
40
50
70
0
20
30
40
50
60
70
0
30
40
50
60
70
20
S1 sequence (TPR)i, color 0.6, eccentricity 0.85
S1 sequence (TPR)rs, color 0.6, eccentricity 0.85
S4 sequence (TPR)i, color 0.6, eccentricity 0.85
S4 sequence (TPR)rs, color 0.6, eccentricity 0.85
Figure 6: Influence of symmetry on the detection of WS; the
symmetry threshold varies over [0,70]. Notice the reduced
abscissa range.
EVALUATION OF A ROAD SIGN PRE-DETECTION SYSTEM BY IMAGE ANALYSIS
367
