COREST: A MEASURE OF COLOR AND SPACE STABILITY TO
DETECT SALIENT REGIONS ACCORDING TO HUMAN CRITERIA
Agn´es Borr`as and Josep Llad´os
Computer Vision Center, Dept. Ci`encies de la Comunicaci´o, Spain
Keywords:
Region of interest, Region detector, Color stability, Space scale.
Abstract:
In this paper we present a novel method to obtain regions of interest in color images. The strategy consists
in the evaluation of the stability of a region according to its properties of color and spatial arrangement. We
propose a fusion of the classical color image segmentation with the space scale analysis. An image can be
decomposed in a set of regions that describe the whole image content. Using a set of manual labelled images
we have evaluated the properties of the detector according to the human perception. The proposed region
detector has a potential application in the field of the content based image retrieval by sketch.
1 INTRODUCTION
Many Computer Vision applications use region detec-
tion procedures as a first step to extract relevant infor-
mation from images. Sometimes this relevant infor-
mation needs to fit the human perception of the image
content. This constraint is usually required in the con-
tent based image retrieval field (CBIR). Several com-
mercial systems incorporate drawing interfaces to al-
low users to create their own queries (Veltkamp and
Tanase, 2000). Sketch based search engines are very
attractive because overcome language limitations and
allow to adapt the queries to the user needs. But, can
these queries fit the preprocessed information of the
database images?
CBIR systems use to rely on a previous segmen-
tation of the images. The goal of segmentation is
to group together similar pixels in order to separate
them into regions. Nevertheless, some experiments
like the Berkeley segmentation data set demonstrate
that does not exists a unique way in which humans se-
lect the relevant information of an image. The Berke-
ley database collects the hand labelled segmentations
from several human subjects (Martin et al., 2001).
In the Figure 1 we show an example where we can
observe that different users describe the same image
with a very different set of regions. This high vari-
ability suggests that CBIR systems could benefit of
region detectors that go beyond the classical segmen-
tation algorithms. Classical segmentation procedures
provide a unique and disjoint decomposition of the
image into a set of regions (Cheng et al., 2001). How-
ever, the set of regions that humans perceive as mean-
ingful can be even overlapped or self-contained.
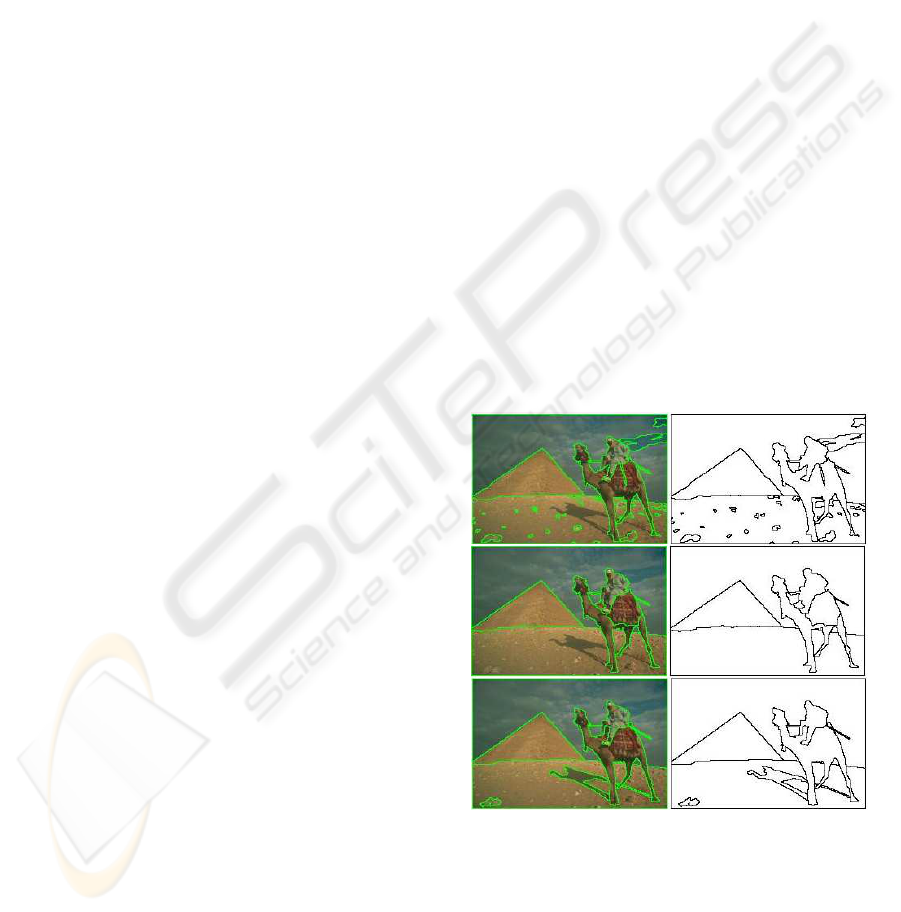
Figure 1: Examples of the Berkeley data set. Manual seg-
mentations provided by different users on the same image.
In the last years some works to detect regions
of interest have incorporated the multiscale analysis
of the image content. Lindeberg observed that hu-
mans identify real-world objects depending on the
scale of observation (Lindeberg, 1993). He illustrates
this phenomena with the example of the a tree: at
204
Borràs A. and Lladós J. (2009).
COREST: A MEASURE OF COLOR AND SPACE STABILITY TO DETECT SALIENT REGIONS ACCORDING TO HUMAN CRITERIA.
In Proceedings of the Fourth International Conference on Computer Vision Theory and Applications, pages 204-209
DOI: 10.5220/0001802502040209
Copyright
c
SciTePress

close scales human identify the leaves as objects but
the concept of the forest only has sense from large
distances. The main idea of the multiscale analysis
consists in selection local image structures at specific
scales. The specific scales are those for which a given
function attains an extremum. Techniques such as
the Lapliacian of Gaussian (LoG) or the determinant
of Hessian (DoH) have obtained excellent results in
matching applications where two images contain in-
stances of the same real object (Mikolajczyk et al.,
2005).
In this paper we propose a system to detect re-
gions of interest according to the human perception.
The main strategy of our proposal is to mix the classi-
cal color segmentation with the scale space analysis.
On the one hand we make a region detection from the
homogeneity properties of the color pixels. On the
other hand we propose a perceptual grouping of the
pixels being or not connected according to their spa-
tial arrangement.
The paper organization is as follows. In the sec-
tion 2 we explain the main idea and the implementa-
tion of our proposal. Then, in section 3, we present
some results involving a set of human based synthetic
images. Finally, the section 4 exposes the conclusions
and future work.
2 THE COLOR REGION
STABILITY (CoReSt)
We have developed a region detector inspired in the
work of Matas that defines the concept of maximally
stable extremal regions (MSER) (Matas et al., 2002).
Matas informally explained this concept as follows.
Imagine all possible thresholdings of a gray-level im-
age. Then, we can see the thresholded images as a
movie where we start with the lowest threshold and
we gradually increase it. Thus, the first image is
white and subsequently black spots begin to appear
and grow. This spots correspond to local intensity
minima, so they continue merging until reaching a
whole black image in the last movie frame. To evalu-
ate this evolution, a stability function between regions
of consecutive frames is defined. This function con-
sists in the rate of change of the region areas. This
way, threshold levels that are local minima of this rate
change are selected to produce the maximally stable
extremal regions. The MSER has been exported to
color images by Forss´en (Forss´en, 2007) applying the
same idea of stability by looking at successive time-
steps of an agglomerative clustering of image pixels.
Following the movie example, imagine that we have
a color image instead of a grayscale one. Then, we
have a threshold related to the color distance of two
pixels. We begin with an image where every pixel is
an independent region. As we increase the threshold
the connected pixels which distance is lower than this
value begin to fuse. Finally, all the pixels form a sin-
gle region in the last frame. This way, the more distant
the color of a region is respect from the color of the
surrounding pixels, the more the stable the region is.
The color analysis takes into account the struc-
tures formed by connected pixels but does not ana-
lyze the emerging structures according to the scale of
observation. Going back to the human perception, it
seems a natural process to group similar color regions
if they are close enough. The space scale analysis
is the tool that allows to perform this kind of region
association. The process takes an important role to
identify objects in real images when they suffer from
partial occlusions or they present a textured patterns.
This way, we propose to export the stability measure
to the spatial arrangement of the pixels. To illustrate
the spatial stability, imagine that we have an image
with a set of segmented regions. Then we also have a
threshold related to the spatial distance of the region
centroids. Our movie starts with this set of regions
being independent and, as we increase the threshold,
the regions are progressively joined. In the last frame
they are all joined in a single one. Then, the more
isolated a region is, the more stable the region is.
Finally, we quantify the saliency of a region mix-
ing the stability measures of color and space. In the
next section we present a region detector based in this
measure that we have called CoReSt (Color Region
Stability).
2.1 The Region Detector
Implementation
From an implementation viewpoint we propose to de-
tect regions of interest using the mean shift algorithm
(Comaniciu and Meer, 1999). A pixel in understood
like a point in a 5D space where its first three dimen-
sions are related to the color values in the Luv space
the other two represent the (x,y) coordinates of the
normalized image size. We use an implementation of
the mean shift clustering that depends on two thresh-
olds, hc and hs, that control respectively the similarity
constraints on the color and the space (Christoudias
et al., 2002). We analyze the segmentation stabil-
ity according to the variation of these two thresholds.
To illustrate the process we can construct a bidimen-
sional grid filled up with the clustered images (see
Figure 2). Let us name MSS the mean shift function
and HC and HS the two sets of thresholds we evaluate
related to the color and space respectively. Further-
COREST: A MEASURE OF COLOR AND SPACE STABILITY TO DETECT SALIENT REGIONS ACCORDING TO
HUMAN CRITERIA
205
more, we define NC and NS the amount of parameters
that each set contains.
HC(x) = {hc} x = 1..NC
HS(y) = {hs} y = 1..NS
Then, the grid that contains the segmented regions
is denoted G and has dimension [NSxNC].
G
(x,y)
= MSS(I, HC(x),HS(y))
For every region of image in the grid, we can
find the analogous regions along the two dimensions.
Using the movie example, the analogous regions are
those that maximize the overlapping area when we in-
crement and decrement the HC and HS thresholds.
Let us define the OAR the function that computes the
rate of overlapping area between two regions.
OAR(R
1
,R
2
) =
Area(R
1
∩ R
2
)
max(Area(R
1
),Area(R
2
))
We denote R
(x,y)
i
the i region of the grid cell (x,y)
and AR
(x,y)
′
(x,y)
i
its analogous region of another cell (x,y)
′
.
AR
(x,y)
′
(x,y)
i
= R
(x,y)
′
j
| max OAR(R
(x,y)
i
,R
(x,y)
′
k
)
∀k = 1..#R
(x,y)
′
Once we have the segmentation evolution along
the color and the space dimensions, we need a func-
tion to evaluate the stability of the regions. Matas
(Matas et al., 2002) used the relative area between
the regions, but notice that we also work in the space
domain considering strong changes when the regions
from disconnected components. This way, we add
the values of the second central moments to provide a
more robust measure of stability. These moments can
be understood as the lengths of the axis of the ellipse
that encloses a region. The similarity rate between
two length values L
1
and L
2
is computed using the
function LR.
LR(L
1
,L
2
) = min(L
1
,L
2
)/max(L
1
,L
2
)
We name mAL and MAL to the lengths of the mi-
nor axis and major axis of a ellipse. Given two regions
R
1
and R
2
we define the ratio of the axis lengths as:
ALR(R
1
,R
2
) = max(LR(mAL
1
,mAL
2
),
LR(MAL
1
,MAL
2
))
Then, given a region R
(x,y)
i
and another analogous
one AR
(x,y)
′
(x,y)
i
we compute the stability S as the mean of
the area rate and the axis rate.
S(R
(x,y)
i
,AR
(x,y)
′
(x,y)
i
) = OAR(R
(x,y)
i
,AR
(x,y)
′
(x,y)
i
) ∗ 0.5+
ALR(R
(x,y)
i
,AR
(x,y)
′
(x,y)
i
) ∗ 0.5
Treating separately the analogous regions of the
two dimensions, we name SC to the function that mea-
sures the stability along the color, and SS its equiva-
lent in the space.
SC(R
(x,y)
i
) =
NC
∑
X=1
S(R
(x,y)
i
,AR
(X,y)
(x,y)
i
)
NC
SS(R
(x,y)
i
) =
NS
∑
Y=1
S(R
(x,y)
i
,AR
(x,Y)
(x,y)
i
)
NS
At this point we have two measures of stability in
the range [0,1] for all the regions of the images in the
grid. Next we select those that describe best an image.
2.1.1 Maximum Selection Response
Among the whole set of segmented regions we select
those that present a maximum response of the stability
measure. Let us name PC and PS the functions that
evaluates the presence of a peak in the response of the
functions SC and SS. These regions are called ROIS.
ROI
(x,y)
i
= R
(x,y)
i
| PC(R
(x,y)
i
) or PS(R
(x,y)
i
)
PC(R
(x,y)
i
) = SC(AR
(x−1,y)
i
(x,y)
i
) ≤ ...
SC(R
(x,y)
i
) > SC(AR
(x+1,y)
i
(x,y)
i
)
PS(R
(x,y)
i
) = SS(AR
(x,y−1)
i
(x,y)
i
) ≤ ...
SS(R
(x,y)
i
) > SS(AR
(x,y+1)
i
(x,y)
i
)
A global measure of saliency GS can also be com-
puted for each each selected ROI.
GS(ROI
(x,y)
i
) =
SS(ROI
(x,y)
i
) + SC(ROI
(x,y)
i
)
2
This value combines the stability of color and
space allowing to rank the regions by its meaningful-
ness. This can be useful to weight the matching of the
ROIS in a retrieval process.
VISAPP 2009 - International Conference on Computer Vision Theory and Applications
206
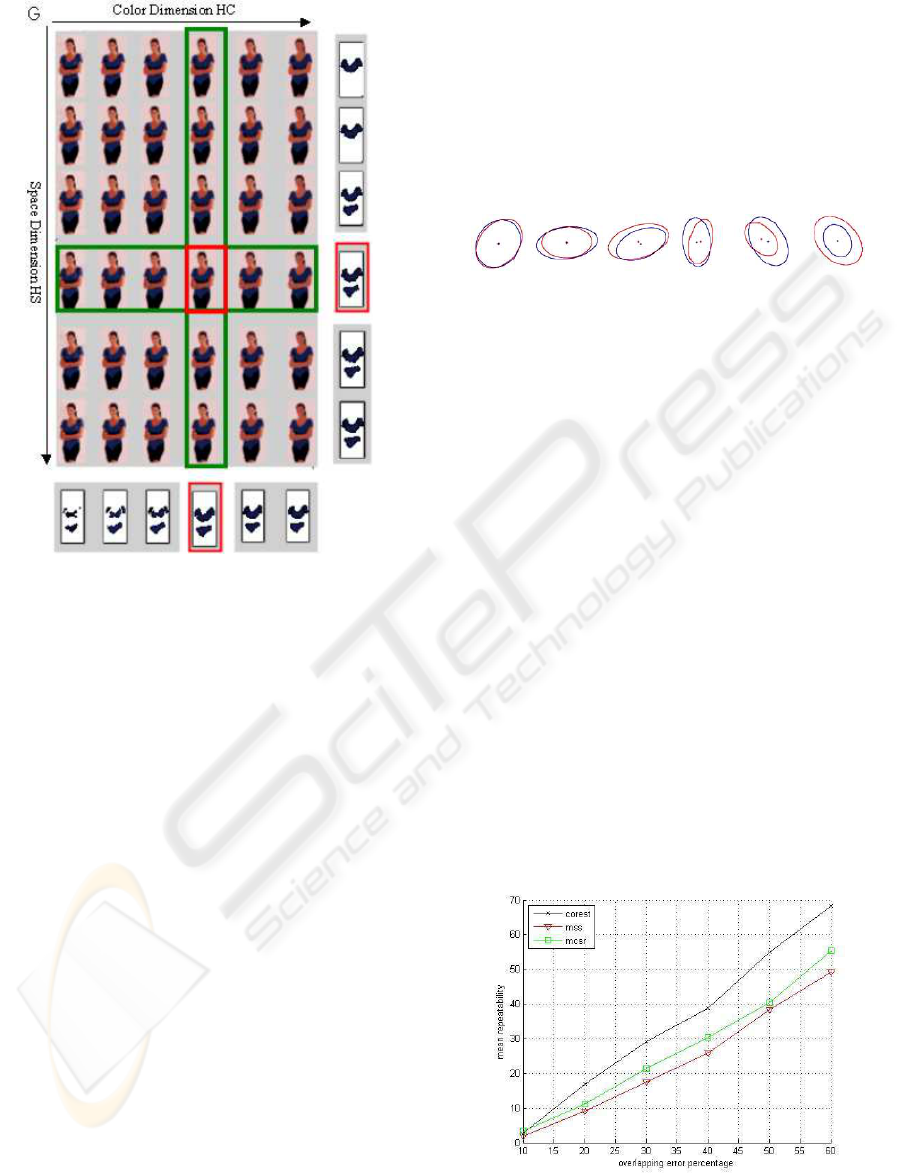
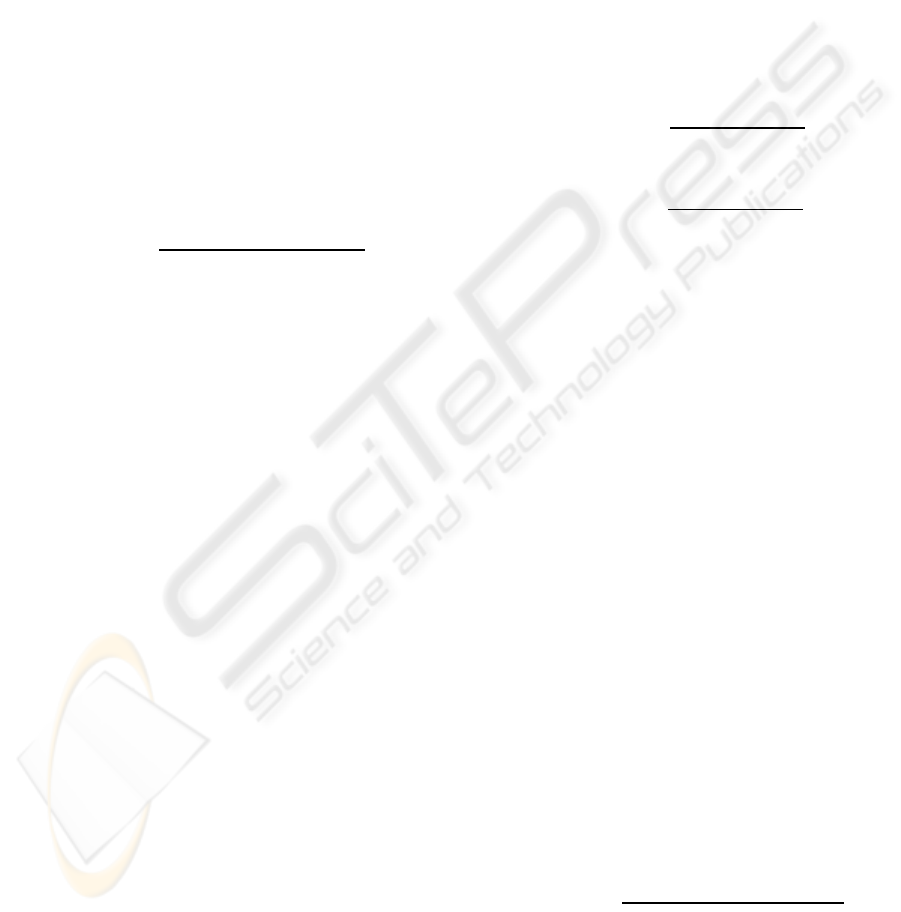
Figure 2: Grid of segmented images using the MSS ac-
cording to the parameters of color HC and space HS. We
show an example of a region and their analogous regions.
From them we compute its stability measure. Observe how
it grows trough the scale, fusing with regions of the same
color, and how it grows trough color fusing with similar
colored pixels.
3 EXPERIMENTS AND RESULTS
We have made a set of experiments to study the per-
formance of the stability measure according to the hu-
man perception. As a ground truth of our test, we
have used 100 images of the Berkeley database with
their corresponding manually labelled regions (Mar-
tin et al., 2001). We have compared the performance
of the proposed region detector (COREST) with its
two most related algorithms: the Mean Shift Segmen-
tation (MSS) and the Maximal Color Stable Regions
(MCSR).
There exists many strategies to quantify the agree-
ment of a segmented region with a ground truth refer-
ence (Unnikrishnan et al., 2007). Nevertheless, these
strategies do not match our region detector output
since one pixel of an image can be assigned to more
than one region of interest. This way, to provide
a numerical evaluation we have used the repeatabil-
ity measure proposed by Mikolajczyk (Mikolajczyk
et al., 2005). The repeatability computes the percent-
age of manual regions that can be matched with any
of the regions that the automatic detector provides.
To simplify the matching step we have approximated
the regions with ellipses according to their moments.
Then, two regions are considered to match if its over-
lapping area is greater than a given percentage. To il-
lustrate the overlapping rate we show some examples
on the Figure 3 extracted from (Mikolajczyk et al.,
2005).
Figure 3: Examples of the overlapping error rate between
two ellipses. From top left to bottom right: 10 to 60%.
We have tested the repeatability of the three de-
tectors (COREST, MSS and MCSR) with the over-
lapping error threshold varying from 10 to 60%. The
graph of the Figure 4 presents the mean of the re-
peatability for the whole set of test images. We have
tested the algorithms with the default parameters of
the available source code (Christoudias et al., 2002)
(Forss´en, 2007). Thus, every detector can provide a
different amount of ROIS in the same image. The
mean number of manual segmented regions per im-
age is 26 and the mean number of ROIS per image
detected with the COREST, MSS and MCSR are of
275, 388 and 990 respectively. We observe that the
repeatability of the test with the COREST method is
higher than the other two through all the overlapping
thresholds. We can deduce that even though it de-
tects a lower amount of regions per image, the stabil-
ity criteria allows to match a higher percentage of the
ground truth regions. This way, relaxing the overlap-
ping parameter to a 60% it reaches a repeatability of
68.6%, despite the complexity of the natural scenes
and the subjectivity of the human based ground truth.
Figure 4: Mean repeatability for the test set.
The Figure 5 presents the COREST detector re-
COREST: A MEASURE OF COLOR AND SPACE STABILITY TO DETECT SALIENT REGIONS ACCORDING TO
HUMAN CRITERIA
207

sults with some examples. For every example we
show the ROIS of the real images that fit best the man-
ual ones. In other words, we show the detected ROIs
that maximize the overlapping area of the ground
truth regions.
The COREST detector has selected the image re-
gions according to the stability measures in the color
and in the space features. Then, the contrasted re-
gions and and isolated regions are detected as mean-
ingful according to the human perception. As we have
introduced in the section 2 the analysis of the space
properties plays an important role in identifying ob-
jects in real images. Then, it makes possible to group
a set of disjoint regions that belong to an object that is
partially occluded. This phenomena can be illustrated
with the image a) of the Figure 5. Thus, if we look
at the palm picture we realize that the sand area is oc-
cluded by a shadow that the user has omitted. Being
the shadow so contrasted with the color of the sand, a
classical segmentation could never join the two parts.
The same occurs in the detection of the background
region in the fireman scene f). The region belonging
to the wall is occluded by a picture and it is broken
into a set of parts. The space scale analysis has also
effect in the presence of textures. Then, the system
is able to group similar color regions. Natural scenes
have plenty of textures such as trees a), clouds h),
waves e), or the leopard skin d). Moreover, images
that contain man made objects can also present repet-
itive patterns that a human perceive as belonging to
the same object. This is the case of the white and red
striped bars of the figure c) or clothing garments of
the image b).
4 CONCLUSIONS
We have presented a novel region detector on color
images that combines a classical color segmentation
approach with a space scale analysis. We have used
the mean shift algorithm to measure the stability of
the regions on the color and the space domains. The
detector gives a very high degree of freedom about
the shape of the output regions making it suitable to
describe any image content. Moreover, the multiscale
approach allows the system to detect ROIS composed
by disjoint regions that can come from partial over-
lapped elements or textured areas. We have made
some experiments to evaluate the regions of interest of
manual labelled image vs. the regions of interest of a
real scene. Using a human based benchmark we have
demonstrated that exist enough correlation to use this
region detector in applications where the information
has to be matched according to the human represen-
tation. One of the potentially applications could be
found int the content based retrieval systems that al-
low sketch based queries. dfafd
ACKNOWLEDGEMENTS
This work has been partially supported by the project
TIC2003-09291 and the grant 2002FI-00724.
REFERENCES
Cheng, H.-D., Jiang, X.-H., Sun, Y., and Wang, J. (2001).
Color image segmentation: advances and prospects.
Pattern Recognition, 12(34):2259–2281.
Christoudias, C., Georgescu, B., and Meer, P. (2002). Syn-
ergism in low level vision. pages IV: 150–155.
Comaniciu, D. and Meer, P. (1999). Mean Shift Analysis
and Applications. In Proceedings of the IEEE ICCV,
pages 1197–1203, Kerkyra, Greece.
Forss´en, P.-E. (2007). Maximally stable colour regions for
recognition and matching. In IEEE Conference on
Computer Vision and Pattern Recognition, Minneapo-
lis, USA. IEEE Computer Society, IEEE.
Lindeberg, T. (1993). Scale-Space Theory in Computer
Vision (The International Series in Engineering and
Computer Science). Springer.
Martin, D., Fowlkes, C., Tal, D., and Malik, J. (2001).
A database of human segmented natural images and
its application to evaluating segmentation algorithms
and measuring ecological statistics. Technical report,
EECS Department, University of California, Berkeley.
Matas, J., Chum, O., Martin, U., and Pajdla, T. (2002). Ro-
bust wide baseline stereo from maximally stable ex-
tremal regions. In Proceedings of the BMVC, vol-
ume 1, pages 384–393, London.
Mikolajczyk, K., Tuytelaars, T., Schmid, C., Zisserman,
A., Matas, J., Schaffalitzky, F., Kadir, T., and Gool,
L. V. (2005). A comparison of affine region detectors.
IJCV, 65(1/2):43–72.
Unnikrishnan, R., Pantofaru, C., and Hebert, M. (2007). To-
ward objective evaluation of image segmentation al-
gorithms. 29(6):929–944.
Veltkamp, R. and Tanase, M. (2000). Content-based image
retrieval systems: A survey. Technical Report UU-CS-
2000-34, Department of Information and Computing
Sciences, Utrecht University.
VISAPP 2009 - International Conference on Computer Vision Theory and Applications
208

a) b)
c) d) e)
f) g) h)
Figure 5: Some examples of the Berkeley data set. We show the ROIS of the manual segmentations and the ROIS of the real
images that maximize their overlapping rate. We highlight the obtained ROIS with the ellipses that approximate their area.
COREST: A MEASURE OF COLOR AND SPACE STABILITY TO DETECT SALIENT REGIONS ACCORDING TO
HUMAN CRITERIA
209
