3D SHAPE RECONSTRUCTION ENDOSCOPE USING SHAPE
FROM FOCUS
T. Takeshita
1
, Y. Nakajima
1, 2
, M. K. Kim
1
, S. Onogi
2
, M. Mitsuishi
1
and Y. Matsumoto
1, 2
1
School of Engineering, the University of Tokyo, Tokyo, Japan
2
Intelligent Modeling Laboratory, the University of Tokyo, Japan
Keywords: Three-dimensional Endoscope, Three-dimensional Reconstruction, Shape from Focus.
Abstract: In this paper, we propose three-dimensional (3-D) shape reconstruction endoscope using shape from
focus/defocus (SFF/SFD). 3-D shape measurement that uses the endoscope image sequence can measure
both the shape and the texture at the same time. It has some advantages such as the analysis of lesion
location that integrates the analysis of shape and texture. And the shape and the texture from the endoscope
can be recorded quantitatively. To obtain 3-D information, shape measurement methods using stereo
cameras is often used. But in case of narrow space, 3-D reconstruction using focus information such as
SFF/SFD is more appropriate in terms of apparatus size. Therefore, we apply SFF method to endoscope for
shape reconstruction, and conducted two basic experiments to confirm the possibility of the system using
general camera as a first step. First, to estimate the accuracy of shape measurement of the system, shape
measurement of the objects that the shape is already-known was conducted. And the error of the system was
calculated about 1 to 5 mm. Next, to confirm the possibility to measure biological inner wall, the
measurement of inner wall of the pig stomach was conducted, and the shape was reconstructed.
1 INTRODUCTION
Endoscope is medical equipment to examine or to
treat the inner part of body where the direct
observation cannot be done from the outside. In
general, obtained information from an endoscope is
two-dimensional (2-D) information. One of the
drawbacks of present endoscopy is lack of depth
information. However, the depth information is
indispensible to accurate endoscopic diagnosis. The
aim of this paper is 3-D recovery of inner shape of
organ from endoscopic image sequence. Therefore,
quantitative shape and the texture on the surface of
inner part of organ can be measured at the same time
during operation. The 3-D shape reconstruction
endoscope offers various advantages from the
feature. To begin with, the analysis of lesion
location based on the analysis of shape and texture
becomes possible. Recently, several researchers
have been proposed automatic polyp detection.
These are mainly classified into two approaches.
First one uses shape information by computed
tomography (CT) (Vining DJ et al., 1994) and the
other uses texture information by endoscope image.
(D. K. Iakovidis et al., 2005)
Figure 1: Formation of focused and defocused images.
For the 3-D measure endoscope can measure the
shape and the texture at once, it could be possible to
analyze polyps more accurately. Second, it becomes
easier to integrate with preoperative 3-D data from
CT. Next, viewpoint can be changed virtually with
3-D surface. So with the 3-D reconstruction
endoscope, the operation can be performed more
safely. Moreover, the inner shape of organ
information can be recorded by this endoscope.
Several researchers have applied computer vision
techniques to recover 3-D information from
endoscope image sequence. 3-D shape recovery
411
Takeshita T., Nakajima Y., Kim M., Onogi S., Mitsuishi M. and Matsumoto Y. (2009).
3D SHAPE RECONSTRUCTION ENDOSCOPE USING SHAPE FROM FOCUS.
In Proceedings of the Fourth International Conference on Computer Vision Theory and Applications, pages 411-416
DOI: 10.5220/0001804004110416
Copyright
c
SciTePress
methods by stereo camera measurement (D.
Stoyanov et al., 2005), laser scanning (M. Hayashibe
et al., 2006), shape from shading methods (T.
Okatani et al., 1997), illumination model (P.
Sánchez-González et al., 2008) and shape from
motion methods (K. Deguchi et al., 1996) (T.
Nagakura et al., 2007) have been presented for
clinical applications of endoscope. Stereo camera
measurement and laser scanning have drawback for
endoscopic operations in terms of the size of
endoscope because it needs two or more optical
system or additional laser devices. Shape from
shading makes use of the Lambertian reflectance
model that brightness is constant regardless of the
observed angle. But it is difficult to satisfy the
constraint in many cases of real organ surface. Shape
from motion solves for 3-D shape by using the
relative motion of objects from the camera. However,
for achieving 3-D measurement, it requires the
perturbational camera motion for image acquisition
of different positions.
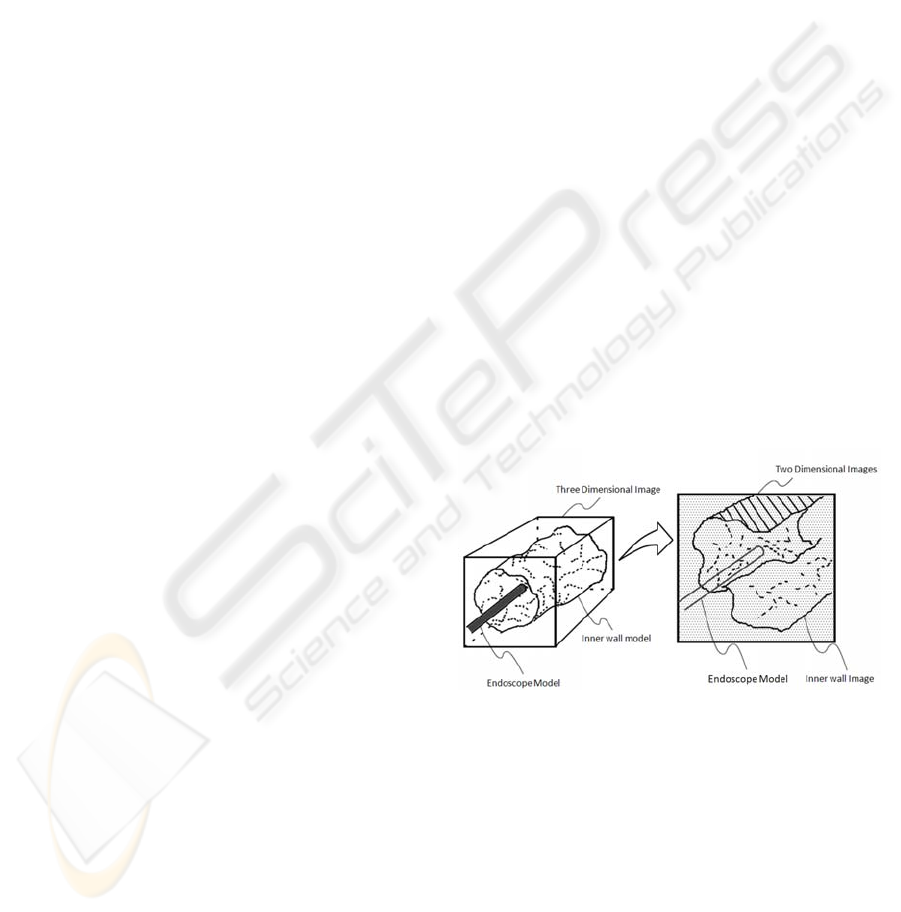
We propose a configuration for 3-D shape
recovery of endoscopic images based on shape from
focus (SFF). Figure 1 is a schematic diagram of
concept of our method. In SFF method, shape is
obtained with the use of the image sequence
partially in-focus taken by changing the focused
position. The analysis of focus to estimate depth
from the camera to object has been used for the
automatically focusing camera system. The auto
focus method from focus information using the
Fourier transform is proposed by Horn(B. K. P.
Horn, 1968). Several methods concerning the
analysis of focus criterion are compared by
Krotkov(E. P. Krotkov, 1987). And the method of
recovering shape from focus has been presented by
Nayar(S. K. Nayar et al., 1994) and Subbarao(M.
Subbarao et al., 1994).
Although SFF is not available for many cases, it
is appropriate for endoscopic inspection and therapy
because of several reasons. Considering invasion
and pain of patients, endoscopes need to be narrow.
SFF is a method for extracting 3-D shape for single
camera and can make its hardware configuration
compact. Unlike the stereo method, SFF needs
neither matching problem nor occlusion, so the
application to a wide-angle lens suitable for an
endoscope is easy. Another account is that lighting
condition is easily controlled inside of organ rather
than outside world. It is an advantage to fulfill strict
conditions for SFF.
2 METHOD
2.1 Shape from Focus
SFF is a method of measuring shape by using focus
information. The focused position depends on the
camera parameters such as lens position or image
sensor.
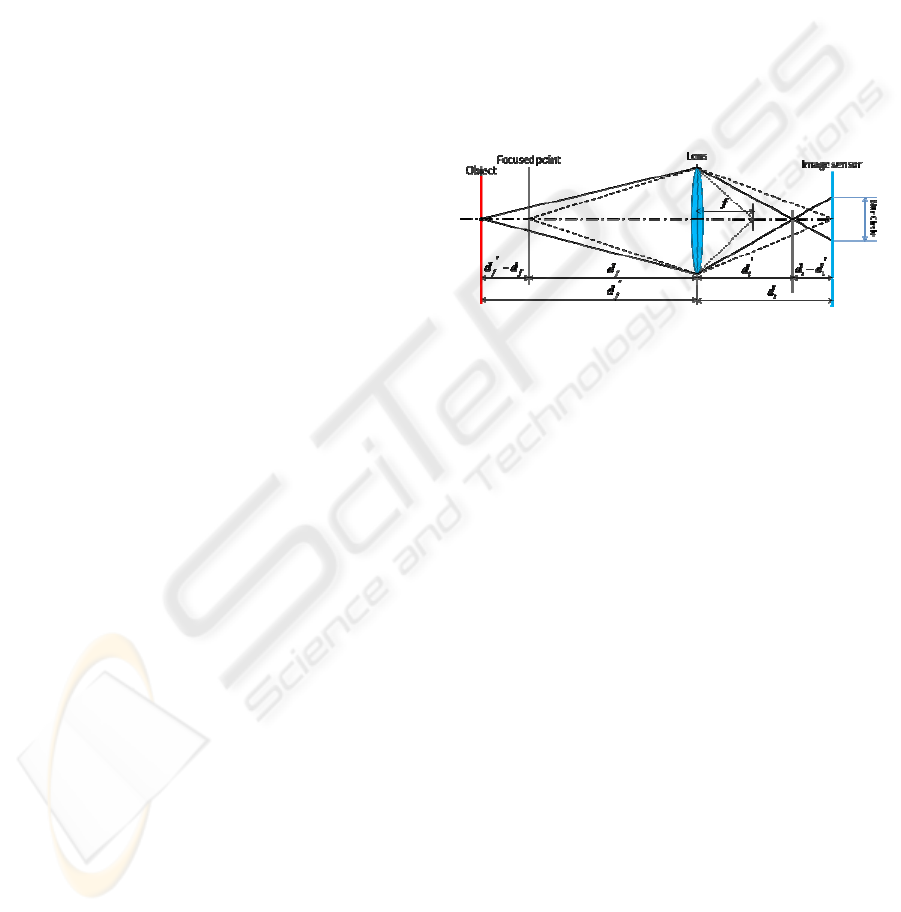
The geometry of the defocusing and focusing can be
expressed by Figure 2. In this Figure, di is the
distance between the lens and sensor plane, df is the
distance between the lens and the focal plane when
the focus is perfectly focused. In case of df’>df or
df’<df, namely, if object is not placed on Focused
point, blur circle is formed. SFF method is an
application of this principle.
Figure 2: Formation of focused and defocused images.
The steps of SFF process are following. First, two or
more pictures are taken by changing the image
sensor position, the lens position or the object
position. In this paper, lens position is varied for
image sequence. Second, the focus measures of each
pixel in the each image are compared, and the
camera parameters are estimated by which the
photographed object is perfectly focused. Finally,
we can obtain the depth of each point from the
camera parameters.
2.2 Computation of Focus Measure
In SFF, it is important to evaluate the degree of
focus measure, and have proposed various methods.
In this paper, we use to evaluate focus measure
using High-Pass Filter (HPF) is introduced by
Krotkov (E. P. Krotkov, 1987) and Nayar (S. K.
Nayar et al., 1994). The blur image is represented
image intensity function i(x, y). i(x, y) is expressed
by the convolution of Point Spread Function(PSF)
h(x, y) and perfectly focused image i
f
(x, y).
),(),(),( yx
f
iyxhyxi ∗=
(1)
In equation (1), the symbol “
∗
” denotes convolution.
By considering the defocusing process in the
frequency domain, we obtain the following equation.
VISAPP 2009 - International Conference on Computer Vision Theory and Applications
412
),(),(),( vu
f
IvuHvuI ⋅=
(2)
Where I(u, v), H(u, v) and I
f
(u, v) is the Fourier
transforms of i(x, y), h(x, y), and i
f
(x, y). 2-D
Gaussian function is used for an approximation of
the PSF (A. Pentland, 1987), (S. K. Nayar et al.
1994). By approximating h(x, y) with 2-D Gaussian
function.
⎟
⎟
⎠
⎞
⎜
⎜
⎝
⎛
+
−=
2
2
22
exp
2
2
1
),(
σπσ
yx
yxh
(3)
The Fourier Transform of PSF is called Optical
Transfer Function (OTF) of camera system and is
given as
⎟
⎟
⎠
⎞
⎜
⎜
⎝
⎛
+
−=
2
2
22
exp),(
σ
vu
vuH
(4)
Consequently, from equation (4) and (5), I(u, v) can
be expressed as
).,(
2
2
22
exp),( vu
f
I
vu
vuI ⋅
+
−=
⎟
⎟
⎠
⎞
⎜
⎜
⎝
⎛
σ
(5)
At the same time,
σ
(spread parameter) is thought
to be proportional to the defocusing radius in the
PSF. Therefore, the more images become defocused,
the more the power spectrum of high frequency gets
attenuated. And if the frequency is higher, the
degree of attenuation is larger. For this reason,
defocusing can be considered as Low Pass Filter that
attenuates high spatial frequency. Hence, analyzing
the high frequency power spectrum enables us to
estimate the degree of defocus.Using this point, HPF
can be used to estimate focus measure. Laplacian
filtering is one of the methods of high pass filtering
(E. P. Krotkov, 1987). The Sum of absolute values
of convolution is used as focus measure.
We use Laplacian of Gaussian (LoG) instead of
Laplacian for the purpose of reducing the effect of
CCD’s noise and analyzing focus measure.
Following equation (6) is focus measure function f
m
we used.
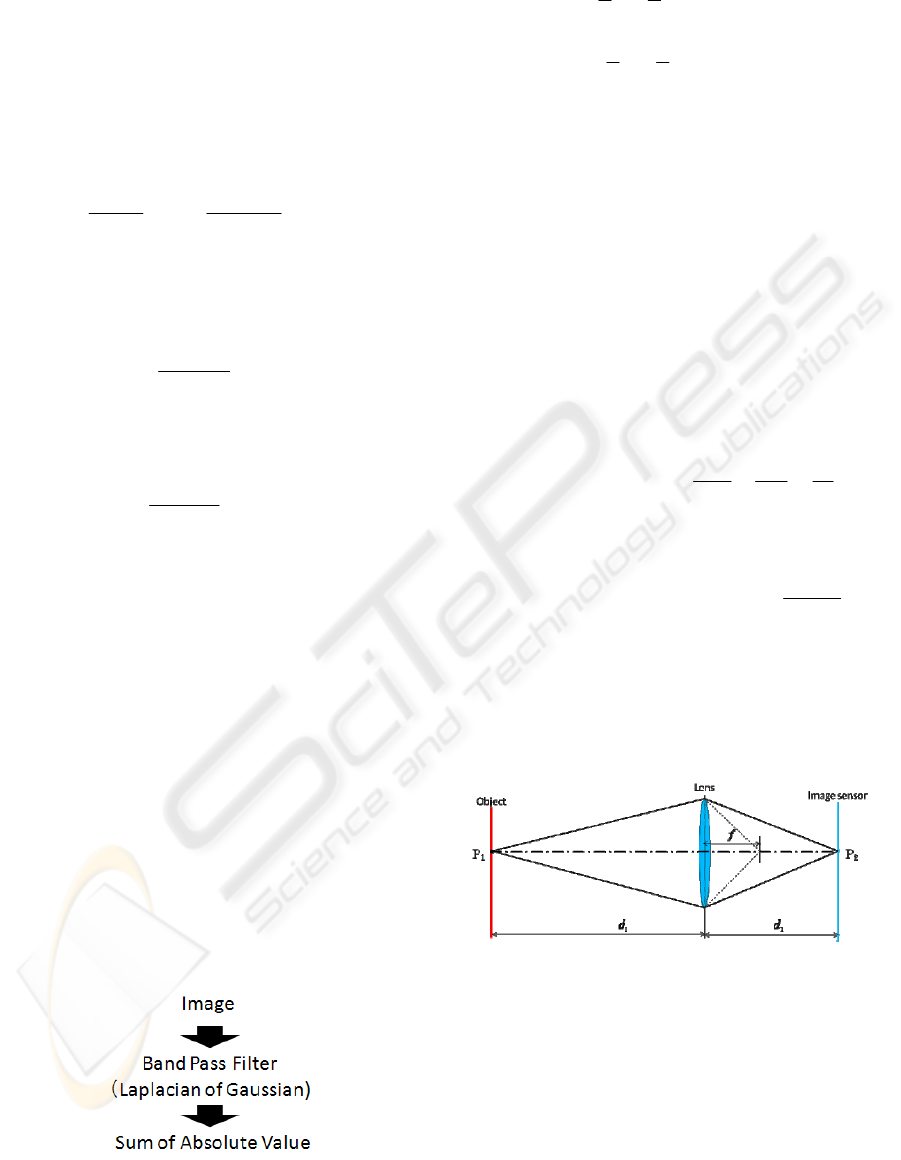
Figure 3: Computation of Focus Measurement.
∑∑
+
−=
+
−=
∗=
2
2
2
2
|),(),(|),(
N
i
N
ix
N
j
N
jy
m
yxiyxLoGjif
(6)
LoG(x, y) is represents the LoG filter. And i(x, y)
is image intensity function. N is the window size of
the summation. (i, j) is the position in the image. The
computation process of focus measure is shown in
Figure 3.
2.3 Depth from the Lens Position
The best focus lens position at each point in the
image is acquired through changing the lens position.
But the relation between the lens position and the
focal plane is necessary to calculate the depth.We
can estimate the relation by the Gaussian lens law
for the thin lens as the following equation. Figure 4
shows the relation between the lens position and the
focal plane. In equation (5), f is the focal length.
111
12
ddf
+=
(7)
From equation (7), we can obtain following equation
(8).
2
1
2
f
d
d
df
=
−
(8)
In equation (8), f depends on the lens and is a
constant parameter. In Figure 4, d
2 is determined by
the camera settings, that is lens position and sensor
position. So depth can be computed if these camera
parameters are found. The result of the computed
depth and measured depth is shown in Figure 5.
Figure 4: Geometry of imaging.
3 EXPERIMENTAL RESULTS
We implemented SFF for recovering the shape of
tilted plate, cylinder and inner wall of pig stomach
by general camera not endoscope shown as Figure 6
as a first step to apply the shape recovering method
to endoscope. The difference between the camera
and the endoscope is scale. But for the purpose of
3D SHAPE RECONSTRUCTION ENDOSCOPE USING SHAPE FROM FOCUS
413
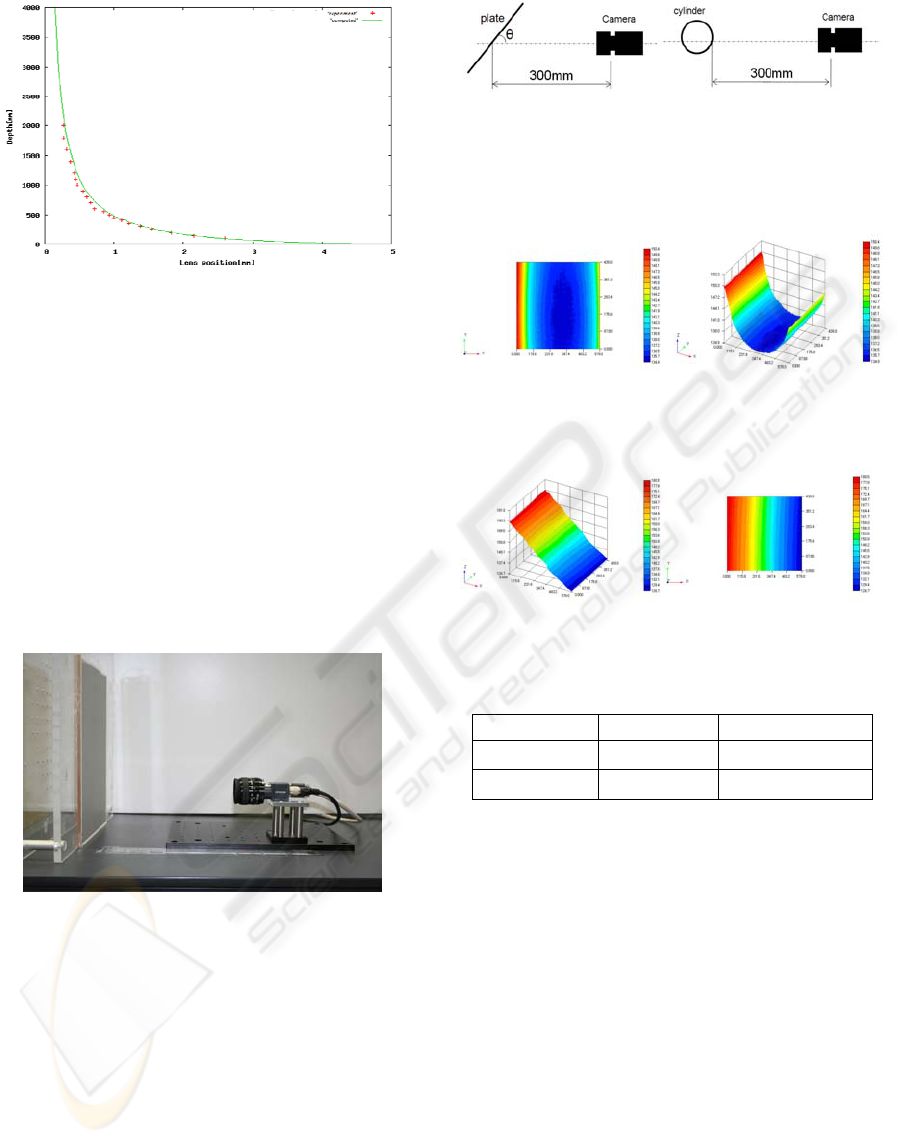
Figure 5: Focused position as a function of lens position.
confirming the possibility of our method, it is
considered to be possible.
Both the plate and the cylinder are covered with
checkerboard pattern. And these are estimated in
order to evaluate the accuracy of our system. In
addition, we selected stomach of pig as body inner
wall model. And then depth information of stomach
is acquired by SFF.
Figure 6 shows a photograph of the experimental
apparatus used to demonstrate the DFF method. A
few images are obtained using a CCD camera with
620x480 pixels and the lens that the focal length is
25mm and the f-number is 1.4. And Camera images
are digitalized and processed using a computer.
Figure 6: Camera and board posted with checkerboard
pattern. Moving the camera relative to the board, the
relation between the lens position and focused position is
obtained experimentally.
3.1 Shape Estimation of Cylinder and
Plate
In the first experiment, we estimated the accuracy of
our SFF system. The condition of this experiment is
following: From camera to object distance is 30mm.
Diameter of cylinder is 59mm and degree of tilted
plate is 45. And we use page of 40 sheets sequence
image. This set-up of experiment is shown as Figure
7.
Figure 7: Experimental set-up.
The result of experiments is shown in Figure 8, 9.
And RMS and Max error of depth map is shown in
Table1.
Figure 8: (a) Frontal image of depth of cylinder. (b)
Lateral image of depth of cylinder.
Figure 9: (a) Frontal image of depth of tilted plate. (b)
Lateral image of depth of tilted plate.
Table 1: RMS and max error of depth map.
Object RMS Error [mm] Maximum Error [mm]
Plane 0.873 3.63
Cylinder 1.19 4.11
3.2 Biological Object
We implemented measurement of inner wall of pig
stomach as an example of inside body measurement.
Inner wall of pig stomach is shown as Figure 10 and
Figure 11.
Figure 12 shows acquired depth map from
measurement. The color is expressed as real depth.
The result of texture mapping images by depth map
and all focused image is expressed Figure 13. All
focused image mentioned above is made of each
pixel which has best focus measure by equation (6).
Considering the result of texture mapping, the
shape of inner wall of pig stomach is reconstructed
successfully in terms of shape recovery. And we can
obtain the shape and texture information at once.
VISAPP 2009 - International Conference on Computer Vision Theory and Applications
414
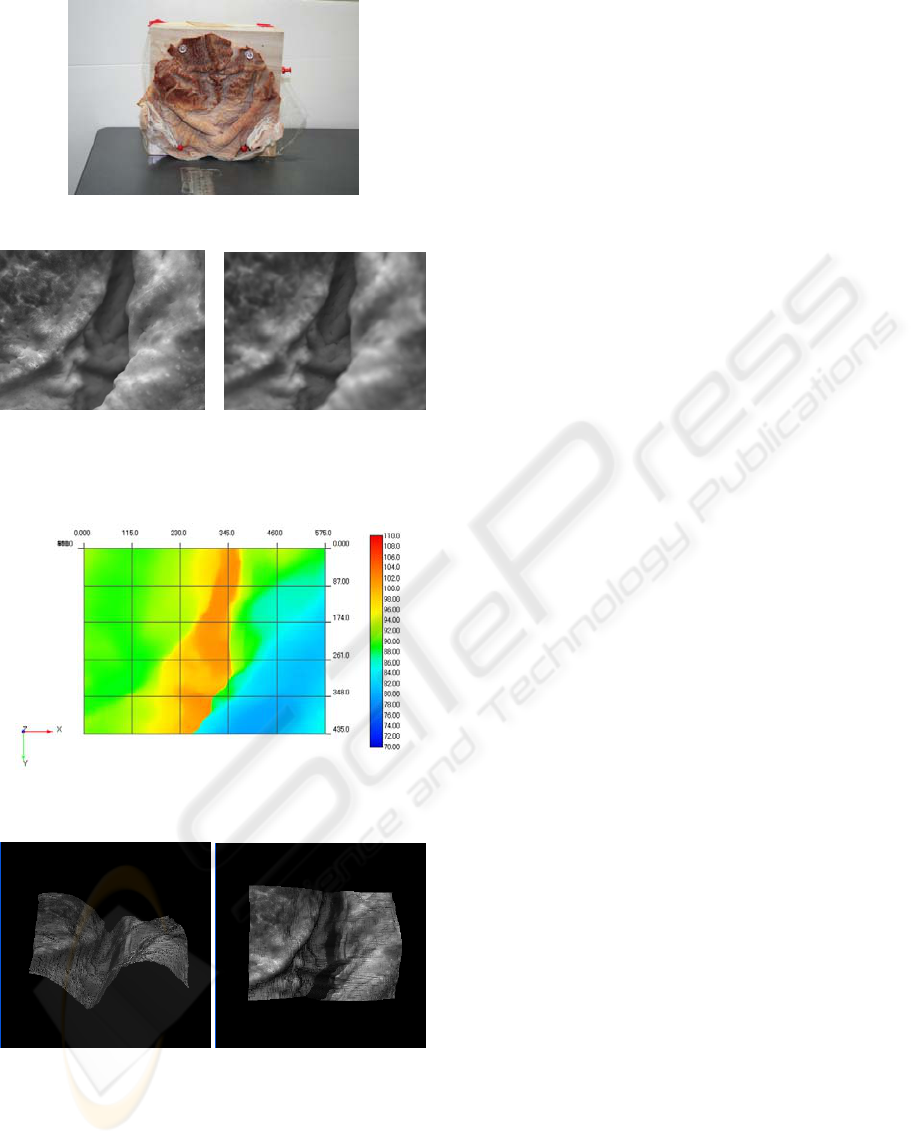
Figure 10: Image of inner wall of pig stomach.
Figure 11: Example of images used for calculation. The
two images are taken with different camera setting.(Lens
position).
Figure 12: Depth map of inner wall of pig stomach.
(a) Frontal shape (b) Lateral shape
Figure 13: The result of texture mapping by Figure 11, 13.
4 DISCUSSION
4.1 Accuracy Improvement
In the 3D shape measurement using SFF, depth of
field (DOF) is one of the most important factors to
determine the accuracy of measurement physically.
The smaller the DOF becomes, the more the depth
resolution rises. Therefore, the optimization of the
optical parameters is necessary in SFF measurement.
In the shape measurement experiment of the
biological object, the spatial resolution is considered
to be decreased. It is thought that in the equation 6,
the window size N causes the effect. For improving,
it is necessary to optimize the filter parameters used
in the calculation of focus measure. The spatial
resolution becomes high when the window size is
decreased. On the other hand, the effect of noise
becomes larger. So to determine the optimal
parameter, it is needed to take these points into
consideration.
4.2 Application for Endoscope
In experiments, we use a usual camera. But the
verification with an endoscope shaped device is
indispensable to actually apply it to the endoscope.
However, we are examining the structure that not to
install the system in an existing endoscope but to
install the small camera able to move the lens or
image sensor on the head of thin fiber. In this case,
major difference with an actual endoscope is size.
But the blur phenomenon is quite similar as shown
in Fig.5. Therefore, we think that the miniaturized
system can measure the shape similarly if the optical
geometry is equivalent.
We assume that the system is used in the
diagnosis such as polyp detection. But about forty
images are used to calculate the depth map shown in
Fig.13. In this case, the high speed camera is thought
to be needed.
5 CONCLUSIONS
We have presented a 3-D shape reconstruction
endoscope using SFF. And we conducted
experiments to estimate the accuracy of shape
measurement and confirmed qualitatively to be able
to measure the shape of the biological object.
3D SHAPE RECONSTRUCTION ENDOSCOPE USING SHAPE FROM FOCUS
415

REFERENCES
Vining DJ and Gelfand DW, Noninvasive colonoscopy
using helical CT scanning, 3D reconstruction, and
virtual reality, Presented at the 23rd Annual Meeting
and Postgraduate Course of the Society of
Gastrointestinal Radiologists, Maui, Hawaii, 1994.
D. K. Iakovidis, D. E. Maroulis, S. A. Karkanis and A.
Brokos, A Comparative Study of Texture Features for
the Discrimination of Gastric Polyps in Endoscopic
Video, In 18
th
IEEE symposium on Computer-Based
Medical Systems (CBMS’05) IEEE Computer Society
Los Alamitos:575-580, 2005.
D. Stoyanov, A. Darzi and G. Z. Yang, A practical
approach towards accurate dense 3D depth recovery
for robotic laparoscopic surgery, Computer Aided
Surgery, 10(4):199-208,2005.
M. Hayashibe, N. Suzuki and Y. Nakamura, Laser-scan
endoscope system for intraoperative geometry
acquisition and surgical robot safety management,
Medical Image Analysis 10: 509-519, 2006.
T. Okatani and K. Deguchi, Shape Reconstruction from an
Endoscope Image by Shape from Shading Technique
for a Point Light Source at the Projection Center,
Computer Vision and Image Understanding,
66(2):119-131, 1997.
P. Sánchez-González, F. Gayá et al, Segmentation and 3D
Reconstruction Approaches for the Design of
Laparoscopic Augmented Reality Environments,
ISBMS 2008:127-134, 2008
K. Deguchi, T. Sasano, H. Arai and H. Yoshikawa, 3-D
Shape Reconstruction from Endoscope Image
Sequences by The Factorization Method, IEICE
Transactions on Information and Systems, E79-
D(9):1329-1336, 1996.
T. Nagakura, K. Okazaki et al, The Study for Automatic
3D Reconstruction of Endoscopic Video Image,
Proceedings of the Second International Conference
on Innovative Computing, Informatio and Control:308,
2007
B. K. P. Horn, Focusing, MIT Artificial Intelligence
Laboratory MEMO NO.160, 1968
E. P. Krotkov, Focusing, International Journal of
Computer Vision, 1:223-237, 1987.
S. K. Nayar and Y. Nakagawa, Shape from focus: An
effective approach for rough surface, IEEE
Transaction, on Pattern Analysis and Machine
Intelligence, 16(8):824-831, 1994.
M. Subbarao and G. Gurya, Depth from defocus: A spatial
domain approach, Int. J. Computer Vision, 13:271-
294, 1994.
A. Pentland, A new sense for depth of field, IEEE
Transactions on Pattern Analysis and Machine
Intelligence, 9(4):523-531, 1987
VISAPP 2009 - International Conference on Computer Vision Theory and Applications
416
