
CELL TRACKING AND DATA ANALYSIS OF IN VITRO
TUMOUR CELLS FROM TIME-LAPSE IMAGE SEQUENCES
Kuan Yan, Fons J. Verbeek
Section Imaging and Bioinformatics, Leiden Institute of Advanced Computer Science, Leiden University
Niels Bohrweg 1, 2333 CA Leiden, The Netherlands
Sylvia Le Dévédec, Bob van de Water
Section Toxicology, Leiden/Amsterdam Center for Drug Research, Leiden University
Niels Bohrweg 1, 2333 CA Leiden, The Netherlands
Keywords: Object tracking, Cell tracking, Cellular phenotype, Tumour cell, Time-lapse video, Cell migration analysis,
KDE mean shift, Steepest descent, High-throughput, High-content, Video analysis, Image sequence.
Abstract: In this paper, we address the problem of the analysis of cellular phenotype from time-lapse image sequences
using object tracking algorithms and feature extraction and classification. We discusses the application of
an object tracking algorithm for in the analysis of high content cell-migration time-lapse image sequence of
extremely motile cells; these cells are captured at low time-resolution.. The small size of the objects and
significant deformation of the object during the process renders the tracking as a non-trivial problem. To
that end, the ‘KDE Mean Shift’, a real-time tracking solution, is adapted for our research. We illustrate that
in a simulation experiment with artificial objects, with our algorithm an accuracy of over 90% can be
established. Based on the tracking result, we propose several morphology and motility based measurements
for the analysis of cell behaviour. Our analysis requires only initial manual interference; the majority of the
processing is automated.
1 INTRODUCTION
Cytomics is the study of cell systems, referred to as
the cytome, at the level of the single cell; it attempts
to understand the molecular architecture and the
functionality of the cell system. Much of this is
achieved by using a combination of molecular and
imaging techniques allowing the various components
of a cell to be visualised by time-lapse image
sequence either in vivo or in vitro. When applied to
larger volumes of cells studied under different
experimental conditions, such a study is usually
referred to as a screen.
An automated cell screening for a 200-target
RNA study will result in 400 image sequences; each
of the sequences contains over 100 cells. Manually
analyzing these videos is virtually impossible.
Therefore, video tracking and data analysis are used;
smart application of these techniques is crucial.
Existing studies of cell tracking (Rogers, et al,
2006) illustrate physical solutions to cell tracking;
this research focuses on in vivo cell tracking using
Magnetic Resonance Imaging (MRI). This approach
is complex and requires advanced MRI equipment
suitable for high-resolution imaging. Computer
vision studies
(Li and Kanade, 2007) also show that
level-set based tracking algorithms can produce good
tracking results directly from sequences as captured
from a fluorescence or bright field microscope. In
these studies, the tracking accuracy reaches an
average of 85%. The method can deal with cell
proliferation by splitting trajectories.
To date, measurements on cell-phenotype have
not been extracted from time-lapse image sequences.
Moreover, the phenomena that are captured in time-
lapse in image sequences, e.g. metastatic behaviour
of a target cell-line, are often subtle and therefore it
requires a range of features be evaluated. The image
sequence is captured such that the relevant
observations on behaviour can be deduced from the
measurements. Sampling below the standard video-
rate is also necessary as otherwise; the amount of
data will not be manageable. Challenges regarding
281
Yan K., Verbeek F., Le Dévédec S. and van de Water B. (2009).
CELL TRACKING AND DATA ANALYSIS OF IN VITRO TUMOUR CELLS FROM TIME-LAPSE IMAGE SEQUENCES .
In Proceedings of the Fourth International Conference on Computer Vision Theory and Applications, pages 281-286
DOI: 10.5220/0001804302810286
Copyright
c
SciTePress
the analysis of such image sequences are addressed
in this paper.
The structure of this paper is as follows: In
section 2, we describe the pre-processing of raw
image data; this includes segmentation of the images
and subsequent object extraction. The objects that we
extract are cells and these behave as non-rigid bodies
while moving. In section 3, we present our approach
to non-rigid objects tracking and explain our
algorithm for a metastatic/motile cell model based on
time-lapse image sequences of sparse time sampling
(6 min/frame). We estimate the robustness and
accuracy by introducing a test with artificial
images/objects. In section 4, we illustrate our method
with a data set typical for cytomics in which cell
migration is analysed using cell tracking and
phenotypic characterisation.
In this paper, sequence images are obtained at a
fixed rate of 6 min/frame from a CCD camera
mounted on a fluorescence microscope. In case of
artificial images, the situation with the fluorescence
microscope is simulated, i.e. bright objects on a dark
background. The algorithm is implemented as an
ImageJ plug-in in JAVA. Data analysis is performed
by PRTOOLS, a pattern recognition library for
MATLAB.
2 IMAGE PREPROCESSING
In order to be able to trace the objects in our image
sequence, i.e. the cells, all objects must be labelled.
Therefore a segmentation algorithm including the
object labelling was developed. The segmentation
and labelling need to operate in concert as sometimes
the objects appear in clusters. In our algorithm, we
identify these clusters are and then properly separate
them.
The original images are slightly smoothed using a
standard Gaussian filter to remove speckle noise.
Imperfections in the illumination of the field of view
are corrected through a rolling ball
algorithm.(Sternber, 1983)
For the visualization of the cells under the
microscope, a staining procedure is applied.
Variations in the staining of individual cells result in
different intensity profiles of the cells. Consequently,
a global segmentation is less effective for the object
extraction. Therefore, instead, we have implemented
a local adaptive version of the isodata method. This
method employs a spherical kernel with a radius in
the range of [15-20] pixels; this radius depends on
settings derived from the imaging protocol. A
convolution with this kernel results in a in a local
threshold value for each pixel. In order to prevent
problems in large areas of background, the global
average intensity is used a lower boundary of the
threshold; pixels evaluated under that boundary are
set to background. Next, we evaluate the set of
labelled objects resulting from the segmentation as
being part of a cluster of cells or not. To that end, the
initial binary objects are used as a mask in the
original image and a gray-value watershed is
employed to provide further separation in case cells
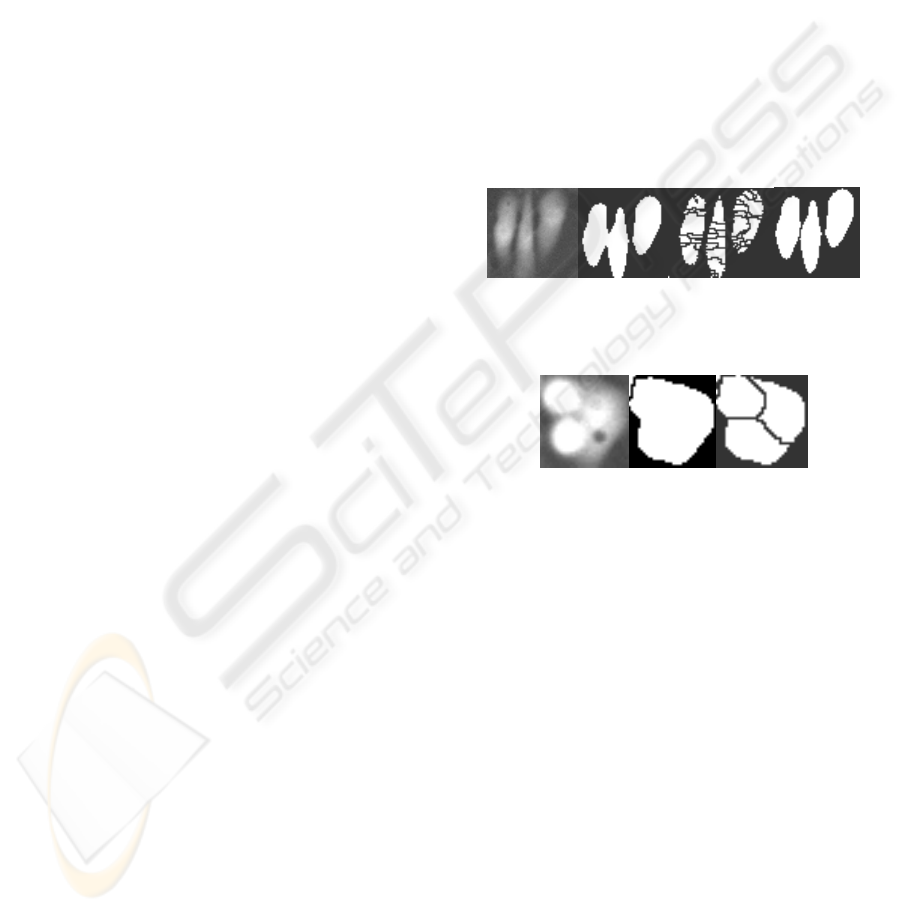
are clustered (cf. Fig.1). The gray-value watershed
results in a more accurate separation as compared to
the binary watershed (cf. Fig.2).
Now, each separated foreground object is labelled as
a cell and the binary mask of these cells with the
corresponding intensity information will be used as
the initial model for KDE Mean Shift tracking
algorithm.
Figure 1: Left to Right (1) Original Image (2) Binary mask
(3) Watershed without Gaussian filter (4) Watershed with
Gaussian filter.
Figure 2: Left to Right (1) Original Image (2) Binary
watershed (3) Gray-value watershed.
3 CELL TRACKING
We chose the Kernel Density Estimation (KDE)
Mean Shift with Steepest Descent Tracking (KDE
Mean Shift) as a tracking solution due to its
robustness and recognized performance in real-time
tracking (Yang et al., 2003). Although initially
designed for real-time tracking, the algorithm
demonstrates outstanding performance in time-lapse
imaging applications as typical for cytomics.
3.1 KDE Mean Shift with Steepest
Descent Tracking
In computer vision, KDE mean shift (Yang, et al,
2003) is a popular kernel based tracking algorithm
and considered as real world application of an
approach to localization. KDE Mean Shift Tracking
consists of two steps:
VISAPP 2009 - International Conference on Computer Vision Theory and Applications
282
non-parametric density estimation using an
initial module.
steepest descent to locate the local maximum in
a gradient space of density estimation.
Each trajectory begins with cells in the first
frame. These cells are converted into initial model
defined in a 3D feature space: (1) the x coordinate of
a binary mask of a cell, (2) the y coordinate of a
binary mask of a cell, (3) the intensity value at each
pixel (x, y).
Given n data points x
n
in the d-dimensional space
R
d
, the kernel density estimator with kernel function
K(x) and window bandwidth h, can be expressed as:
()
∑
=
⎟
⎟
⎠
⎞
⎜
⎜
⎝
⎛
−
=
n
i
i
d
dk
kh
h
xx
K
nh
c
xf
1
2
,
,
ˆ
(1)
A generally used class of kernels is the radial
symmetric kernels, expressed as:
() ( )
2
1
2
1
2
1
2
2
x
d
N
exK
−
∑−
−
−
∑=
π
(2)
The mean shift estimation is completed by
steepest descent through iterative computation of:
• the mean shift vector
(
)
k
xm
• the shift module by
(
)
kkk
xmxx +=
+1
The steepest descent requires estimation of a
gradient space
()
(
)
xkxg '−=
, where term
(
)
k
xm is
the new mean shift (cf. Eq. 3). Due to the shape
change (deformation) of the cells, the steepest
descent does not necessarily converge at the centre
of mass of the true candidate. We chose the cell
closest to the stationary point as a true candidate.
()
x
h
xx
g
h
xx
gx
xm
n
i
i
n
i
i
i
−
⎟
⎟
⎠
⎞
⎜
⎜
⎝
⎛
−
⎟
⎟
⎠
⎞
⎜
⎜
⎝
⎛
−
=
∑
∑
=
=
1
2
1
2
(3)
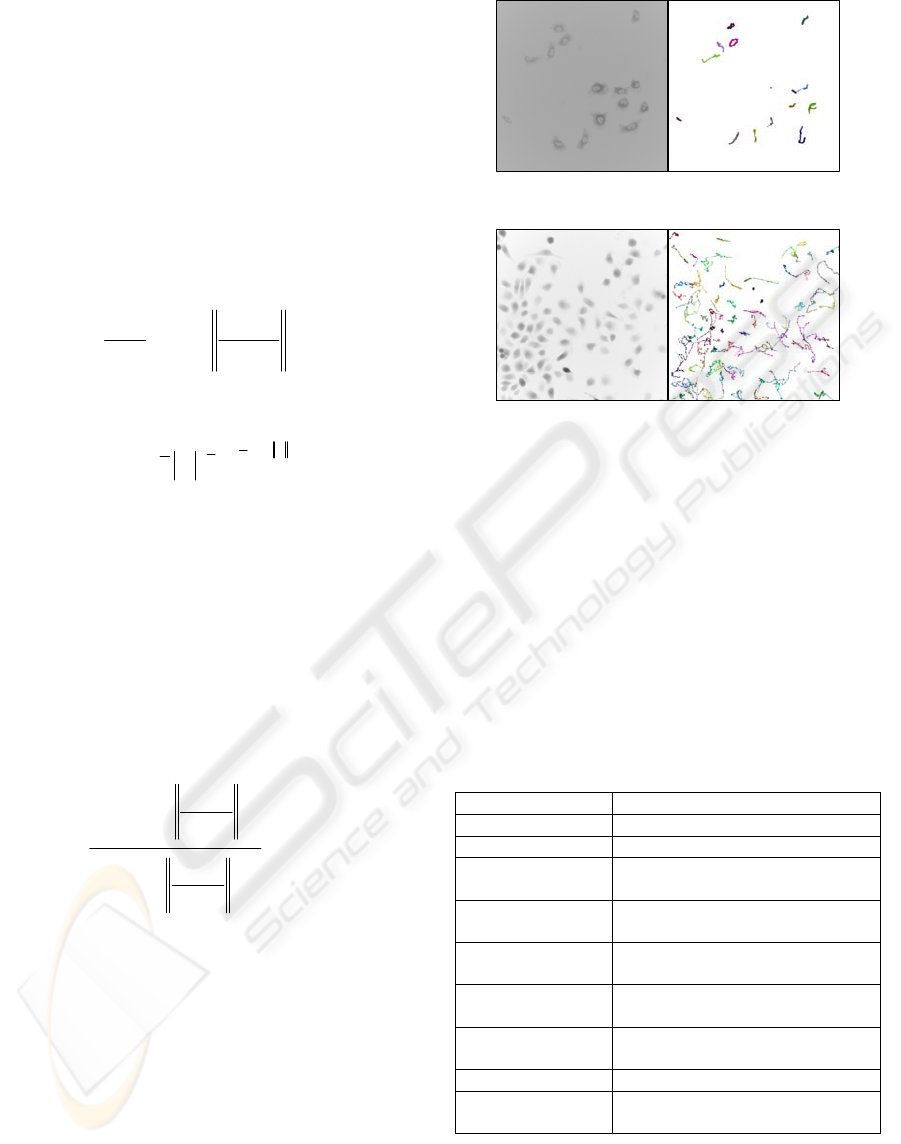
We perform cell tracking on time-lapse image
sequences with different levels of magnification (cf.
Fig.3 and Fig.4). If proper segmentation is applied to
the cell regions then KDE Mean Shift is resistant to
morphology and motility behaviour of cancer cells.
In Figure 4, an estimation of cell motion is
illustrated. Still, estimation of the performance of
KDE using time-lapse image sequences from real
cells is subjective. Therefore, we have developed an
objective and reproducible estimation method. We
initiated this development by testing tracking
accuracy using a time-lapse series containing
artificially generated objects.
Figure 3: Tracking of tumour cells at 40X fluorescence.
Figure 4: Tracking of tumour cells at 20X fluorescence.
3.2 Error Estimation of the Tracking
Our artificial object test, referred to as ‘virtual cell
test’, is utilized for error estimation of the tracking
algorithm. The test of artificial objects rules out
complex situations that occur in “live cells”.
Moreover, the imaging is ideal and illumination
deficiencies do not occur whilst the behaviour of the
virtual “cell” can be controlled completely. The
virtual cell test simulates two basic cell migration
behaviours: (1) shifting position and (2) extending
protrusion.
Table 1.
Parameter name Description
minT Minimum travel distance of a cell
maxT Maximum travel distance of a cell
minH
Minimum extension in y-axis
direction, can be shrinkage
maxH
Maximum extension in y-axis
direction
minW
Minimum extension in x-axis
direction, can be shrinkage
maxW
Maximum extension in x-axis
direction
R
Initial radius of virtual cell
(equivalent to size)
Cell Number of virtual cells in video
Seq
Length of the time-lapse
sequence
Each “virtual cell test” object has several
predefined parameters to control their behaviour (cf.
Table 1). Once created, a virtual cell object will
randomly shift or extend and is restricted by these
CELL TRACKING AND DATA ANALYSIS OF IN VITRO TUMOUR CELLS FROM TIME-LAPSE IMAGE
SEQUENCES
283
parameters. The motion and shape change of the
objects is self-organizing without any predefined
motion model (cf. Fig. 5). In pseudo code, this is
expressed as follows:
Pseudo Code: #virtual cell extending
With a existing virtual cell;
Generate a width in (minW, maxW);
Generate a height in (minH, maxH);
Pseudo Code: #virtual cell position
shift
Do{
Generate a step size in (mint, maxT)
If(causes collision){
Discard the step size;
}
Else{
Keep the step size;
}
}while(step size is not feasible);
Pseudo Code: #generate cell shape
For i in x-width to x+width step 1{
For j in y-height to y+height step 1{
If (i,j) in the range of ellipse
defined by width, height, x, and
y position{
pixel(i,j) is given a
intensity value weighted
by the distance between
(i,j) and mass centre
}
}
}
Image sequences are acquired by recording the
motion of these virtual objects; in this manner, the
true trajectory of cell migration can be captured and
used in error estimation. The score system in our
error estimation consists of two factors, i.e.:
(1) The accomplish ratio ‘T’ between the total
number ‘n’ of trajectory determined by tracking
algorithm and the total number ‘N’ of trajectory
captured during the video generation:
(
)
NTrajectory
NnTrajectory
T
∈
∩∈
=
(4)
(2) The percentage ‘O’ of identical ‘Node’
between each trajectory s determined by the tracking
algorithm and trajectory S as captured from the
image frames:
()
S
Node
SsNode
O
∈
∩
∈
=
(5)
From these factors, the final score is computed:
()
SNode
SsNode
N
n
OTScore
∈
∩∈
⋅=⋅=
(6)
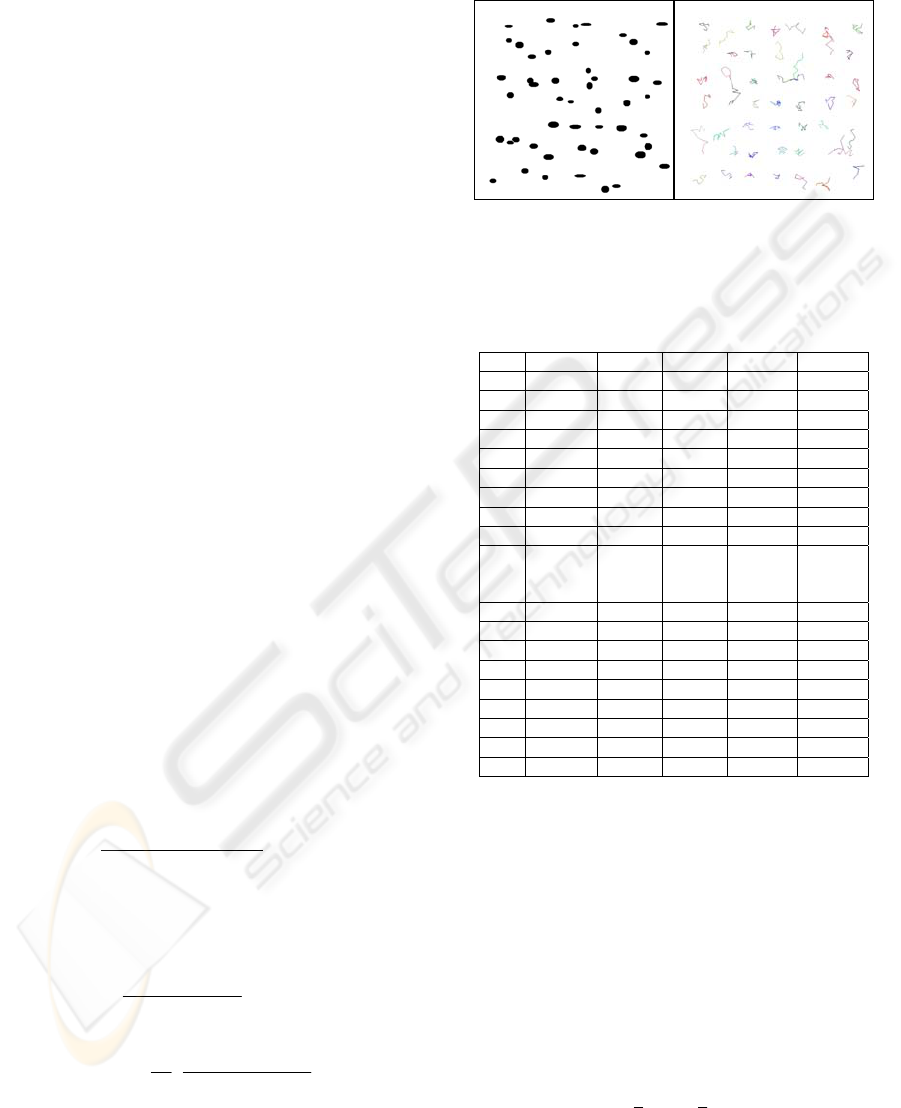
By adding the accomplished ratio ‘T’, require the
tracking algorithm to correctly tracking each
trajectory and capable of identify all possible
trajectories (cf. Fig. 5). Under different behaviour
parameters, KDE mean shift shows an overall
performance above 90% (cf. Table 2).
Figure 5: A sample of cell tracking using virtual cell video.
Table 2: Virtual cell test using different parameters. Each
set generate 10 videos with the same length (30 frames).
The mean error is the average of 10 videos, similarly, the
std error.
Set minT maxT minH maxH minW
1 5 10 20 40 30
2 10 20 20 40 30
3 5 10 20 40 30
4 10 20 20 40 30
5 5 10 20 40 30
6 10 20 20 40 30
7 5 10 20 40 30
8 10 20 20 40 30
Set maxW R cell
Avg
Corr
%
Std
Corr
%
1 60 30 5 99.4 1.87
2 60 30 5 96 6.1
3 60 30 20 86.51 3.66
4 60 30 20 74.4 6.89
5 60 30 5 100 0
6 60 30 5 99.26 1.61
7 60 30 20 97.05 2.91
8 60 30 20 89.47 3.91
Mean
92.76 3.37
3.3 Feature Measurements
We have divided the feature measurements into
motility and morphology measurements based on
biological meaning. Area, perimeter, centre of mass
are used as basic features to describe cell size and
position. In addition, shape is described by
Extension, Dispersion and Elongation which are
derived from moment invariants (Huang, et al,
2003)(Gonzalez, et al, 2004)(Verbeek, 1995)( van
der Putten, et al, 2007)
[4][5][7][8]
; These features are
calculated from normalized moments:
()()()
∑∑
−
−
−−=
1
0
1
0
,
sy
sx
qp
pq
yxFyyxx
μ
(7)
VISAPP 2009 - International Conference on Computer Vision Theory and Applications
284
()
∑∑
−
−
=
1
0
1
0
00
,
sy
sx
yxF
μ
(8)
1
2
,
00
+
+
==
qp
r
r
pq
pq
μ
μ
η
(9)
and the first and second moment invariant
20021
η
η
φ
+=
(10)
()
2
11
2
20022
4
ηηηφ
+−=
(11)
henceforth condensed in:
(
)
211
2
φφπλ
+=
(12)
(
)
212
2
φφπλ
−=
(13)
1
ln
λ
=Extension
(14)
21
ln
2
1
λλ
=Dispersion
(15)
2
1
ln
2
1
λ
λ
=Elongation
(16)
These three measurements (cf. Eqs. 14-16) are
shape descriptors, that are, due to internal
normalization, scale-free and resistant to noise.
Extension measures roughness of a long protrusion
and dispersion measures roughness of the small
protrusions. Elongation measures how cell is
elongated in its major axis. An active cell line
intends to have a high value in all three invariants.
Further, Absolute Position Shift is calculated
as the position shift of one cell between first frame
(cell position
()
00
, yx ) and last frame (cell
position
()
mm
yx , ):
()()
2
0
2
0
yyxxs
mma
−+−=
(17)
Trajectory Length is the total length of
trajectory:
Current position
()
ii
yx ,
Next position
()
11
,
++ ii
yx
()()
∑
=
++
−+−=
m
i
iiiit
yyxxs
0
2
1
2
1
(18)
Velocity is calculated by the shift of centre of
mass divided by time-interval:
()( )
t
yyxx
v
iiii
i
2
1
2
1
−+−
=
++
(19)
Motion Linearity is the ratio between absolute
position shift and trajectory length; normalized by
trajectory length, motion linearity is scale-free:
Since we aim to characterize the cellular
phenotype, the study of feature measurements in one
cell in one particular frame has little biological
meaning. Therefore, we generalized the frame-based
measurement into a cell-based measurement.
Considering measurements as a discrete signal (cf.
Fig. 4), it can be generalized by:
(
)
(
)
TtACostf +
+
=
ω
α
(20)
The amplification A, the frequency
α
, and shift
T may well preserve the majority structure of such
discrete signal (measurement vs. time). With these
cell-based measurements (cf. Table 3), we are able to
compare cell behaviour and establish significant
changes in behaviour. In the next section, a test for
reliability of our principles is discussed.
Table 3: The cell-based measurements.
Cell-based
measurement
Description
Average size
Average size for one cell through
all frames
Average extension
Average extension for one cell
through all frames
Std extension
Standard deviation of extension for
one cell through all frames
Average dispersion Same as average extension
Std dispersion Same as std extension
Average elongation Same as average extension
Std elongation Same as std extension
Average velocity
Average velocity for one cell
through all frames
Average motion
linearity
Average motion linearity for one
cell through all kernel window
4 RELIABILITY TEST AND
BIOLOGICAL EXPERIMENTS
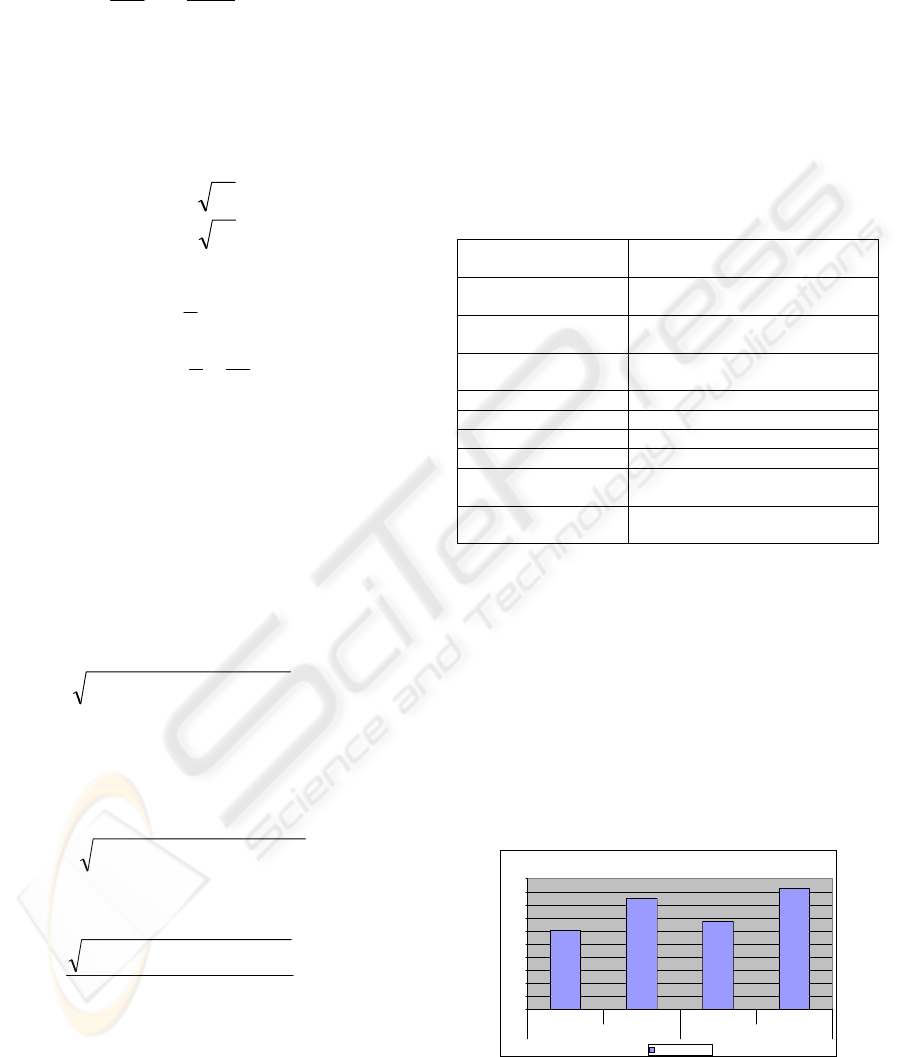
In Figure 6, we show the result of an experiment
with motility stimulation. In two groups, cells are
treated with a growth factor (experiment) and
expected to move faster with respect to the control
group (control). The effect of this stimulation is
observed in our measurement results. (Alberts, et al,
1994)
Average Velocity of All Cell in Ctrl Group vs. Experiment Group
0
0.5
1
1.5
2
2.5
3
3.5
4
4.5
5
control experiment control experiment
group 1 group 2
Average Velocity
average velocity
Figure 6: Control vs. EGF treated.
In addition, multiple subgroups of cells from the
same sample culture are determined using K-Mean
CELL TRACKING AND DATA ANALYSIS OF IN VITRO TUMOUR CELLS FROM TIME-LAPSE IMAGE
SEQUENCES
285
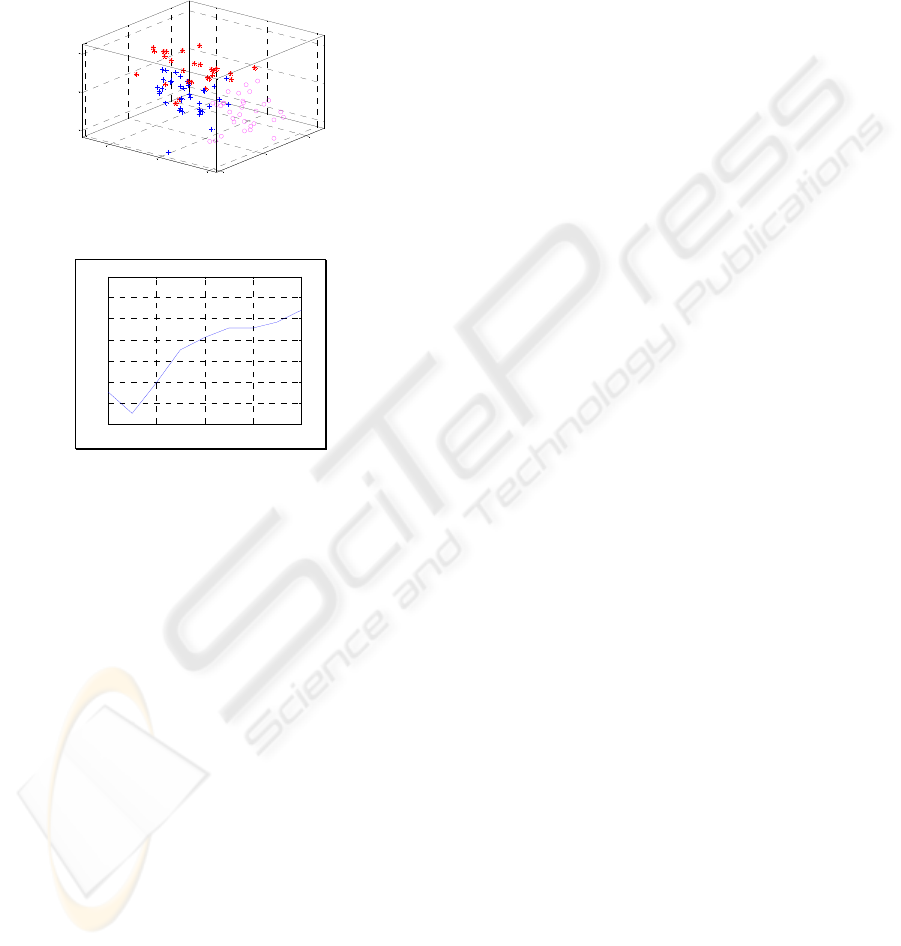
Clustering (cf. Fig. 7). The number of clusters is
validated by the lowest Davies-Bouldin Index (DBI)
score (cf. Fig. 8). The result of DBI score confirms
three natural subgroups: (1) Normal cells (2)
Correctly treated cells (3) Incorrectly treated cells.
These measurements are consistent with results from
similar experiments on different dates.
-2
0
2
-2
0
2
-2
0
2
Cell Size
Unsupervised Clustering on Cell Beavhior
Cell Elongation
C
e
ll
V
e
l
oc
it
y
Figure 7: Cell behaviour clustering.
2 4 6 8 10
1.4
1.6
1.8
2
2.2
2.4
2.6
2.8
Number of Cluster
Davies-Bouldin Validity Index
Clustering Validation using DBI Score
Figure 8: Clustering validation using Davies-Bouldin
validity index.
5 CONCLUSIONS
Object tracking has been studied comprehensively in
computer vision. We investigated object tracking
algorithms to support cytomics research and we
demonstrated how these can be successfully applied.
Our results, i.e. object tracking and data analysis, on
real data illustrate application on image sequences
depicting a metastatic/motile cell model.
We developed an artificial object test and this test
shows that our approach of the KDE Mean Shift can
provide an accuracy over 90% (85% in level set
tracking); for cell-tracking analysis this is acceptable.
The measurements on the cells resulting from the
tracking present correct conclusions in relation to the
biological experiment. The feedback from the “wet-
lab” indicates that labour time of post-experiment
data analysis is reduced enormously (≥ 300%) while
accuracy of cell-migration analysis has significantly
increased. Moreover, automation allows processing
of large volumes of data.
Finally, the tracking analysis of migrating
(tumour) cells provides sufficient confidence to
continue further research on structural level tracking.
ACKNOWLEDGEMENTS
This research has been partially supported by the
BioRange Programme of the Dutch ministry of
Economic affairs (BSIK grant). We would like to
thank Hans de Bont for his assistance in the
microscopy.
REFERENCES
Yang, CJ., Duraiswami,, R. DeMenthon,, D. and Davis,
L.S. (2003). Mean-shift analysis using quasi Newton
methods, In Image Processing, International
conference on Volume 2, Issue , 14-17 Sept. 2003
Perceptual, Interfaces & Reality Laboratory,
University of Maryland, USA
Li, K. and Kanade, T. (2007). Cell Population Tracking
and Lineage Construction Using Multiple-Model
Dynamics Filters and Spatiotemporal Optimization, In
Proceedings of the 2nd International Workshop on
Microscopic Image Analysis with Applications in
Biology (MIAAB). Carnegie Mellon University, USA
Alberts, B., Johnson, A., Lewis, J., Raff, M., Roberts, K.
and Walter, P., (1994). Molecular Biology of the Cell,
Garland Science Publishing, New York, ISBN 0-8153-
4072-9, USA
Huang, C., Rajfur, Z., Borchers, C., Schaller, M.D. and
Jacobson, K. (2003). phosphorylates paxillin and
regulates cell migration, In Journal Nature,
Department of Cell and Developmental Biology,
Comprehensive Center for Inflammatory Disorders,
University of North Carolina, USA.
Gonzalez, R.C., Woods, R.E. and Eddins, S.L., (2004)
Digital Image Processing using MATLAB, Person
Prentice Hall Publishing, ISBN 0-13-008519-7, UK
Verbeek, F.J. (1995). Three dimensional reconstruction
from serial sections including deformation correction
(Delft, Delft University of Technology), the
Netherlands.
van der Putten, P., Bertens, L.F.M., Liu, J., Hagen, F.,
Boekhout T., Verbeek F.J. (2007). Classification of
Yeast Cells from Image Features to Evaluate Pathogen
Conditions, In Proc. SPIE Vol. 6506, MultiMedia
ontent Access: Algorithms & Systems, Vol. 6506 (Eds
Hanjalic, A., Schettini, R., Sebe, N.), 65060I-1,65060I-
14
Rogers, W.J., Meyer, C.H. and Kramer, C.M. (2006),
Technology Insight: In Vivo Cell Tracking by Use of
MRI, In Nat Clin Pract Cardiovasc Med, Nature
Publishing Group, USA
Sternber, S., (1983), Rolling ball algorithm, In Biomedical
Image Processing, IEEE Computer, January 1983
VISAPP 2009 - International Conference on Computer Vision Theory and Applications
286
