
ColEnViSon: Color Enhanced Visual Sonifier
A Polyphonic Audio Texture and Salient Scene Analysis
Codruta Ancuti, Cosmin Ancuti and Philippe Bekaert
Hasselt University -tUL-IBBT, Expertise Centre for Digital Media
Wetenschapspark 2, Diepenbeek, B3590, Belgium
Keywords:
Blind Navigation,Visual Saliency, Color Transformation.
Abstract:
In this work we introduce a color based image-audio system that enhances the perception of the visually
impaired users. Traditional sound-vision substitution systems mainly translate gray scale images into corre-
sponding audio frequencies. However, these algorithms deprive the user from the color information, an critical
factor in object recognition and also for attracting visual attention. We propose an algorithm that translates
the scene into sound based on some classical computer vision algorithms. The most salient visual regions
are extracted by a hybrid approach that blends the computed salient map with the segmented image. The
selected image region is simplified based on a reference color map dictionary. The centroid of the color space
are translated into audio by different musical instruments. We chose to encode the audio file by polyphonic
music composition reasoning that humans are capable to distinguish more than one instrument in the same
time but also to reduce the playing duration. Testing the prototype demonstrate that non-proficient blindfold
participants can easily interpret sequence of colored patterns and also to distinguish by example the quantity
of a specific color contained by a given image.
1 INTRODUCTION
For sighted people, vision is the most efficientsensory
modality to process the spatial information and thus it
dominates the other faculties of perception. Visual
impaired people compensate their deficiency by the
other senses. Several visual substitution systems have
been proposed in the literature. Among of them, au-
dio to sound systems manifest increasingly attention
in the last period.
Traditional sound-vision substitution systems
mainly translate the gray scale images into corre-
sponding audio frequencies. One important imple-
mentation constraint is that the common sighted per-
sons acquire and also understand almost instanta-
neously what they see. Ideally, the necessary render-
ing time of the substitution system per frame needs
to be relative short. For this reason, the informa-
tion should be displayed as distinctive as possible in a
large audio volume but also in concise intervals.
However, color improves scenes recognition by
playing a bounding role in memorial representation
(Clifford, 2004; Rossion, 2004) and also by enhanc-
ing surface segmentation and edge detection (Fine, ).
We introduce a novel vision-sound substitution sys-
tem: ColEnViSon (Color Enhanced Visual Sonifier)
that codes accurately and distinctively by musical in-
struments the color information of videos and images.
For rendering an image into sound our approach con-
tains several stages. Given an image we identify the
most salient regions by computing and combining dif-
ferent salient feature maps. Afterwards, the regions
of focus are refined based on the image segmenta-
tion. Inspired by our visual system, we transform im-
ages by two resolution levels. The salient regions (fo-
cused) are rendered more accurately while the rest of
the image is interpreted polyphonically. The system
translates into audio a given image by converting the
values of the color pixels into sound variations of mu-
sical instruments. To facilitate the process of learning
we chose to use only ten musical instruments. There-
fore, the color space is simplified based on a prede-
fined color dictionary. After image color simplifica-
tion step, the initial information of luminance is pre-
served. Intensity variations are played proportional to
the musical instrument scale. Besides of the general
proposed scheme, that we believe that is more easy
and pleasing to learn comparing with the previous
work, an additional improvement is that our system
reduces the rendering time by adopting a polyphonic
approach.
566
Ancuti C., Ancuti C. and Bekaert P. (2009).
ColEnViSon: Color Enhanced Visual Sonifier - A Polyphonic Audio Texture and Salient Scene Analysis.
In Proceedings of the Fourth International Conference on Computer Vision Theory and Applications, pages 566-572
DOI: 10.5220/0001805105660572
Copyright
c
SciTePress

Finally, we compared our system with the well known
vOICe (Meijer, 1992) approach in the context of
identifying simple color patterns by users that expe-
rienced for short periods both systems. Our experi-
ments reveal very promising results for non-proficient
blindfold participants that were able to easily interpret
sequences of colored patterns and also to distinguish
by example the quantity of a specific color contained
in an image.
2 RELATED WORK
Non-invasive methods for vision-substitution have
been investigated since the ’60s (Bach-y Rita P.,
1969) but un-succeeding on large scale to replace the
common accessories used by visually impaired peo-
ple. New recently developed portable and wearable
devices available on large scale better encouragecom-
plex vision substitution systems development.
Many investigations in the neural rehabilitation
domain suggest that sensory-deprived person’s abil-
ities involve connections with their damaged cerebral
areas due to the cerebral plasticity . Cerebral reorga-
nization studies involve developing auditory substitu-
tion systems (Mitchell T. V., 2007) and tactile sys-
tems (Bach-y Rita P., 2003; R. Valazquez and Main-
greaud, 2005). Non-invasive systems, the tactile-
vision substitution, propose to translate frontal im-
ages into tactile information.
In the vOICe (Meijer, 1992; Meijer, 1998) ap-
proach, the gray scale images are scanned from left to
right and then are translated into sound based on the
following rule: the pitch elevation is given by the po-
sition in the visual pattern, and the loudness is propor-
tional with the brightness, therefore white is played
loudly and black silently. Each column of a 64x64
image is rendered in about 10 ms and is represented
by a superposition of sinusoidal waves with ampli-
tudes depending on the luminance pixels.
The PSVA (Prosthesis for Substitution of Vision
by Audition) (Capelle C. and C., 1998; Arno P. and
C., 1999) is based on a raw model of the primary vi-
sual system with two resolution levels, one that cor-
responds to artificial central retina and one that corre-
sponds to simulated peripheral retina.
The way of rendering images to sound is similar
with the vOICe, but this approach is more musical us-
ing distinct sinusoidal for each pixel of the column.
Total image size is 124 pixels, 64 pixels (8x8) located
in the fovea area with higher resolution and the rest of
60 pixels are located in the peripheral artificial retina
with low resolution.
Our approach blends the features of the PSVA
with the well known vOICe system by playing more
musical the color images. Comparing the rendering
times, the vOICe takes one second to translate 4000
pixels, PSVA takes 18 seconds for 124 pixels and our
prototype renders 4096 pixels in only 4 seconds.
TheVibe (Auvray M., 2005) approach is another
implementation that converts images into sound pat-
terns. The basic components of the sound are sinu-
soidal produced by virtual placed sources. The sound
amplitude is dependent by the luminosity mean of the
pixels which corresponds to the receptive field. The
frequency and the inter-aural disparity are determined
by the center of the coordinates of the receptive field
pixels. The user hears a sum of all sounds produced
by all sources of the image.
The model of Cronly et al. (Cronly-Dillon J.,
1999) reduces the image information by some image
processing steps in order to include only the black
pixels. The pixels in a column define a chord, and the
horizontal lines are played sequentially as a melody.
The system is able to decompose complex images
and to obtain basic patterns (squares, circles, poly-
gons). Although the practical results demonstrate that
this model can obtain satisfactory mental images it re-
quires strong concentration of the tested persons.
Our approach has some similarities with the
vOICe system in the way of interpreting the intensity
values of the image pixels. Comparing with this ap-
proach, our system has a higher rendering resolution
by treating each pixel independently. Additionally,
our system is able to translate accurately the color
information of the images. Our system is also re-
lated with PSVA interpreting individual image pixels
in a similar way. However our approach reduces sig-
nificantly the playing time by adopting a polyphonic
technique and also a shorter timing of the playing du-
ration.
3 COLOR IMAGES
INTERPRETATION BY MUSIC
On the designing process of the vision substitution
system there are some initial assumptions on tailor-
ing the vision sensory over the sound sensory. These
constrains can increase the quality and the quantity
of the transferred information of the vision sensory.
Sound segregation capacity has some similar corre-
spondences with the scene analysis (Wilson and Keil,
1999). Experiments on auditory segregation (Breg-
man, 1990) showed that an alternate sequences of
high and low frequencies tones played at different
rates influence the segregation sensation. When the
stream is played at slower rate, the listener is able to
follow the entire sequence of tones. At higher rates,
the sequence splits into two streams, one high and
ColEnViSon: Color Enhanced Visual Sonifier - A Polyphonic Audio Texture and Salient Scene Analysis
567
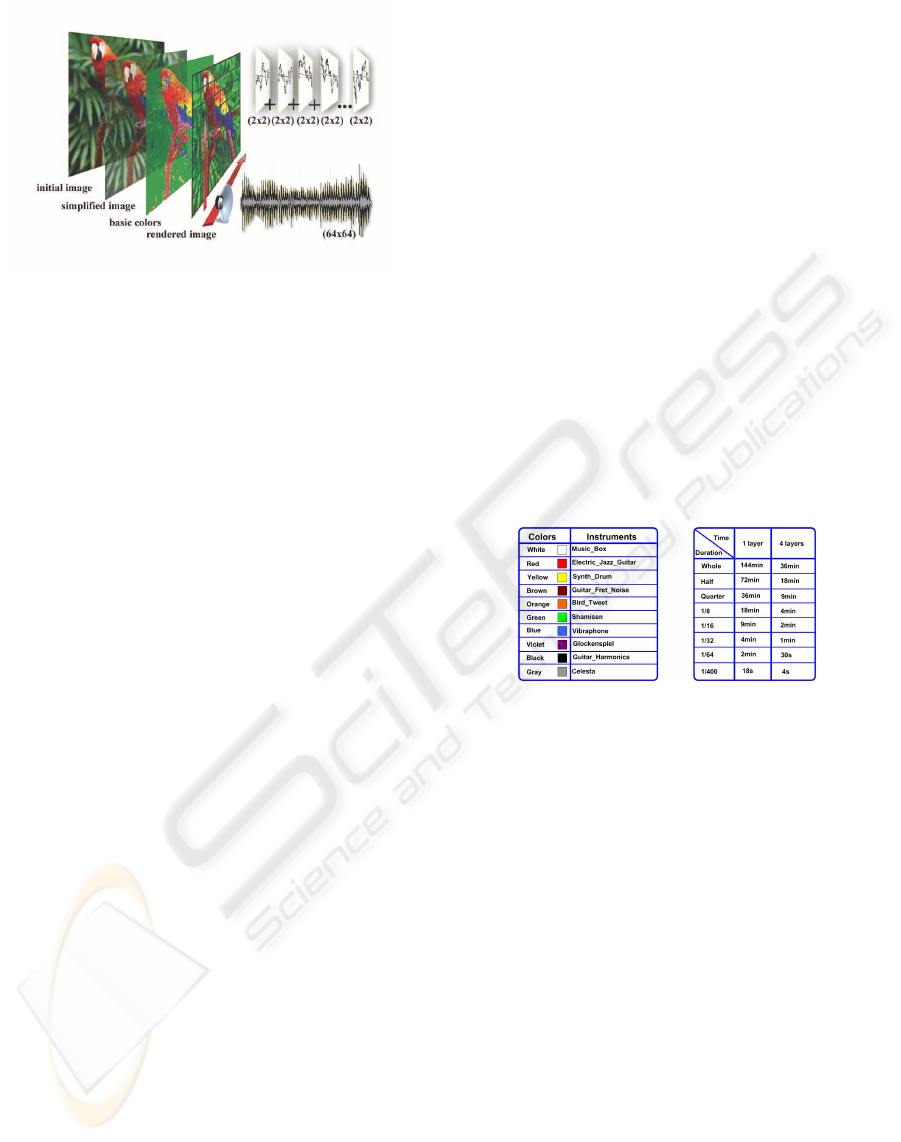
Figure 1: Overview of the system. First, we simplify the
color images by computing for each image pixel a cor-
responding value from a color dictionary. Based on the
color dictionary the basic color values are determined. The
brightness is blended with the basic colors of the image.
The image is scanned horizontally and the regions of 2x2
pixels are played in 4 separated musical layers.
one low pitch, being difficult to follow the entire se-
quences of tones. Auditory stream segregation related
with the sound frequencies seems to follow the char-
acteristics of apparent motion in human vision sys-
tems (Strybel T. Z., 1998).
3.1 Color Perception
Our system aims to facilitate the user to perform the
scene interpretation by itself. Considering both au-
ditory and vision features we intend to interpret the
cues content as distinctive as possible. We try to fo-
cus on the image color features in order to have more
expressive low level image components of particular
patterns. The system accomplish this task by identify-
ing the gamut color for each pixel and translating the
value into corresponding distinctive instrument tones.
The variation of the color tone is direct proportional
reflected on the variation of the instrument scale.
The color translation involves identifying in ad-
vance the color name. Brent and Kay (Brent and Kay,
1991) claim that all the mature human languages con-
tain eleven colors names: red, purple, pink, yellow,
brown, orange, green, blue, white, black and gray. In
our approach we reduce this color set to ten values by
replacing the purple and pink with violet. The main
motivation is because their relative lighter and darker
appearance can be confused with the perception of the
red color in some cases. Brown is also a color that can
be misclassified by orange or yellow, but we prefer
to keep it because the color appears frequently in the
natural scenes. Also violet is more perceptually dis-
tinctive than pink. Color perception is subjective due
to the many influences (e.g. light color, scene context,
material properties). Naming and identifying a color
is a learned skill, once we learned the basics, the sen-
sitivity to shades is individual. In gray scale images,
most of the visual attention that comes from the color
is lost. Also the shape identification is more distinc-
tive in color based transformation as the blending with
the background is reduced.
Similar approaches for color selection like
Berreta’s MettaPalette (Beretta, 1990) uses CIELAB
space to select harmonious color palettes.
In our preliminary tests we have tried the color
identification by simply applying hue constrains.
CIELch derived from CIELab (Fairchild, 2005) has
been chose because is more perceptually uniform than
HSV color space. After some experiments we came
to the conclusion that a more advanced mathemati-
cal model than simply using the hue as decision fac-
tor (Belpaeme, 2002) is needed. We classify our
color space by using the Universal Color Language
and Dictionary of Names (Kelly and Judd., 1976).
Each color sample is visually labeled with a more ap-
propriate corresponding value. To validate our selec-
tion different context images are transformed until a
satisfactory result was obtained.
Figure 2: The left side table presents the mapping between
the set of basic colors and the musical instruments. In the
right side are presented the rendering times for different
tempos and number of layers.
3.2 Music Encoding
Colors and instruments are used by centuries to evoke
emotions and powerful moods. Instrument’s timbre
or the sound color is a unique quality. The same note
played by different instruments has the same pitch but
distinctive timbre. With few practice, users can rec-
ognize instruments from an orchestra. This happens
because the attack at the beginning of the note is es-
sentially to identify the timbre, therefore it is relative
easy to identify particular instruments even for play-
ing short tempos.
Our algorithm scans every image column from left
to right and compiles the musical pattern by map-
ping the pixel color intensity into musical instruments
notes. We transform lighter intensities of the same
color into notes on higher scales of the same musical
instrument. The selection of the musical instruments
is relative subjective. In Figure 2 are shown the map-
VISAPP 2009 - International Conference on Computer Vision Theory and Applications
568
ping between the color and the musical instruments
that we have chosen.
In our experiments we played music patterns with
different durations (see Figure 2) and we observed
that by using polyphonic approach the quality of the
resulted sound is unessential compromised. We also
observed that patterns with the same color soundmore
distinctively and the repeatable small patterns sound
more pleasing avoiding the cacophony.
The scanning of the images is performed horizon-
tally. Our system is processing simultaneously a 2x2
pixels region by playing in 4 separated layers (chan-
nels). The luminosity information is rendered into
sound by vary the musical instruments among 10 oc-
taves.
For a 64x64 image as can be observed in the Fig-
ure 2 it is required an audition time of 17 seconds for
one layer and 4 seconds for four layers (channels).
4 IMAGE SIMPLIFICATION
Common modern digital image acquisition and dis-
play devices such as scanners and video digitizers
work with true-color images. These images con-
tain more than 16 millions of possible color varia-
tions and therefore are relative intractable to be stored
and transferred. Another inconvenienceappears when
true-color images are visualized on graphical devices
using CLUT (Color Lookup Table) that have a re-
duced number of concurrent displayable colors (e.g.
mobile phones).To overcome these drawbacks, some
kind of color quantization is required in order to re-
duce the amount of the information.
There has been much research on the color quan-
tization (Puzicha J., 2000; Gibson, 2001; Shyi-
Chyi Cheng, 2001). The process of color quantiza-
tion has the main disadvantage that implicates visual
artifacts. In general the color quantization is done by
separating the color space of the original images into
disjoint cells according to some criteria. The spatial
color quantization (Puzicha J., 2000) is one of the
well known methods. However due to the fact that it
fails to reduce a large number of colors and also due
to its expensive computation, that recommends to be
used mostly for offline processing, we adopt a simpler
strategy.
We opted to built our color image simplification
on the early work of Herbert (Heckbert, 1982). We
adapt this simple algorithm by using a reference color
dictionary. As mention so far, we use a small set of
instruments to render a 64x64 size color image. Ba-
sically, our algorithm tries to emulate the human per-
ception when translating the color image information
and afterwards to transform the values of the image
pixels into pleasing and distinctive musical sounds.
An important aspect is that the initial illumination
conditions are transferred in the final image, too (see
Figure 3).
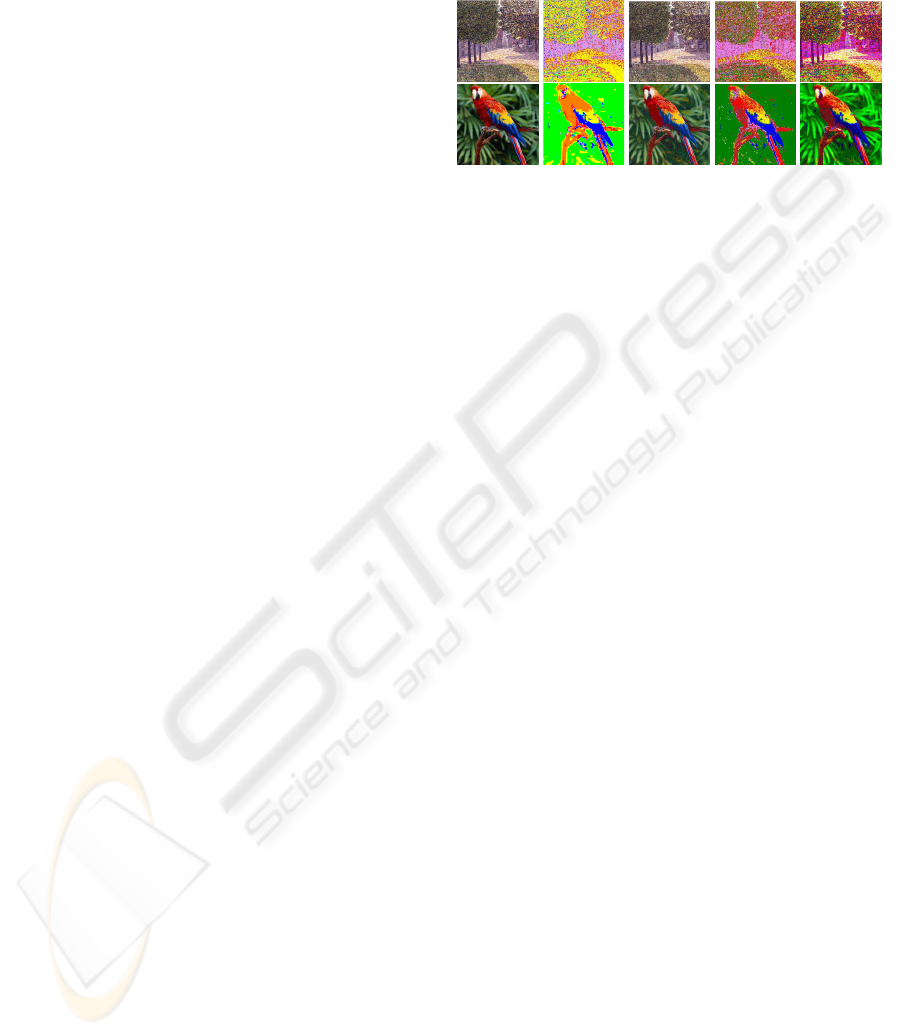
Figure 3: From left to right: Initial images, limitation of the
hue based approach, dictionary based simplification of the
initial images, basic colors, final rendered images (used in
our approach) after the intensity was blended with the basic
colors.
Additionally, our system includes a function of nam-
ing the color that can be very useful also for color
visual impaired users. However, the general expected
result is that a blind person to be able to name easily
the color by hearing the translated sound. To address
this problem a color classification scheme is needed
by our approach. We use the standard NBS/ISCC
(Kelly and Judd., 1976) dictionary of colors. This
dictionary defines 267 centroids in the color space, a
number enough to be easily learned but large enough
to make the distinctions needed for many applica-
tions.
First, each pixel in the original image is mapped
to its best corresponding value of the color-map. The
nearest-neighbor search method is applied for finding
the most representative color. This exhaustive search
(Heckbert, 1982) decides the matched color by mini-
mizing a metric distance (e.g. Euclidian). For small
saturation values we reduce the influence of the illu-
mination value by a tempering parameter. To speed
up the execution time we initially create a sorted color
vector that contains the entire dictionary, the separa-
tion information and the vector of pre-computed val-
ues. Finally, each pixel of the image is linked to the
corresponding component of the dictionary that has
been previously assigned visually to one of the 10 col-
ors of the basic set. Each instrument plays a variation
of ten octaves that emulates the color light intensity.
Some results obtained in our experiments are shown
in the Figure 3.
Our process does not perform any dithering in
order to not introduce additional illusionary col-
ors. Comparing with the classical color quantization
methods our approach does not impose a limit for the
number of the matching colors. The number of ba-
sic colors is equivalent with the number of instru-
ments and for more experienced users this number
can be increased by introducing several intermediate
ColEnViSon: Color Enhanced Visual Sonifier - A Polyphonic Audio Texture and Salient Scene Analysis
569
colors/instruments (e.g. Yellowish Green, Yellowish
Red).
50
100
150
200
250
300
50
100
150
200
250
300
50
100
150
200
250
300
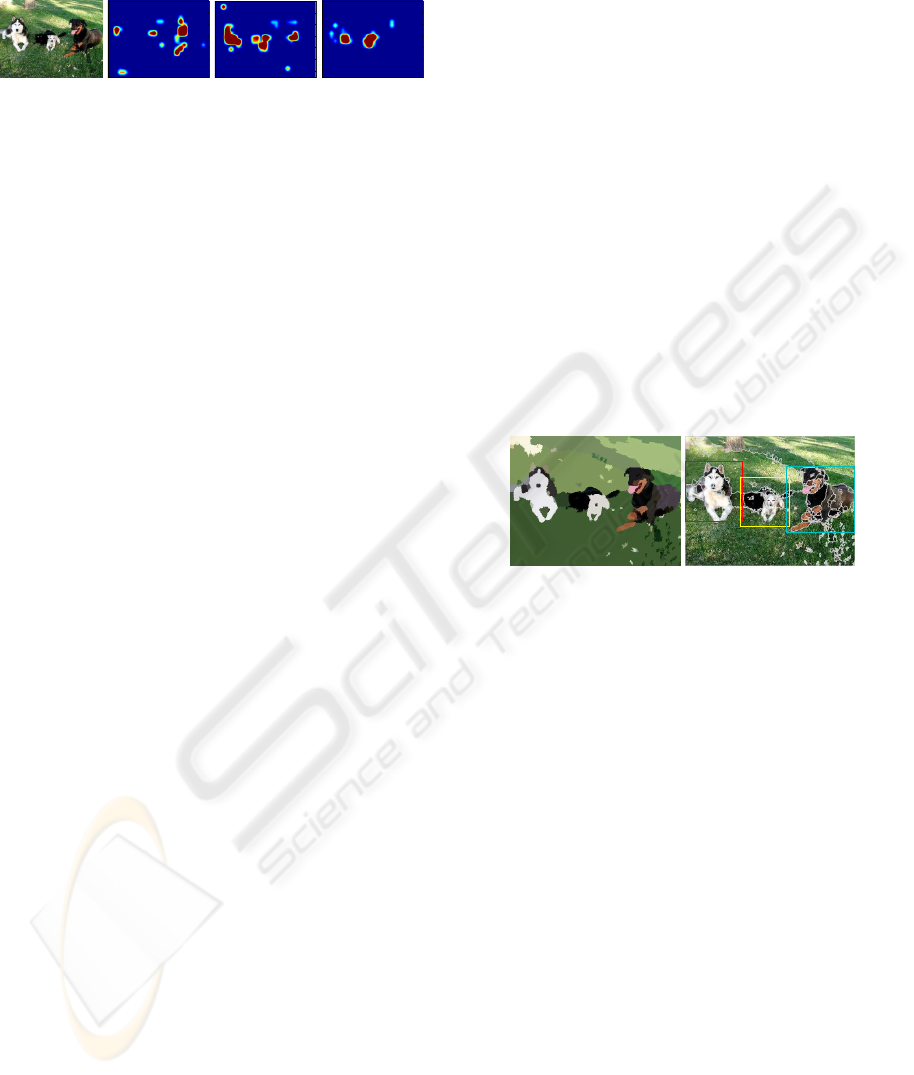
Figure 4: Salient maps. From left to right: initial im-
age, color salient map, intensity salient map and orientation
salient map.
5 IMAGE ATTENTION ANALYSIS
Digital images contains many details relative easy
to interpret by the human visual system. The naive
solution to translate directly into the sound the entire
image, may create confusions and misunderstandings
due to the important amount of the information
contained in the images. We propose a method
that emphasis only the important regions of the
images. What image regions are more important is
a relative topic that involved important research in
the recent years by the cognitive and computer vision
communities.
Human visual system is attracted differently
by the objects or parts of a given scene. Even if
for humans finding an particular object in a scene
is relative trivial for machines, with all the recent
progress, this still represents a difficult task. When
examining an image, only certain objects are seen
as important. This way of perception of our visual
system requires good understanding of the image
semantics. An effective solution is to identify salient
region of a given image.
The main heuristic approach of visual saliency
originates from the early studies of Neisser (Neisser,
1964). His model consists in two main stages. Firstly
,in the pre-attentive stage, the local feature points of
the images are extracted. These filtered locations are
mainly characterized by irregularities of the image
contrast. Secondly, in the attentive stage, the feature
points are related and grouped by their properties.
In this paper we extract salient regions by an
hybrid approach that blends the computed salient
map with the global information of the images. First,
we identify and classify the most salient regions of
a given image. For this task we derive our model
from the approach of Itti et all (Itti and E., 1998).
Then, the images are simplified by a segmentation in
order that users to be able to comprehend the entire
meaningful region that was selected.
Saliency Model. We use a bottom-up attention sys-
tem based on the Itti et al. (Itti and E., 1998) ap-
proach. The system was extended recently (Walther
and Kochb, 2006) demonstrating good results for
modeling attention to proto objects. Our choice is
motivated by the biological plausible steps that are
embraced by this model. Three feature maps are ex-
tracted and blend in a final salient map (see Figure 4).
An image pyramid is built by convolving the image
with a Gaussian kernel and decimated by a factor of
two. For each pyramid level an averaging of the nor-
malized color channels values is performed in order
to obtained the intensity feature map. The color map
is computed from the RG and BY color opponencies.
This operation is relative similar with how human’s
retinal ganglion cells are processing the information.
Local orientation map is obtained by convolving
with oriented Gabor filters correspondingto four main
directions (0
◦
, 45
◦
, 90
◦
, 135
◦
). The Gabor filters are
associated with the functions of the neurons in the pri-
mary visual cortex.
Finally, a winner-take-all procedure is employed
for identifying the most salient image region (see the
right side of the Figure 5).
Figure 5: The left side picture displays the segmentation
result obtained after the mean shift method was employed.
In the right side of the figure is shown the original image
with the emphasized edges and also the most salient regions
(red, blue, yellow) extracted by our approach.
Refined Salient Region. Following the observation
that the extracted salient regions represent only a part
of the object that is focused, images need also to be
partitioned in meaningful regions. In general the ex-
tracted salient regions are not related with an entire
object contained by the image.
Image segmentation is a well studied topic. Se-
lecting the optimal segmentation may be a difficult
task. In general the searching space of possible pixel
groups is very large being essential to use a sub-
optimal search to make the problem more tractable.
We opted for the well known mean shift method that
provides a clean and robust formulation.
The technique was introduced by Comaniciu et al.
(Comaniciu and Meer, ; Comaniciu and Meer, 2002)
and has become probably the most widely-used tech-
nique in computer vision even if several recent studies
(Felzenszwalb and Huttenlocher, 2004; Wang et al.,
2004; Liu et al., 2008) attempt to improve it. Mean
shift segmentation is mathematically related with the
bilateral filtering (Tomasi and Manduchi, ) and con-
sists in two main steps. First, in the filtering stage,
VISAPP 2009 - International Conference on Computer Vision Theory and Applications
570
the image information is smoothed but conserving
the boundaries between regions. Second, the filtered
points are clustered by a single linkage clustering.
In our experiments the two parameters values corre-
sponding to the radius of the kernel for the spatial and
color features are set to 7 and 15, respectively.
After segmentation (see Figure 5), the selected
squared image region needs to include all the im-
age segments that overlaps the winning salient region.
Due to the fact that our system renders images of
64x64 size, larger images or larger salient regions are
downsampled in order to be compatible with the sys-
tem requirements.
6 DISCUSSION AND RESULTS
As was presented, our system renders color images of
64x64 size into sound patterns that are played by a
set of musical instruments. After the salient regions
are extracted, the color images are simplified by com-
pressing the color space using a predefined color dic-
tionary. The image is scanned horizontally and the
algorithm is processing regions of 2x2 pixels playing
4 separated music layers. The brightness information
is rendered into sound by varying the octaves of the
musical instruments.
In this early stage of our prototype we propose
a simple validation procedure comparing the results
of our system with the well known vOICe (Meijer,
1992) system. Validation of a vision-sound system is
not a trivial task and in general needs long training
periods in order that users to accustom to the system
functionalities and reactions. Experience and learning
are two main characteristics that allow human beings
to assimilate and understand the information from the
environment.
The test consists in verifying the ability of the vol-
unteers to recognize and to associate basic image fea-
tures of a given database representing the audio trans-
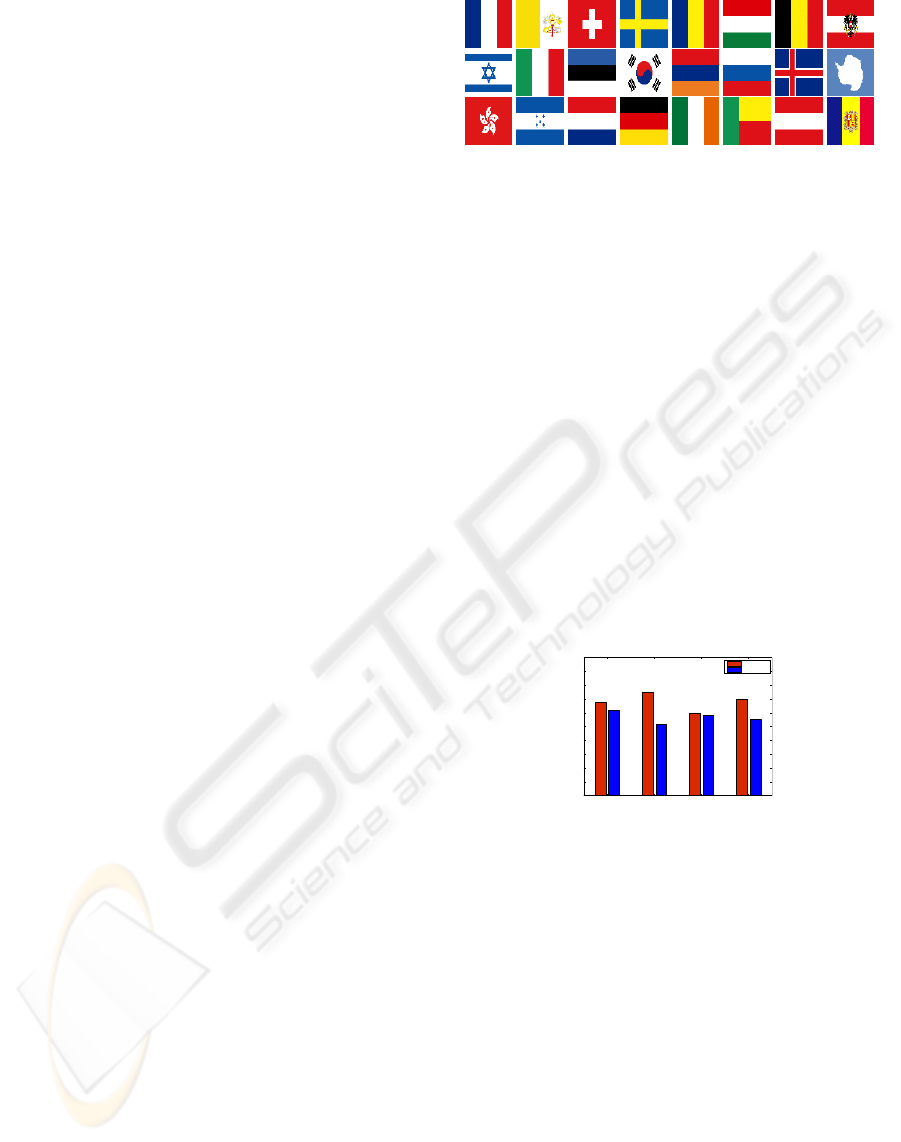
lation of several color images. Our database contains
color images of 24 different national flags (see Fig-
ure 6).Each participant had a training period of 30
minutes to get used with the responses of the systems
when images from the database are processed individ-
ually. Afterwards, a number of ten images have been
randomly selected. For each selected flag the volun-
teer was asked to listen the translation into sound and
then to answer to several questions. The questionnaire
contains the following questions:
Q1: Does the flag contain vertical and/or horizontal
color stripes?
Q2: How many distinct colors can be recognized?
Q3: Does the flag contain a national coat of arms?
Q4: Given a reference color pattern and its audio
Figure 6: 64x64 images of different national flags analyzed
in our experiments.
translation, does this color appear in the selected flag
image?
Four volunteers have been asked to fill the question-
naire. One of the volunteer was a researcher but from
a non-IT area. Two were undergraduate students and
one was aged 50-60 years.
The Figure 7 presents the averaged results ob-
tained after every volunteer answered to every ques-
tion. For the first and the third questions the results of
the both systems are relative similar because the color
does not play an important role. On the other hand, as
we expected, the results for the second and the fourth
questions our system performs clearly better than the
vOICe system. Even if without long training periods
of the users the conclusions are relative subjective,
the obtained results are encouraging and we believe
that our system has a high potential to transfer opti-
mally the color information into pleasing and distinc-
tive sound frequencies.
1 2 3 4
0
0.1
0.2
0.3
0.4
0.5
0.6
0.7
0.8
0.9
1
Question number
Answer correctness (%)
Our system
vOICe
Figure 7: Comparative results between our system and
vOICe obtained after volunteers answered the question-
naire.
7 CONCLUSIONS
In this paper we introduced a system that assists visu-
ally impaired people to detect cues in the color images
by sound translation. The system has a bottom-up ap-
proach that identifies and focuses salient regions that
are interpreted into polyphonic sounds generated by
musical instruments.
Comparing with existing approaches, our system
emphasis the user perception over the general image
content. The basic elements are played separately in
distinctive patterns and the color associated with the
musical instruments produces more pleasing and dis-
tinctive sounds than previous approaches. An addi-
tional important feature of our system is that the play-
ColEnViSon: Color Enhanced Visual Sonifier - A Polyphonic Audio Texture and Salient Scene Analysis
571

ing time is significantly reduced by using polyphonic
approach while still preserving the image details.
Future work will aim at optimizing the code for ad-
ditional speed up for mobile devices (e.g. PDA). Ad-
ditional work is required to determine the optimal se-
lection of the musical instruments.
REFERENCES
Arno P., Capelle C., W. D. M. C. A. M. and C., V. (1999).
Auditory coding of visual patterns for the blind. In
Perception, volume 28(8), pages 1013–1029.
Auvray M., Hanneton S., L. C. (2005). There is some-
thing out there: distal attribution in sensory substitu-
tion, twenty years later. Journal of Integrative Neuro-
science, 4:505–521.
Bach-y Rita P., Collins C., S. F. W. B. S. L. (1969). Visual
substitution by tactile image projection. In Nature,
volume 221, pages 963–964.
Bach-y Rita P., S. W. K. (2003). Sensory substitution and
the human-machine interface. Trends in Cognitive Sci-
ences, 7(12):541–546.
Belpaeme, T. (2002). Factors influencing the origins of
color categories. PhD Thesis, Artificial Intelligence
Lab, Vrije Universiteit Brussel.
Beretta, G. (1990). Color palette selection tools. The Soci-
ety for Imaging Science and Technology.
Bregman, A. (1990). Auditory scene analysis. MIT Press,
Cambridge, MA.
Brent, B. and Kay, P. (1991). Basic color terms: their uni-
versality and evolution. Berkeley: University of Cali-
fornia Press.
Capelle C., Trullemans C., A. P. and C., V. (1998).
A real-time experimental prototype for enhance-
ment of vision rehabilitation using auditory substitu-
tion. IEEE Transactions on Biomedical Engineering,
45(10):1279–1293.
Clifford, C.W.G., H. A. P. J. (2004). Rapid global form
binding with loss of associated colors. Journal of Vi-
sion, 4:1090–1101.
Comaniciu, D. and Meer, P. Robust analysis of feature
spaces: color image segmentation. In In Proc of Com-
puter Vision and Pattern Recognition (CVPR ’97).
Comaniciu, D. and Meer, P. (2002). Mean shift: A robust
approach toward feature space analysis. IEEE Trans.
Pattern Anal. Mach. Intell., 24(5):603–619.
Cronly-Dillon J., Persaud K., G. R. (1999). The perception
of visual images encoded in musical form: a study
in cross-modality information. Biological Sciences,
pages 2427–2433.
Fairchild, M. D. (2005). Color appearance models, 2nd ed.
Felzenszwalb, P. F. and Huttenlocher, D. P. (2004). Efficient
graph-based image segmentation. Int. J. Comput. Vi-
sion, 59(2):167–181.
Fine, I., M. D. B. G. Surface segmentation based on the lu-
minance and color statistics of natural scenes. Journal
of the Optical Society of America (2003).
Gibson, S. Harvey, R. (2001). Morphological color quanti-
zation. Proc IEEE Conf. on Comp. Vision and Pattern
Recog.
Heckbert, P. S. (1982). Color image quantization for frame
buffer display. ACM SIGGRAPH.
Itti, L., K. C. and E., N. (1998). A model of saliency-based
visual attention for rapid scene analysis. IEEE Trans-
actions on Pattern Analysis and Machine Intelligence
(PAMI), 20(11):1254–1259.
Kelly, K. L. and Judd., D. B. (1976). Color: Universal lan-
guage and dictionary of names. National Bureau of
Standards, Spec. Publ. 440.
Liu, T., Zhou, H., Lin, F., Pang, Y., and Wu, J. (2008). Im-
proving image segmentation by gradient vector flow
and mean shift. Pattern Recogn. Lett., 29(1):90–95.
Meijer, P. (1992). An experimental system for auditory im-
age representations. IEEE Transactions on Biomedi-
cal Engineering, 39(2):112–121.
Meijer, P. (1998). Cross-modal sensory streams. In Confer-
ence Abstracts and Applications, ACM SIGGRAPH.
Mitchell T. V., M. M. T. (2007). How vision matters for
individuals with hearing loss. In Informa Healthcare,
volume 46(9), pages 1499–2027.
Neisser, U. (1964). Visual search. Scientific American,
210(6):94–102.
Puzicha J., Held M., K. J. B. J. F. D. (2000). On spatial
quantization of color images. IEEE Transactions on
Image Processing, 9(4):666–682.
R. Valazquez, E. E. Pissaloux, J. C. G. and Maingreaud,
F. (2005). Walking using touch:design and prelimi-
nary prototype of a noninvasive eta for the visually
impaired. In in Proceedings of the the Medicine and
Biology 27th Annual Conference.
Rossion, B., P. G. (2004). Revisiting snodgrass and van-
derwarts object pictorial set: The role of surface detail
in basic-level object recognition. Perception, 33:217–
236.
Shyi-Chyi Cheng, C.-K. Y. (2001). A fast and novel tech-
nique for color quantization using reduction of color
space dimensionality. Pattern Recognition Letters,
22(8):845–856.
Strybel T. Z., M. M. L. (1998). Auditory apparent motion
between sine waves differing in frequency. Percep-
tion, 27(4):483–495.
Tomasi, C. and Manduchi, R. Bilateral filtering for gray and
color images. In In IEEE ICCV ’98.
Walther, D. and Kochb, C. (2006). Modeling attention
to salient proto-objects. Neural Networks, 19:1395–
1407.
Wang, J., Thiesson, B., Xu, Y., and Cohen, M. F. (2004).
Image and video segmentation by anisotropic kernel
mean shift.
Wilson, R. A. and Keil, F. C. (1999). The mit encyclopedia
of the cognitive sciences. Cerebral Cortex: Top-Down
Processing in Vision.
VISAPP 2009 - International Conference on Computer Vision Theory and Applications
572
