
DETECTING RECTANGULAR OBJECTS IN URBAN IMAGERY
A Re-Segmentation Approach
Thales Sehn Korting, Luciano Vieira Dutra and Leila Maria Garcia Fonseca
National Institute for Space Research (INPE) – Image Processing Division
Av. dos Astronautas, 1758 – São José dos Campos, Brazil
Keywords:
Re-Segmentation, Graph-Based Segmentation, Remote Sensing, Urban Imagery.
Abstract:
Image segmentation is a broad area, which covers strategies for splitting one input image into its components.
This paper aims to present a re-segmentation approach applied to urban imagery, where the interest elements
(houses roofs) are considered to have a rectangular shape. Our technique finds and generates rectangular
objects, leaving the remaining objects as background. With an over-segmented image we connect adjacent
objects in a graph structure, known as Region Adjacency Graph – RAG. We then go into the graph, searching
for best cuts that may result in segments more rectangular, in a relaxation-like approach. Graph search consid-
ers information about object class, through a pre-classification stage using Self-Organizing Maps algorithm.
Results show that the method was able to find rectangular elements, according user-defined parameters, such
as maximum levels of graph searching and minimum degree of rectangularity for interest objects.
1 INTRODUCTION
Image segmentation remains a great challenge in dig-
ital image processing tasks. From segmentation many
other interpretation tasks are performed, which im-
plies a certain responsibility over the segmentation al-
gorithms. Several approaches have been already pro-
posed in the literature, each one covering one spe-
cific area of interest. A simple definition was made
by (Haralick and Shapiro, 1985), “a good segmenta-
tion of a image should separate the image into simple
regions with homogeneous behavior”.
Segmentation is a broad area, covering strategies
for splitting one input image into its components, con-
cerning one specific context. This context also in-
cludes aspects of scale, because the image compo-
nents start with a single pixel, however they can be
merged to generate objects with a meaning. The main
tasks covered by any segmentation are to extract the
image objects and produce good results according a
set of parameters, also being computationally effi-
cient.
Considering personal photographs, the algorithm
can segment each face present in the picture, or ex-
tract the background and stress the objects of interest,
such as cars (Roller et al., 1993; Leibe et al., 2004),
constructions, people (Li et al., 2005; Feris et al.,
2004), etc. In the remote sensing area, which is the
main application of the presented approach, segmen-
tation should generate objects according to the targets
of one satellite image, such as roofs (Chesnel et al.,
2007), streets (He et al., 2004) and trees in an urban
image, for example. In other remote sensing areas, as
agriculture (Pérez et al., 2000), the algorithm should
extract targets such as different crops, or deforested
areas (Silva et al., 2005), to differentiate land uses by
classification processes.
This paper considers segmentation applied to ur-
ban imagery, where the interest elements (houses
roofs) are considered to have a rectangular shape in
most of the cases. The implemented algorithm aims
to find and generate rectangular objects as foreground,
leaving the rest objects as background. For this, we
firstly create an over-segmented image and connect
adjacent objects in a graph structure, known as Re-
gion Adjacency Graph – RAG (Schettini, 1993). We
then go into the graph, searching for best cuts that
may result in segments more adequate to our context.
RAG also considers information about object class, in
a pre-classification stage that is explained further.
Next Section we discuss general image segmen-
tation and graph-based approaches. In Section 3 we
present the re-segmentation technique, followed by
Results and Discussion in Section 4. In Section 5 we
conclude.
231
Sehn Korting T., Vieira Dutra L. and Garcia Fonseca L. (2009).
DETECTING RECTANGULAR OBJECTS IN URBAN IMAGERY - A Re-Segmentation Approach.
In Proceedings of the Fourth International Conference on Computer Vision Theory and Applications, pages 231-236
DOI: 10.5220/0001806702310236
Copyright
c
SciTePress
2 GRAPH-BASED
SEGMENTATION
The area of image segmentation can be split into two
main classes, namely pixel oriented and object ori-
ented. The first one considers each pixel of the image
as one graph node, whereas in the second nodes are
over-segmented objects, with edges on their neigh-
bors, i.e. objects that applies the topological relation
“touch” (Egenhofer and Franzosa, 1991). The nota-
tion G = (V, E) stands for a graph G with a set of
nodes v
i
, and the set of connections is stored in E
(Felzenszwalb and Huttenlocher, 2004). According
the segmentation class, nodes will be pixels or ob-
jects. According to (Borenstein et al., 2004), image
segmentation with top-down approach is guided by a
stored representation of the shape of objects within a
general class. Furthermore, the so called bottom-up
approach uses image-based criteria to define coherent
groups of pixels that are likely to belong together (ei-
ther foreground or background objects).
(Zahn, 1971) firstly proposed the approach of ap-
plying graph cuts into the Minimum Spanning Tree
(MST), generated from the pixel based graph, where
edge weights were based on the differences between
pixel intensities. Graph cuts were applied in edges
with larger weights. How large should be the edges
is a user-defined threshold. However, depending on
the threshold, simply breaking may result in the high
variability region being split into multiple regions.
About urban segmentation, the work from
(Benediktsson et al., 2003) presents one hybrid ap-
proach, through morphological operations applied to
panchromatic images with high spectral and spatial
resolutions. After morphology, a neural network is
applied to classify extracted features from resultant
elements.
According to (Donnay et al., 2001), the urban-
ist and the remote sensing specialist have much to
gain through collaboration on spatial pattern analy-
sis, using texture indices and measures or local het-
erogeneity, as well as morphological transformations
and fractal analysis. However, urban areas are by
their very nature complex. Although a human op-
erator can extract information from images of urban
areas relatively easily, computer-based automated in-
terpretation is a challenging task. (Cinque et al.,
2004) used the re-segmentation approach for image
retrieval, where an user-defined rectangle defined the
interest region. After this, an over-segmentation was
performed into this region and such objects were com-
pared to “coarse” descriptions of image references.
Our approach is another graph-based approach,
however it presents novel methods for finding rect-
angular objects, present in urban imagery, mainly in
houses roofs. Through a pre-classification step, the
method searches over graph nodes for best merging
operations in the interest objects and also with back-
ground neighbors which may improve the resultant
shape. Next Section describes the full process in de-
tail.
3 RE-SEGMENTATION
Our approach is called re-segmentation since it gets
by input a previously over-segmented image, in gen-
eral using traditional methods, such as watershed or
region growing (Duarte et al., 2006; Felzenszwalb
and Huttenlocher, 2004; Tremeau and Colantoni,
2000). Input is composed by the image pixels and
a set of regions, each one connected to its neigh-
bors. Such connections are stored in the graph struc-
ture called RAG, and the distance between nodes,
also called weights, are defined as some difference of
their attributes. The way nodes are joined, or not, is
the main characteristic of every re-segmentation ap-
proach.
3.1 Region Adjacency Graph – RAG
A Region Adjacency Graph is a data structure which
provides spatial view of an image. One way to un-
derstand the RAG structure is to associate a vertex at
each region and an edge at each pair of adjacent re-
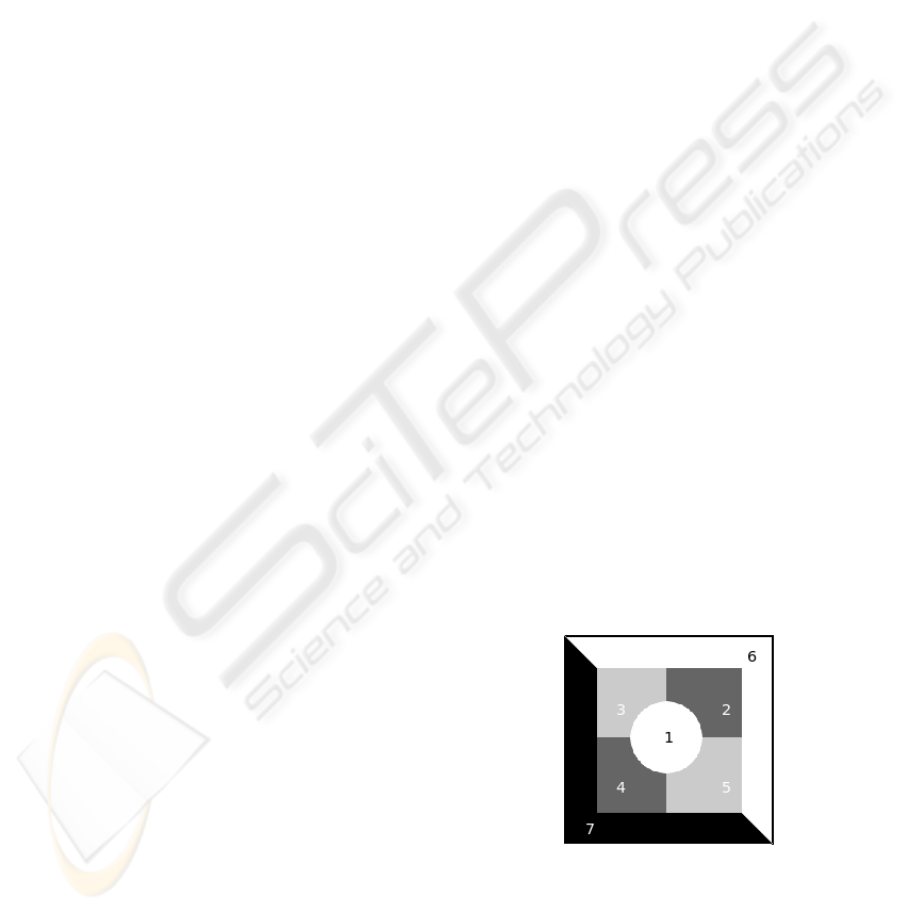
gions (Tremeau and Colantoni, 2000). Figure 1 de-
picts an example image and Table 1 shows the graph
weights, in this case using the difference between
spectral means of each region.
Figure 1: RAG example – Image with 7 regions.
We propose a novel merging strategy in the RAG
structure. The regions are merged if they are similar in
respect to their spectral attributes (mean, variance or
texture, for instance) and if the resultant shape (after
merging operation) is rectangular. To carry out this
VISAPP 2009 - International Conference on Computer Vision Theory and Applications
232
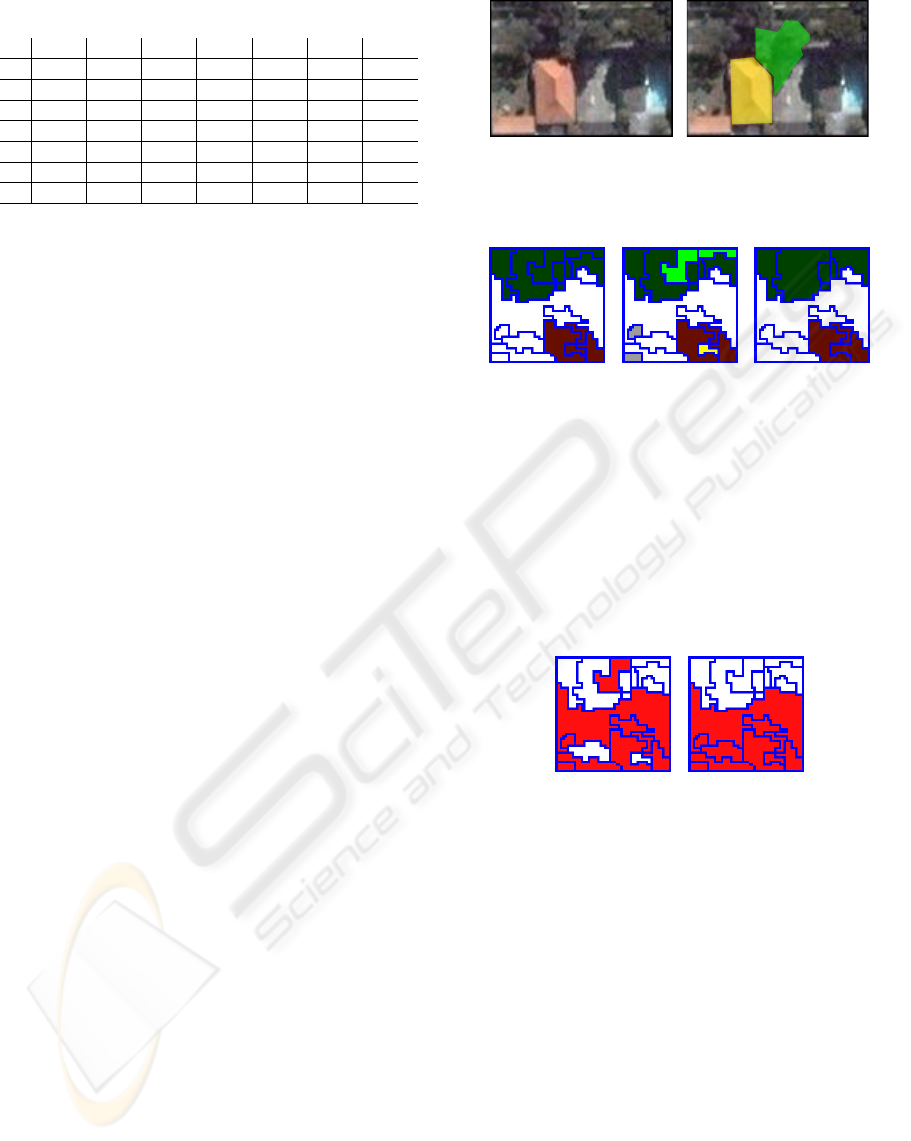
Table 1: Graph generated from Figure 1.
1 2 3 4 5 6 7
1 -1 265.8 89.4 265.8 89.4 -1 -1
2 265.8 -1 176.4 -1 176.4 265.8 -1
3 89.3 176.4 -1 176.4 -1 89.4 351.7
4 265.8 -1 176.4 -1 176.4 -1 175.3
5 89.4 176.4 -1 176.4 -1 89.4 351.7
6 -1 265.8 89.4 -1 89.4 -1 441.1
7 -1 -1 351.7 175.3 351.7 441.1 -1
task the regions are divided according their contex-
tual classes. In the case of urban environment, classes
shall be buildings, streets, trees, and so on. Therefore,
regions are classified and one RAG is built, connect-
ing adjacent regions and storing the information about
their class. Afterwards, the algorithm performs graph
search and merge operations for the interest class,
classified as foreground, in our case the urban roofs.
The knowledge about the regions class improves the
segmentation accuracy because each class has a spe-
cific shape rectangularity measure. As already said,
the main purpose of this work is the segmentation of
rectangular objects, as roofs or buildings in urban im-
agery. All other kinds of objects are dealt as back-
ground.
3.2 Graph Pre-Processing
Three main steps are done in the pre-processing stage.
The first performs a classification on every over-
segmented element. Such classification aims to dis-
tinguish elements to be processed as the interest class
(foreground), and the remaining regions, which be-
longs to other classes, like trees, water bodies and
so on (background). All the elements classified as
background will be used to fit a rectangle in the over-
segmented regions classified as foreground. This can
be explained by the fact that, for example, a tree may
omit the rectangular shape of a roof, since it can be in
the top of it, as showed in Figure 2. The classification
step uses the unsupervised algorithm of Self Organiz-
ing Maps – SOM (Kohonen, 2001), which generates
clusters of regions as output. The resultant classes
are then compared to a reference set of roofs, and the
most similar class is than associated to it.
After the classification, redundant information is
removed to decrease time processing in the graph
search. Now the second step of pre-processing is per-
formed. It aims to join regions surrounded only by
elements of its same class, since in the graph search
they would certainly be merged. This means that if a
region has the same class as all its first order neigh-
bors, this region is merged to one of them. Figure 3
shows the result of this step.
(a) (b)
Figure 2: A tree in the top of a roof: a) original image and
b) highlighted objects.
(a) (b) (c)
Figure 3: First step of graph pre-processing: a) original im-
age, b) highlighted regions and c) resultant regions.
Finally the algorithm removes possible misclassi-
fication results. If the considered region belongs to a
different class from its neighbors, its class is changed
to the same as its neighbors, merging it to one of then,
as shown in Figure 4. As in this case as in the pre-
vious, the merge is performed to a randomly chosen
element.
(a) (b)
Figure 4: Second step of graph pre-processing: a) original
image and b) resultant regions.
3.3 Graph Search
At this stage we have a topological description of the
over-segmentation. Now the algorithm may choose
one region of interest (derived from pre-classification)
and perform a graph search in a pre-defined level of
neighbors. This level is an user-defined parameter,
since the user shall know the over-segmentation level,
i.e. the amount of regions that may suffice the re-
segmentation of rectangular shapes. This level stands
for the order of connection, considering the graph the-
ory. This means that neighbors of first order are the
ones that touch the considered region, neighbors of
second order are the neighbors of these first order el-
ements, and so on. We also define each level as graph
depth. Figure 5 shows one example of a segment
DETECTING RECTANGULAR OBJECTS IN URBAN IMAGERY - A Re-Segmentation Approach
233
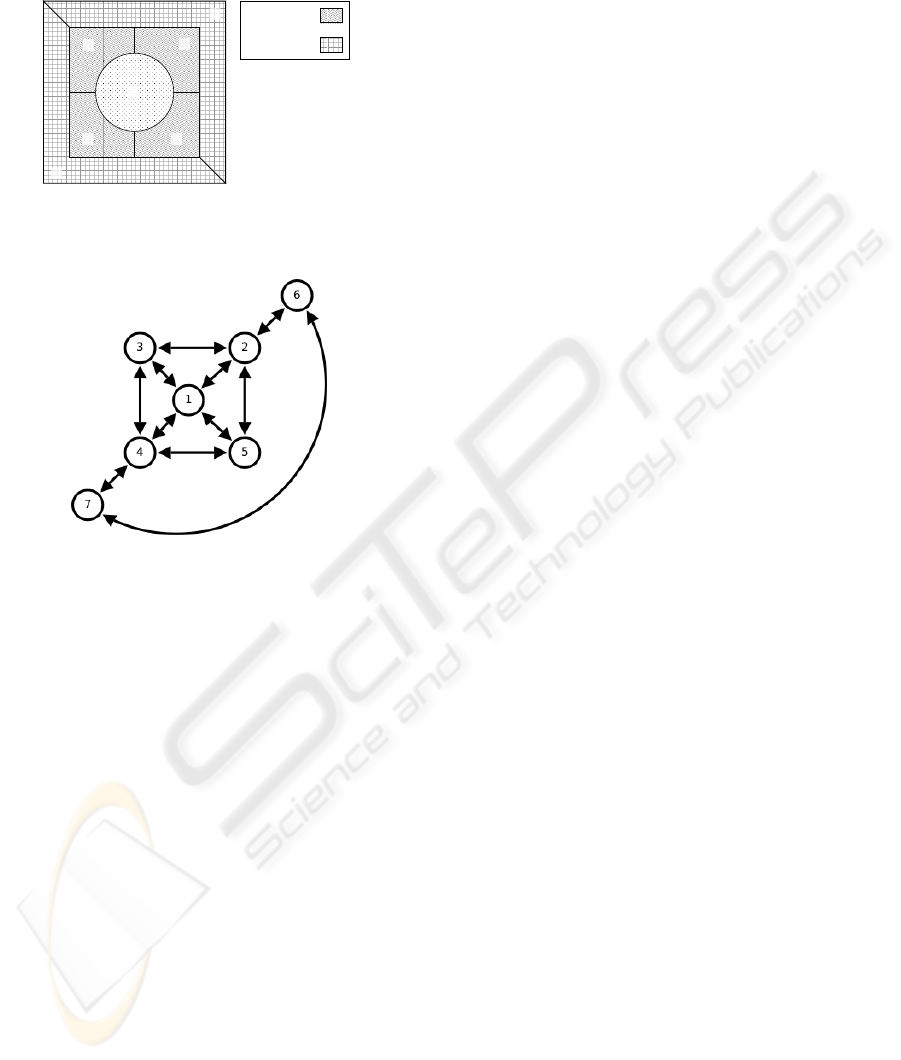
and its multiple level neighbors. Figure 6 depicts the
graph for easy understanding.
1
st
order
2
nd
order
1
2
3
4
5
6
7
Figure 5: Multiple level neighbors from element #1.
Figure 6: Graph structure generated with Figure 5.
The algorithm, after gathering multiple level
neighbors from one interest region, tries to perform
merging operations with a subset of this group, in or-
der to find rectangular objects, that will be classified
as foreground. Firstly, our approach merges regions
from the same class and then tries to merge regions
from background that should help to fit a rectangular
shape.
An important consideration about background re-
gions must be done. Regions will only be candidate
for merging if they have a smaller area (a certain per-
centage, as 20% or 30% for example) than the con-
sidered region, because regions from background will
often be used to fit the rectangular edges of our in-
terest objects, as the example of Figure 2a. So this is
another user-defined parameter, that aims to avoid bad
attempts from the algorithm, which takes time and de-
crease the resultant accuracy.
3.4 Rectangle Fitting
Our approach for rectangle fitting is based on (Kort-
ing et al., 2008), where the author proposes one shape
attribute Q → [0, 1] called Rectangularity, which is
obtained by the ratio between one object area and
its bounding box area. However, due to rotation this
measure can not correctly represent the object rectan-
gularity, unless a pre-processing step is performed to
transform Rectangularity invariant to rotation.
Given an object and its internal points coordinates,
the eigenvectors are calculated. The first eigenvector
shows the object’s main angle. Then a new object is
created by rotating it in relation to this main angle.
Afterward, the unbiased Q is obtained by dividing the
object area and the area of its rotated bounding box.
This value is used for inspecting each alternative for
merging regions. The closer to 1 is Q, the more rect-
angular it is, i.e. an object with Q ≈ 1 is a best candi-
date for re-segmentation.
3.5 Re-Segmentation Summary
To summarize our approach, we show in the Fig-
ure 7 a diagram composed by the main steps of re-
segmentation. It starts from a single image over-
segmented, going through classification using SOM,
which divides the regions in two main groups, namely
foreground (interest) and background regions, used to
fit a rectangle of the interest class. After classifica-
tion, the RAG is created and filtered, so that redun-
dant regions are already merged. The last step per-
forms merging of all connected regions with the in-
terest class and calculates their rectangularity, insert-
ing regions from background only if they increase the
overall rectangularity. After this last step, the final
region is compared to a threshold of minimum rect-
angularity (user-provided) to be considered, or not, a
re-segmentation result.
4 RESULTS AND DISCUSSION
In this section we discuss some results of our algo-
rithm. In the first experiment, we use different depth
levels for graph search in a synthetic image with a ro-
tated rectangle composed by several sub-regions, as
shown in Figure 8a. Figure 8b shows the input over-
segmentation and Figures 8c and 8d displays the re-
sultant re-segmentation with levels of #1 and #2, re-
spectively. We can perceive that in the first level the
algorithm isn’t able to reach all regions, however the
resultant segments keep a rectangular shape. With 2
levels, the algorithm is capable of gathering all re-
gions and gives the correct region.
The second result was obtained in a real remote
sensing urban image, where two roofs contain the
rectangular shape and one has an irregular shape, due
to image crop. Figure 9 shows the re-segmentation
results with different levels of graph search. We can
VISAPP 2009 - International Conference on Computer Vision Theory and Applications
234
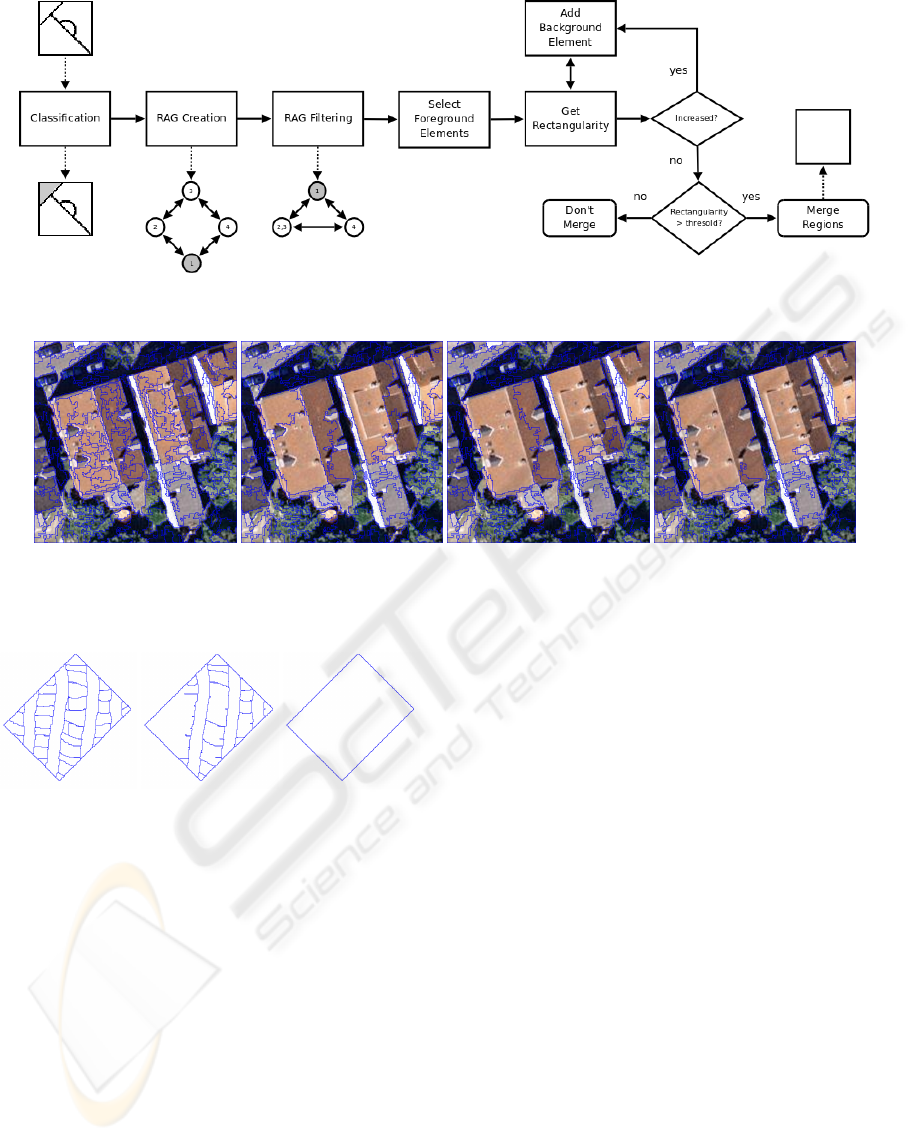
Figure 7: The re-segmentation algorithm summary. Inputs/Outputs are represented by dashed arrows.
(a) (b) (c) (d)
Figure 9: Urban Re-Segmentation: a) over-segmentation, (b, c, d) re-segmentation with 1, 2 and 3 levels respectively.
(a) (b) (c)
Figure 8: Re-Segmentation of a synthetic image: a) over-
segmentation, b) re-segmentation with 1 level of graph
search and c) re-segmentation with 2 levels.
perceive that due to the huge amount of segments,
just the result with 3 levels could find the rectangu-
lar shapes for a good match. However, the result us-
ing 3 levels still presents some mistakes, that can be
fixed using a post-processing stage. This stage, which
is not currently implemented, can perform morpho-
logical operations in the resultant region, and through
one erosion can extract some small edges incorrectly
re-segmented, followed by one dilation, used for best
fitting the rectangle.
5 CONCLUSIONS
One approach for re-segmentation of rectangular
shapes was presented. In this case, it was employed
to urban imagery, detecting roofs, which present an
rectangular aspect. It is important to point out that
such re-segmentation approach can go beyond rectan-
gular shape, just by replacing the step of Rectangle
Fitting (shown in Subsection 3.4) by any other fea-
ture detector, such as circular for example. The re-
sults obtained prove that a segmentation joined with a
classification step can increase the accuracy, since due
to simple parameters of traditional segmentation ap-
proaches sometimes the output regions do not present
good visual results. Some mistakes obtained by re-
segmentation can be fixed, as already said, by post-
processing techniques, like morphological operators
in the resultant foreground regions. Through erosion
and dilation the results will get a smoother appear-
ance, removing from it small edges merged by mis-
take.
The algorithm was developed using TerraLib li-
brary, available for free download at http://www.
terralib.org/. Even with the inclusion of ap-
proaches to reduce time processing, such as graph
pre-processing stages, future works include optimiz-
DETECTING RECTANGULAR OBJECTS IN URBAN IMAGERY - A Re-Segmentation Approach
235

ing the whole strategy, with more strategies for fast
data processing.
REFERENCES
Benediktsson, J., Pesaresi, M., and Amason, K. (2003).
Classification and feature extraction for remote sens-
ing images from urban areas based on morphologi-
cal transformations. Geoscience and Remote Sensing,
IEEE Transactions on, 41(9 Part 1):1940–1949.
Borenstein, E., Sharon, E., and Ullman, S. (2004). Com-
bining Top-Down and Bottom-Up Segmentation. In
Computer Vision and Pattern Recognition Workshop,
2004 Conference on, pages 46–46.
Chesnel, A.-L., Binet, R., and Wald, L. (2007). Object ori-
ented assessment of damage due to natural disaster us-
ing very high resolution images. Geoscience and Re-
mote Sensing Symposium, 2007. IGARSS 2007. IEEE
International, pages 3736–3739.
Cinque, L., De Rosa, F., Lecca, F., and Levialdi, S. (2004).
Image retrieval using resegmentation driven by query
rectangles. Image and Vision Computing, 22(1):15–
22.
Donnay, J., Barnsley, M., Longley, P., (ESF), E. S. F., and
GISDATA. (2001). Remote Sensing and Urban Anal-
ysis. Taylor & Francis.
Duarte, A., Sánchez, Á., Fernández, F., and Montemayor,
A. (2006). Improving image segmentation quality
through effective region merging using a hierarchi-
cal social metaheuristic. Pattern Recognition Letters,
27(11):1239–1251.
Egenhofer, M. and Franzosa, R. (1991). Point-set topolog-
ical spatial relations. International Journal of Geo-
graphical Information Science, 5(2):161–174.
Felzenszwalb, P. and Huttenlocher, D. (2004). Efficient
Graph-Based Image Segmentation. International
Journal of Computer Vision, 59(2):167–181.
Feris, R., Krueger, V., and Cesar, R. (2004). A wavelet
subspace method for real-time face tracking. Real-
Time Imaging, 10(6):339–350.
Haralick, R. and Shapiro, L. (1985). Image segmentation
techniques. Computer vision, graphics, and image
processing, 29(1):100–132.
He, Y., Wang, H., and Zhang, B. (2004). Color-based road
detection in urban traffic scenes. Intelligent Trans-
portation Systems, IEEE Transactions on, 5(4):309–
318.
Kohonen, T. (2001). Self-Organizing Maps. Springer.
Korting, T. S., Fonseca, L. M. G., Dutra, L. V., and Silva,
F. C. (2008). Image Re-Segmentation – A New Ap-
proach Applied to Urban Imagery. pages 467–472.
Leibe, B., Leonardis, A., and Schiele, B. (2004). Combined
object categorization and segmentation with an im-
plicit shape model. In Workshop on Statistical Learn-
ing in Computer Vision, ECCV, pages 17–32.
Li, S., Jain, A., and service), S. O. (2005). Handbook of
Face Recognition. Springer.
Pérez, A., López, F., Benlloch, J., and Christensen, S.
(2000). Colour and shape analysis techniques for
weed detection in cereal fields. Computers and Elec-
tronics in Agriculture, 25(3):197–212.
Roller, D., Daniilidis, K., and Nagel, H. (1993). Model-
based object tracking in monocular image sequences
of road traffic scenes. International Journal of Com-
puter Vision, 10(3):257–281.
Schettini, R. (1993). A segmentation algorithm for color
images. Pattern Recognition Letters, 14(6):499–506.
Silva, M., Câmara, G., Souza, R., Valeriano, D., and Es-
cada, M. (2005). Mining Patterns of Change in Re-
mote Sensing Image Databases. In The Fifth IEEE
International Conference on Data Mining, New Or-
leans, Louisiana, USA.
Tremeau, A. and Colantoni, P. (2000). Regions adjacency
graph applied to color image segmentation. Image
Processing, IEEE Transactions on, 9(4):735–744.
Zahn, C. (1971). Graph-Theoretical Methods for Detect-
ing and Describing Gestalt Clusters. Transactions on
Computers, 100(20):68–86.
VISAPP 2009 - International Conference on Computer Vision Theory and Applications
236
