QUASI-BI-QUADRATIC INTERPOLATION FOR LUT
IMPLEMENTATION FOR LCD TV
Heebum Park, Guiwon Seo and Chulhee Lee
School of Electrical and Electronics Engineering,Yonsei University, Shinchon dong, Seoul, Korea Rep.
Keywords: LCD, LUT, Interpolation, Overdrive, Quadratic function.
Abstract: Overdriving schemes are used to improve the response time of LCD (Liquid Crystal Display). Typically
they are implemented by using LUT (Look-Up Table) within an image processor. However, the size of LUT
is limited by the physical memory size and system cost. In actual implementation of LUT, final overdriving
values are obtained using interpolation methods. However, interpolation errors may cause some display
artifacts and response time delay. In this paper, we present an improved method for LUT implementation
using linear interpolation and piecewise least-square polynomial regression to reduce such errors. The
proposed method improves LUT performance with reduced memory requirements.
1 INTRODUCTION
Recently, the demand for TFT LCD-TVs has
dramatically increased. TFT-LCD TVs have many
advantages including high resolution, light weight,
slim size and low power consumption. On the other
hand, there are also some problems such as slow
response time. Response time is very important for
LCD TVs since TV monitors need to properly
display moving pictures (Song et al., 2004). The
overdrive technique improves the response time of
TFT-LCDs by enlarging the desired change in the
pixel value to force LC materials (Wubben et al,
2004, Someya et al., 2003, Hartman et al., 1996, Lee
et al, 2001, K. Kawabe and T.Furuhashi, 2001). A
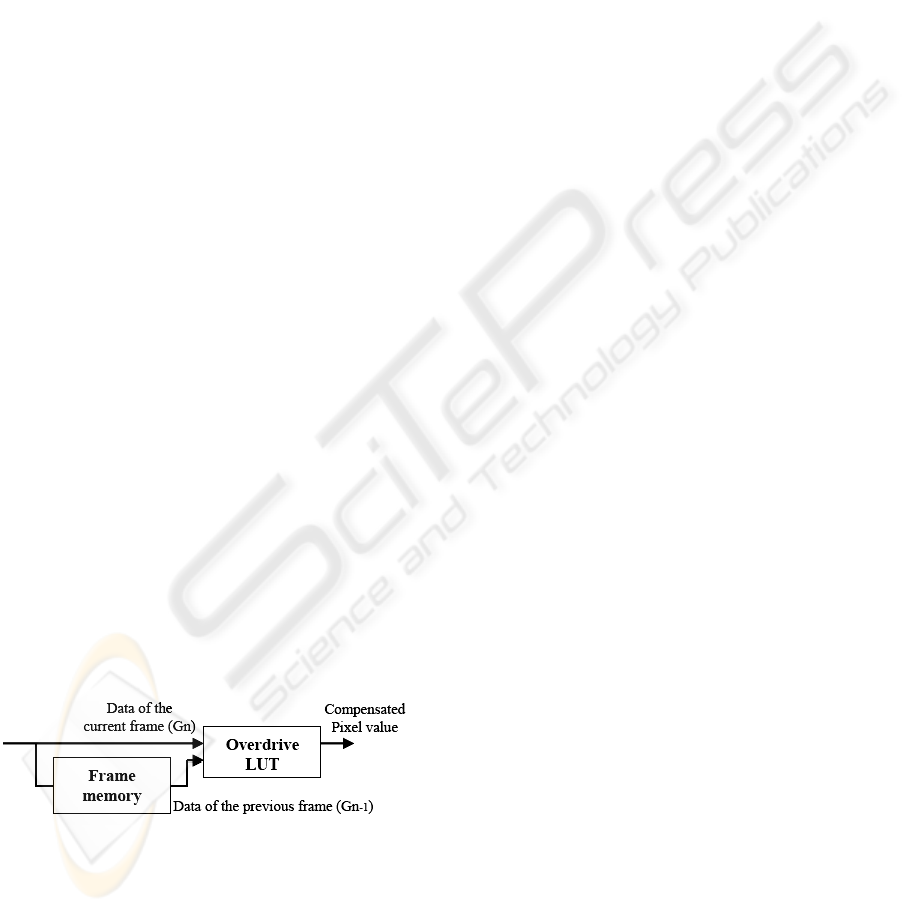
block diagram of overdrive is shown in Figure 1.
Figure 1: Block Diagram of overdrive.
The overall system includes a signal processing unit
which generates a current frame data, a frame
memory to store a previous frame data, an
overdriving unit to generate the current frame data
using the frame memory and the look-up table
(LUT), and a liquid crystal panel configured to
display the frame data.
For each pair of the pixel value of the current frame
and the pixel value of the previous frame, the look-
up table (LUT) is used to compute a compensated
value based on TFT-LCD response time
characteristics. However, most LUT stores a part of
the entire LUT data (256x256 matrix) since the LUT
size is limited by the physical memory size and
fabrication cost. For example, a typical LUT has 8 x
8 matrix format and final overdriving pixel values of
LUT are computed using an interpolation method. In
generally, bilinear interpolation is used due to its
simple implementation. However, bilinear
interpolation may introduce artifacts. In this paper,
we propose a new interpolation method for this LUT
implementation.
2 LUT FOR OVERDRIVE
A complete LUT requires a 256x256 matrix
structure in an 8-bit overdrive scheme. A total of
256x256 LUT values are needed for all possible
combinations of current and previous gray levels and
optimum LUT values for overdrive are determined
by experimental measurements. Figure 2 and Figure
3 show the characteristics of typical LUT data. As
can be seen in the Figure 2, the LUT column data
has non-linear characteristics. However, the LUT
row data (Figure 3) shows more linear
70
Park H., Seo G. and Lee C. (2009).
QUASI-BI-QUADRATIC INTERPOLATION FOR LUT IMPLEMENTATION FOR LCD TV.
In Proceedings of the First International Conference on Computer Imaging Theory and Applications, pages 70-73
DOI: 10.5220/0001807600700073
Copyright
c
SciTePress
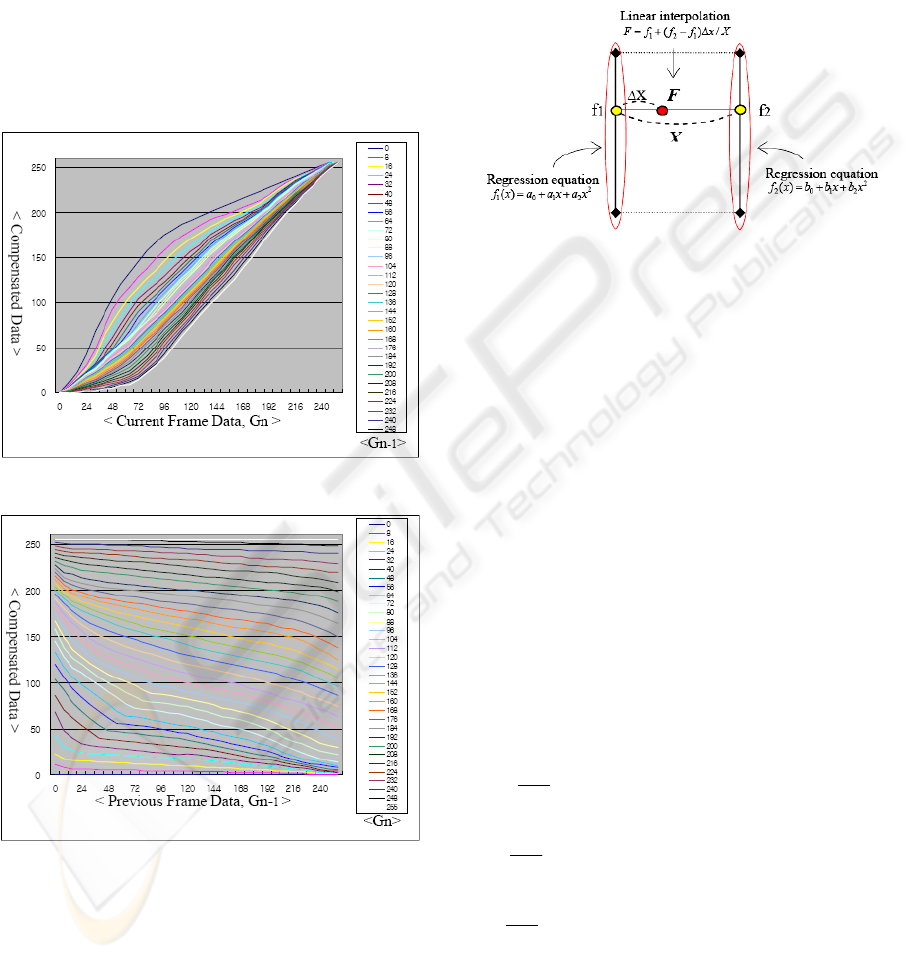
characteristics than the LUT column data. In bilinear
implementation, missing values are interpolated
using linear functions. When three data points are
available, one can use a quadratic interpolation
function:
2
210
)( xaxaaxf ++=
.
The three coefficients can be determined from the
three data points and this quadratic function can be
used to fill in missing values between the three
points. We will call this method the quadratic
interpolation method.
Figure 2: LUT column data.
Figure 3: LUT row data.
3 THE PROPOSED ALGORITHM
In the proposed method, linear interpolation and
least-square regression methods are used for LUT
implementation. It can be seen that the column data
of LUT (Figure 2) shows more non-linear
characteristics than the row data of LUT (Figure 3).
Based on these observations, we propose to use a
quadratic regression method to find the best-fit of
the column data of LUT and to use linear
interpolation for the row data of LUT. The proposed
quasi-bi-quadratic interpolation is illustrated in
Figure 4.
Figure 4: Concept of quasi-bi-quadratic interpolation.
In the proposed method, f1 and f2 are first computed
using quadratic polynomials.
2
2101
)( xaxaaxf ++=
(1)
2
2102
)( xbxbbxf ++=
(2)
To obtain the coefficients, the least square method is
used:
exaxaay +++=
2
210
(3)
where
e
is an error. Then, we can compute
r
S
which is the square sum of error e as follows:
2
2
210
11
2
) (
iii
n
i
n
i
ir
xaxaayeS −−−==
∑∑
==
(4)
To find
0
a ,
1
a ,
2
a that minimizes
r
S , we
differentiate
r
S with respect to each coefficient:
) (2
2
210
0
iii
r
xaxaay
a
S
−−−−=
∂
∂
∑
(5)
) (2
2
210
1
iiii
r
xaxaayx
a
S
−−−−=
∂
∂
∑
(6)
) (2
2
210
2
2
iiii
r
xaxaayx
a
S
−−−−=
∂
∂
∑
(7)
By setting the differentiations, we obtain the
following equations:
∑
∑
∑
=++
iii
yaxaxan
2
2
10
)()()(
(8)
QUASI-BI-QUADRATIC INTERPOLATION FOR LUT IMPLEMENTATION FOR LCD TV
71
∑
∑
∑∑
=++
iiiii
yxaxaxax
2
3
1
2
0
)()()(
(9)
∑∑∑∑
=++
iiiii
yxaxaxax
2
2
4
1
3
0
2
)()()(
(10)
The optimal coefficients can be obtained by
simultaneously solving these equations. Then, the
final value is determined from f1 and f2 using linear
interpolation as follows:
X
xff
fF
Δ+
+=
)(
21
1
(11)
4 EXPERIMENTAL RESULTS
Table 1 shows the SNR comparison of the bilinear
interpolation method, the quadratic interpolation
method and the least square quadratic regression
method for the column data. It can be seen that the
quadratic regression method provides noticeably
improved results.
Table 1: The SNR(dB) of LUT column data.
0
gray
32
gray
64
gray
96
gray
128
gray
160
gray
192
gray
224
gray
255
gray
A* 35.4 39.0 40.3 41.4 42.5 42.2 41.1 39.8 41.6
B* 36.2 41.6 43.7 43.0 43.4 43.9 42.2 39.8 35.3
C* 40.5 44.5 47.0 45.8 46.0 50.1 46.9 43.6 44.6
A*: Linear Interpolation (AVG: 40.4)
B*: Quadratic Interpolation (AVG: 41.0)
C*: Least Square Quadratic Regression (AVG: 45.4)
Table 2: Number of LUT coefficients.
Method for LUT Implementation
Number of
Coefficients
Bilinear Interpolation 144
Quadratic Interpolation 108
Least Square Quadratic Regression 108
0
50
100
150
200
250
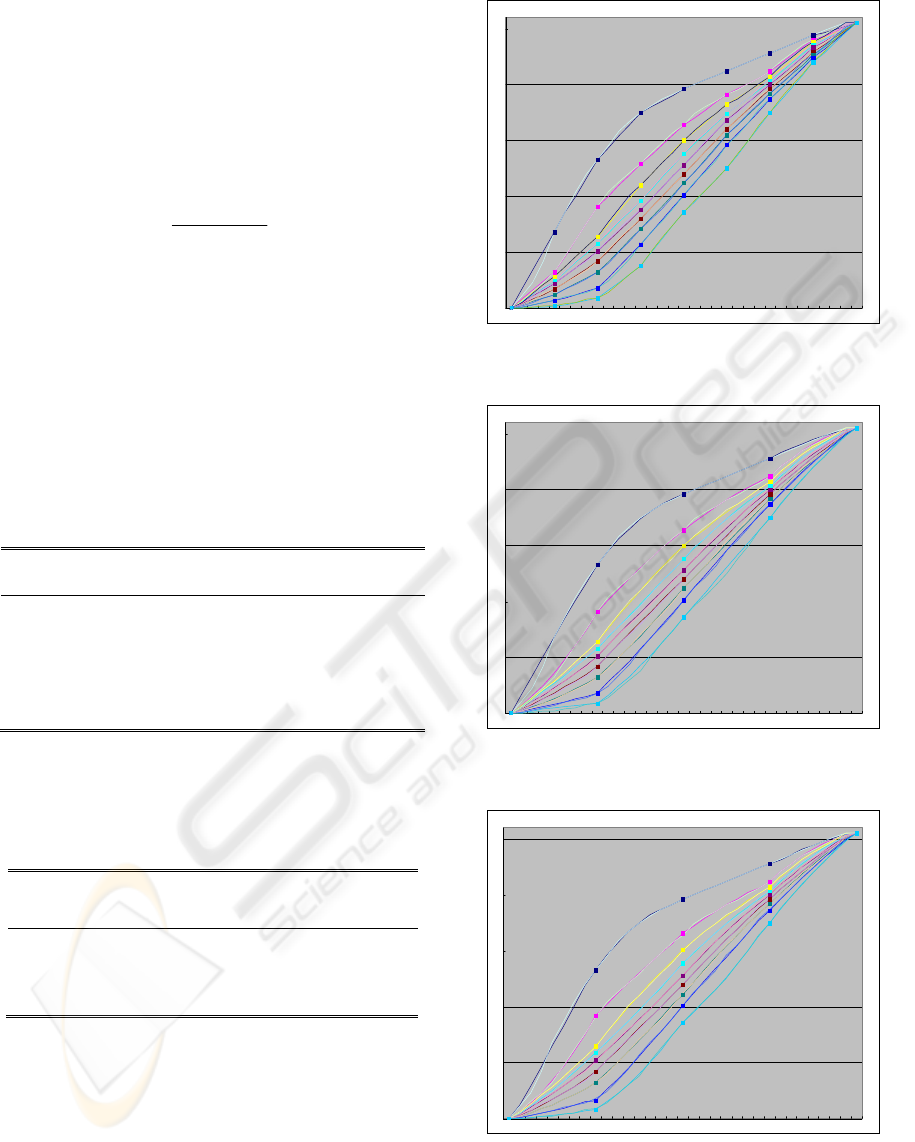
0 16 32 48 64 80 96 112 128 144 160 176 192 208 224 240 255
Figure 5: Curve fitting of the column data of LUT using
bilinear interpolation.
0
50
100
150
200
250
0 16 32 48 64 80 96 112 128 144 160 176 192 208 224 240 255
Figure 6: Curve fitting of the column data of LUT using
quadratic interpolation.
0
50
100
150
200
250
0 16 32 48 64 80 96 112 128 144 160 176 192 208 224 240 255
Figure 7: Curve fitting of the column data of LUT using
least square quadratic regression.
IMAGAPP 2009 - International Conference on Imaging Theory and Applications
72

In ASIC LUT implementation, the coefficients are
saved in memory for computation efficiency. Table
2 shows the number of LUT coefficients for each
method. It can be seen that the least square quadratic
regression method provides more efficient memory
usage in ASIC implementation. Figure 5-7 show the
curve fitting of the column data for each method. It
can be seen that the least square quadratic regression
method generate curves that have smaller error than
other methods.
After computing the column data, final overdriving
values can be calculated by applying linear
interpolation for the row data. The bilinear
interpolation method, the quadratic interpolation
method and the quadratic regression method used
bilinear interpolation for the row data since the row
data of LUT show linear characteristics (Figure 3).
In the conventional bilinear interpolation method, 64
samples (8 by 8) are selected from the entire LUT
data (256 by 256). The sampling grids are equally
distributed. In the proposed method, every 4-th
sample is chosen for the column data and every 8-th
sample is selected for the row data. Thus, a total of
32 samples are used in the proposed method.
Table 3 shows the SNR comparison for LUT
implementation and Table 4 shows the maximum
error comparison. As can be seen, the proposed
method significantly outperforms the bilinear
method which is widely used in the industry.
Table 3: SNR comparison.
Method of LUT Implementation SNR(dB)
Bilinear Interpolation 38.0
Quadratic Interpolation + Linear
Interpolation
36.7
Quasi-bi-quadratic Interpolation 40.2
Table 4: Maximum Error Comparison.
Method of LUT
Implementation
Response Time
Error
Visual
Distortion Error
Bilinear
Interpolation
5.47 % 3.51 %
Quadratic
Interpolation
+ Linear
Interpolation
5.86 % 2.34 %
Quasi-bi-quadratic
Interpolation
3.51 % 1.56 %
5 CONCLUSIONS
In order to provide improved performance in the
LCD overdrive scheme, we propose to use the quasi-
bi-quadratic interpolation that is based on the least
square error approximation. The proposed method
outperforms the conventional bilinear interpolation
method with reduced memory requirement.
REFERENCES
Song, J.K., et.al., “DCCII: Novel Method for Fast
Response Time in PVA Mode,” SID 04 Digest,
pp.1344-1347, 2004.
Wubben, R. H. M., et. al., “LCD Overdrive Frame
Memory Reduction using scalable DCT-based
Compression,” SID 04 Digest, pp.1348-1351, 2004.
Someya, Jun, et. al., “A new LCD-Controller for
Improvement of Response Time by Compression
FFD,” SID 03 Digest, pp.1346-1349, 2003.
Hartman, R.A. et.al., “Fast Response Electro-Optic
Display Device.” United States Patent US5,495,265,
Feb. 1996.
B.-W. Lee et al., “Reducing Gray-Level Response to One
Frame: Dynamic Capacitance Compensation”, SID
2001 Digest, 51.2L, 2001.
K. Kawabe and T.Furuhashi, “New TFT-LCD Driving
Method for Improved Moving Picture Quality”, SID
2001 Symp. Digest, 2001.
QUASI-BI-QUADRATIC INTERPOLATION FOR LUT IMPLEMENTATION FOR LCD TV
73
