
Biological Qualification of Oocyte Maturity with the Use
of the Karhunen-Loeve Transform: Computer-aided
Decision for Selecting Best Oocytes Before Fertilization
Christian Pieralli
1
, Bruno Wacogne
1
, Charline André
1
, Christophe Roux
2
Christiane Joanne
2
and Lionel Pazart
3
1
FEMTO-ST Institute, Optics Department, UMR CNRS
6174, 16, route de Gray, 25030 Besançon cedex, France
2
Service de Génétique Histologie Biologie du Développement et de la Reproduction
University Hospital, 1, Place Saint Jacques, 25000 Besançon, France
3
Clinical Investigation Center for Technological Innovation, University Hospital
1, Place St Jacques, 25000 Besançon, France
Abstract. The estimation of the a priori maturity degree of oocytes before fer-
tilizing is a critical step in In Vitro Fertilization (IVF). This kind of analysis is
currently done by the practitioner with a visual microscope inspection and is
therefore subjective. In this paper, we propose the use of an image processing
called Karhunen-Loeve Transform (KLT). The KLT exploits the covariance
matrix and its eigenvectors for obtaining a representation of information in sev-
eral images. We show that the KLT permits the determination of the oocyte
maturity by examining the KL images and more precisely the eigenvalues of
each. The KLT could thus be a useful tool for IVF and we intend to develop a
dedicated server for all French IVF centers as a computer aided decision for
fertilization.
1 Introduction
In general, the estimation of the development degree (from growing to apoptosis) of
cells is very important in biology and medicine. The question is even more crucial in
IVF. Indeed, the involved hormonal treatment for women is very heavy and the inter-
vention is expensive. Practitioners have therefore to be sure that the oocyte(s) to be
implemented is (are) the best one(s). Although, in some cases, the maturity is obvious
and can be determined without any doubt, the decision of the practitioner is often
uncertain. This gives all the interest of our research.
More precisely, there are several oocyte maturity degrees like germinative vesicle,
metaphase implemented or not … Here, we will focus on three types: metaphase I,
metaphase II implemented and not implemented. The aim is to discriminate automati-
cally the development step of the gametes.
Pieralli C., Wacogne B., André C., Roux C., Joanne C. and Pazart L. (2009).
Biological Qualification of Oocyte Maturity with the Use of the Karhunen-Loeve Transform: Computer-aided Decision for Selecting Best Oocytes Before
Fertilization.
In Proceedings of the 1st International Workshop on Medical Image Analysis and Description for Diagnosis Systems, pages 77-84
DOI: 10.5220/0001810900770084
Copyright
c
SciTePress

The most used method for determining the oocyte maturity deals with a simple
microscope visualization of the oocyte. This is obviously subjective and can lead to
misinterpretation of the exact maturity degree. Other means have been elaborated for
achieving objective determination by using digital image processing [1], [2], uncon-
ventional illumination [3] or microsystems [4]. The first one has not been completely
efficient, the second remains subjective and the third is rather difficult to insert during
usual act of fertilization.
We propose here a new kind of image processing, i.e. the use of a statistical trans-
form (KLT), which enables an automatic determination of the oocyte maturity. After
a presentation of the KLT, we will present first results obtained with pictures of oo-
cytes which demonstrate the ability of the KLT, after pre-processing of the pictures,
to separate a priori the various phases of oocyte development. We will then show the
results related to the objective qualification with oocytes which were transferred into
the uterus but which did not implant (they did not remain in the uterus). We will
prove that this method permits to establish a reason for the non implantation. Finally,
a blind test of the software will show the validity of the method before concluding.
2 The Karhunen-Loeve Transform and Associated Study Protocol
2.1 The KLT
The KLT is a statistical representation technique based on the changing of space. It
allows the description of a phenomenon, measured in a pattern (observation) space
whose elements are correlated, by means of uncorrelated parameters in another space
in which the principal axes are ordered in terms of importance [5], [6] An important
property of KLT is that, unlike the Fourier transform or the factorial analysis, the
basic vectors are not known a priori but are "tailor made" for the given set of vectors.
The initial step is to take into account a set of N pictures to be analyzed. The KLT
needs the calculation of the covariance matrix (CM) of the picture set after resorting
of the picture pixels. That is to say that you need to reshape the pixel square matrix in
vectors. Next step is to compute the eigenvalues of the CM and sort them in decreas-
ing order. To each eigenvalue is associated an eigenvector which is called KL image.
The eigenvalue represents the percentage of information related to the corresponding
KL image.
To illustrate the KLT, we can say that the KL image 1 (eigenvector corresponding
to the higher eigenvalue) is the mean picture. The differences between pictures are
more present in the KL images related to small eigenvalues which are to be quantified
[7].
2.2 Associated Protocol
The chosen protocol first relies on the types of oocytes we decided to investigate.
There were cells at the step of metaphase I, non implemented metaphase II and im-
plemented metaphase II. The basic idea is to form a “basis” with one type of oocytes,
78
in our case 12 pictures of metaphase I oocyte whose maturity degree is obvious and
does not suffer from any doubt. Then we compute the eigenvectors of the covariance
matrix. The basic idea is to remove one picture of metaphase I oocyte and to replace
it with another one. Next step is to analyze the variations of the eigenvalues associ-
ated to each replacement.
We decided to do this in two steps: first we replace one MI by another MI (differ-
ent from the 11 remaining MI in the initial set). It has been done 12 times. Next we
compute the mean and rms of the variation of the eigenvalues. This step is iterated
with 12 pictures of implanted MII and the same study is applied. To find KL images
which permit to separate the various maturities, we will have to find those which are
the most different for the two cases described above.
This study will then be applied to not implanted MII and then with a blind test.
3 Experimental Results
In this section, we use for computing the results a 12 picture set. But for an easy un-
derstanding of figures related to pictures and KL images, a 6 pictures set will be used.
It does not change the generality of the method.
3.1 Pre-processing
First we decided to apply the KLT to oocyte pictures directly obtained from a micro-
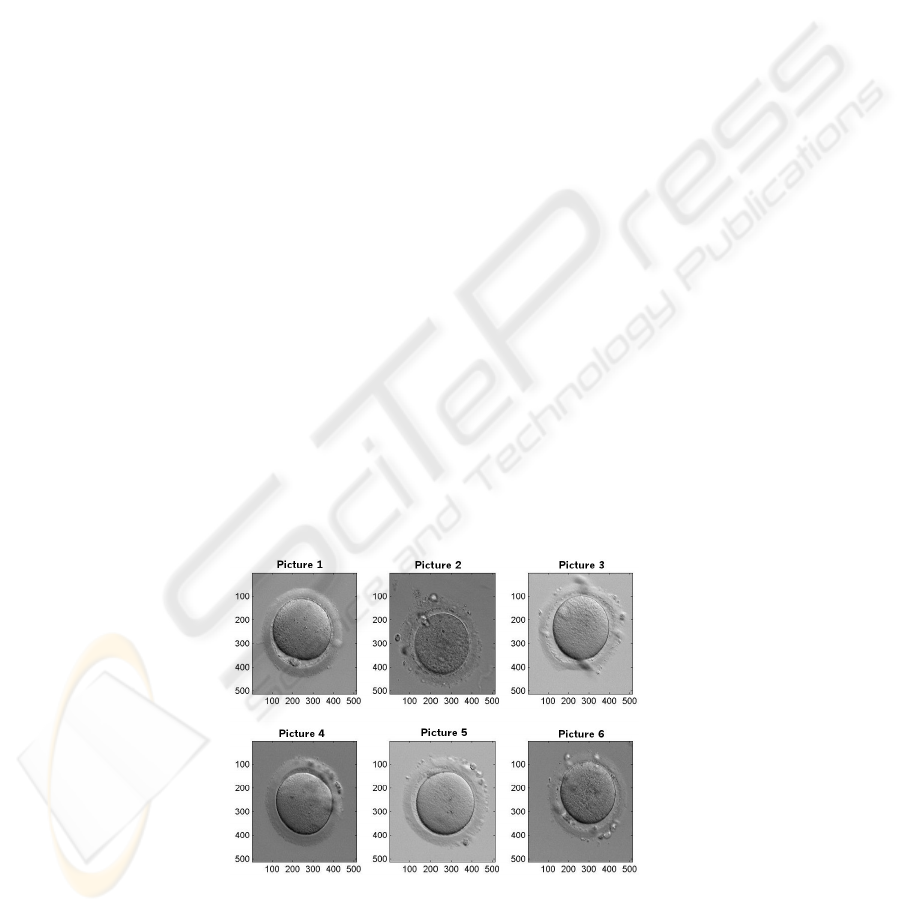
scope analysis. It leads to the figure 1 presenting six pictures of metaphase I. In the
following, the pictures are 512x512 pixels, obtained with a magnification x40. The
classical size of an oocyte is 150 µm.
The direct application of the KLT to these data is given in the figure 2. It repre-
sents the six KL images, be the eigenvectors the CM. You have to keep in mind that
they are not pictures but representations of the information contained in the picture
set. The size is the same as those of the above pictures, be 512x512 pixels.
Fig. 1. Set of 6 pictures of metaphase I oocytes (512x512 pixels).
79
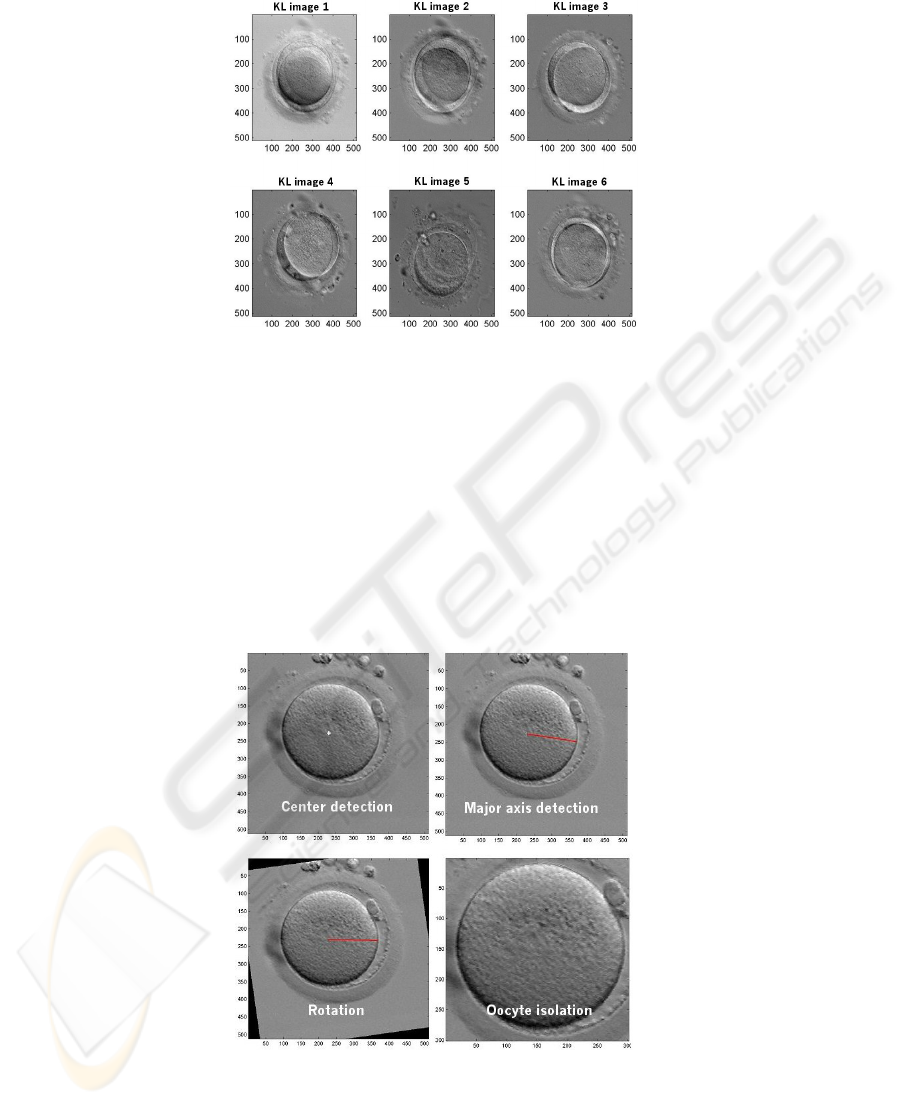
Fig. 2. KL images of the six pictures of figure 1 (512x512 pixels).
The KL images are in fact not exploitable. Indeed, they mainly exhibit the posi-
tions of the oocytes of figure 2. Putting in evidence the difference between a MI and a
MII would be difficult to achieve. That is why we elaborated pre-processing for ob-
taining correct KL images. To do so, we first detect the center of the oocytes in the
pictures by an autocorrelation of a test picture which consists of the whole cytoplasm
of an oocyte extracted from the background and the zona pellucida; this test picture is
done one time for all with the PC mouse. Next step is to detect the major axis of the
cell (because an oocyte is slightly ovoid). A simple ray tracing from the detected
center to the cytoplasm edge is used. The oocyte is then rotated to get all the time the
same orientation. Finally, by using the conventional size of a cell, we isolate the use-
ful picture. This is summarized in the figure 3.
Fig. 3. Description of the various steps for obtaining suited pictures of oocyte (initial picture:
512x512 pixels, final picture: 300x300 pixels).
80
We have now standardized pictures which authorizes a better application of the
KLT.
3.2 Results for MI and Implanted MII
Let us remind the protocol. We first initiate the study by using a set of 12 MI pictures.
Then one MI picture is removed and we finally analyze the variation of each eigen-
value due to each change (in fact, we only studied the KL images from 5 to 12 be-
cause we know a priori that the difference, if it occurs, belongs to these KL images).
We did the same with 12 implanted.
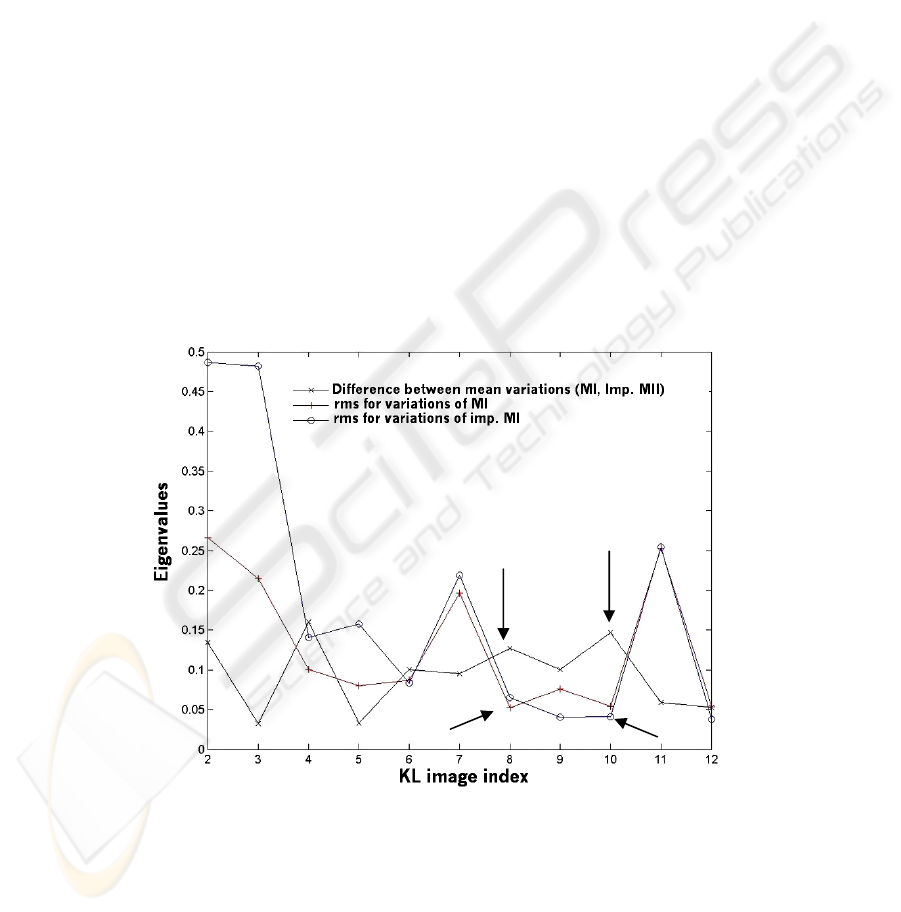
The comparison of the variation of the eigenvalues vs. KL images is shown in figure 4.
The issue is to select the KL images where the mean difference of eigenvalue vari-
ations between the two groups is the greater for respective rms as low as possible. It
seems that the optimum is for KL images 8 and 10 as indicated by arrows in figure 4.
To examine if the KLT is suited to discriminate the types of oocytes, we plot the
eigenvalue attached to each replacement of oocyte for both types in the figure 5. We
can easily see that the two kinds of oocytes are separated. The signs o depicts the
barycenters of the two sets and the two circles the limit of 1.4σ, σ being the disper-
sion. It involves a detection probability for a blind test of at least 75 %. The t-student
test confirmed that the two classes were separated with an error probability less than
0.001.
Fig. 4. Plots illustrating the variation of the eigenvalues vs. KL images (x: difference between
the mean variations for each type of oocyte, +: rms of the variations for MI, o: rms of the varia-
tions for implanted MII).
Max difference
81
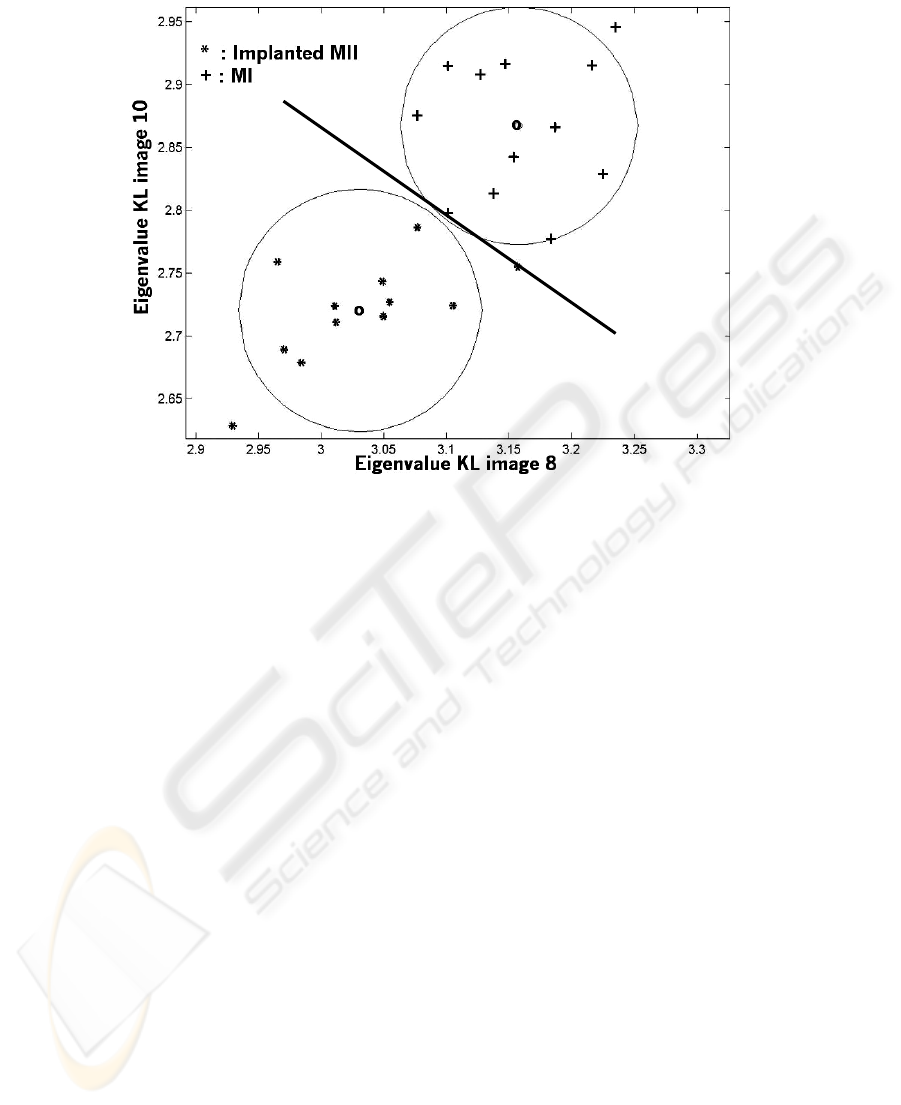
Fig. 5. Eigenvalue 10 vs. eigenvalue 8 for replacements with MI and implanted MII oocytes.
3.3 Results Blind Test and not Implanted MII
We used a blind test in order to evaluate the robustness of the method. The practitio-
ner gave us seven oocyte pictures which are clearly in a clearly detectable maturity
degree without telling it to us. We applied the KLT in the same conditions as previ-
ously mentioned. It led to the figure 6. By comparing the data given by the practitio-
ner, it appeared that the classification issued from the KLT succeeded in all unknown
oocyte.
Finally we analyzed the behaviour of not implanted MII (fertilized oocyte which
did not lead to pregnancy). As previously, we use the KL images 8 and 10. It leads to
the figure 7.
82
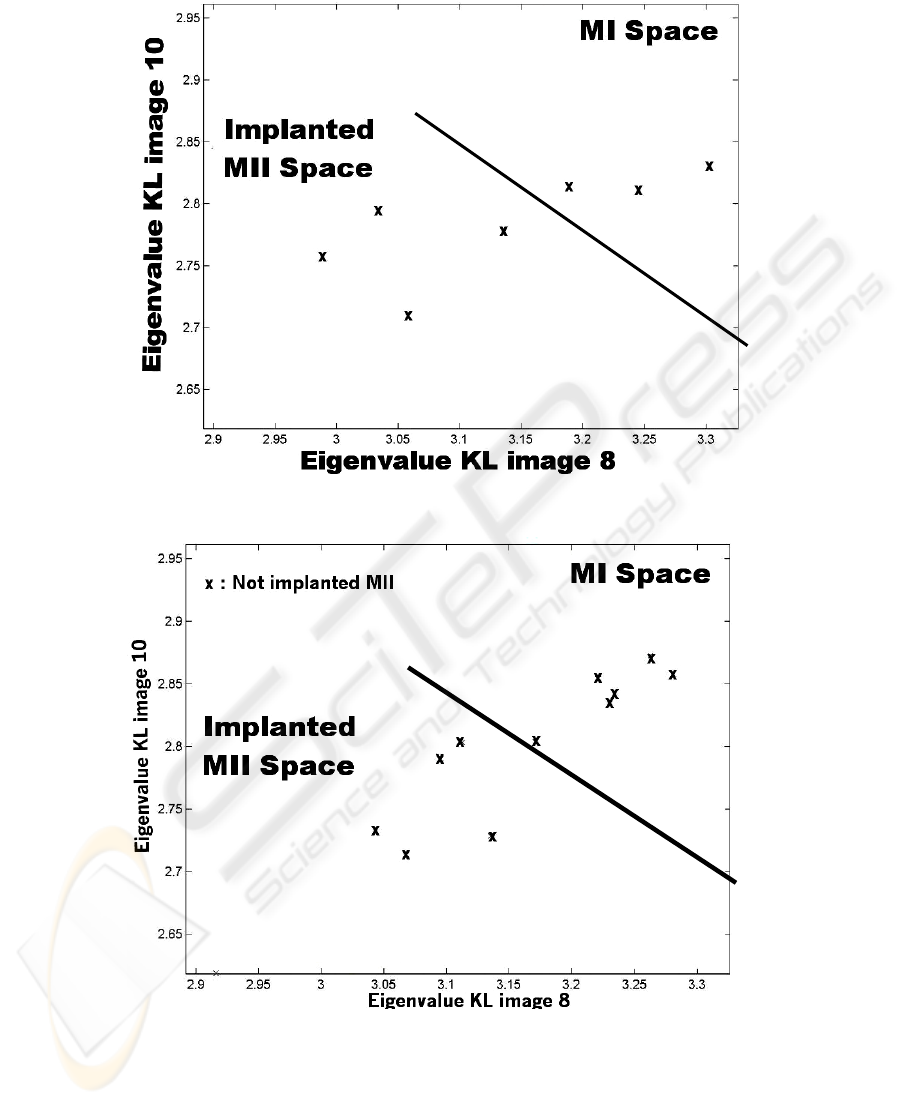
Fig. 6. Eigenvalue KL image 10 vs. Eigenvalue KL image 8 as a blind test for 7 oocytes.
Fig. 7. Eigenvalue KL image 10 vs. Eigenvalue KL image 8 for not implanted oocyte.
83

4 Conclusions and Perspectives
The recognition of oocyte maturity degree is one of the most important steps in IVF.
Choosing the best oocyte, currently done by a visual inspection of the oocyte by the
practitioner and therefore very subjective, needs nowadays objective methods. We
proposed here a new image processing based on the KLT for giving a computer aid to
the doctor. The KLT is based on a statistical approach of a picture set and classifies
information in terms of presence in one or more pictures. By creating a picture set of
one type of oocytes and by replacing one picture by one to be analyzed, we showed
that it was possible to discriminate the maturity degrees. We validated this concept
first with oocytes which were clearly in one maturity type (MI and implanted MII),
then with a blind test and finally we apply the KLT to oocytes which did not implant.
The result that this was due to two reasons: non maturity of some oocytes on one
hand and other problems during the process after transferring the oocyte into uterus
on the other hand.
As perspectives mainly three stages are foreseen:
1. to use an initial picture set of more images,
2. to proceed with a clinical validation with a substantial number of oocytes,
3. to elaborate a server linked to other French IVF centers for offering to other
practitioners a useful tool for deciding of the cell maturity in an objective
manner.
References
1. Beuchat, A., Thévenaz, P., Unser, M., Ebner, T., Senn, A., Urner, F., Germond, M., Sor-
zano, C.O.S.: Quatitative morphometrical characterization of human pronuclear zygotes.
Hum. Reprod, 23 (2008) 1983-1992
2. Thompson, J.: Culture without the Petri dish. Therigenelogy 67 (2007) 16-20
3. Pelletier, R..C., Keefe, D., Trimarchi, J.: Noninvasive polarized light microscopy quantita-
tively distinguishes the multilaminar structure of the zona pellucida of living human eggs
and embryos. Fertility and Sterility 81 (2004) 850-856
4. Wacogne, B., Pieralli, C., Roux, C., Gharbi, T.: Measuring the mechanical behaviour of
human oocytes with a very simple SU8 micro-tool. Biomed. Microdevices 10 (2008) 411-
419
5. Chien, Y.T., Fu, K.S.: On the generalized Karhunen-Loeve expansion. IEEE trans. Infor-
mation Theory 13 (1967) 518-520
6. Fukunaga, K., Koontz, W.L.G.: Application of the Karhunen-Loeve expansion to feature
selection and ordering. IEEE Trans. Comp. C-19 (1970) 311-318.
7. Comas L., Berthout P., Sabbah, R., Daspet, J.P., Blagosklonov, O., Baud, M., Verdenet, J.,
Cardot, J.C.: 2005, Use of a 4-D cardiac phantom to quantify Karhunen-Loeve images ap-
plied to myocardial gated SPECT, Comp; In Cardiology, Vol. 32, pp. 541-544.
84
