
The Velocity Effect on GEDEM Measurements
Nikos Papadakis
1
, George Tzagarakis
1,2
, N. Kampanis
3
, Savakis K.
1
P. Katonis
2
, K. Stergiopoulos
2,1
and D. G. Christakis
1
1
TEI of Crete,Biomechcanics Laboratory, School of Mechanical Engineering
TEI of Crete, Estavromenos, Greece
2
Department of Orthopaedics, University of Crete School of Medicine
University Hospital of Heraklion, Crete, Greece
3
Foundation of Research and Technology Hellas, Institute of Applied and Computational
Mathematics, PO Box 1385, 71110 Heraklion, Crete, Greece
Abstract. Gait Evaluation Differential Entropy Measure (GEDEM) [1] is a new
quantitative approach to evaluating the condition of a subject by monitoring the
acceleration [2][3]. The approach is capable to identify medical conditions [2,
3] and is also not dependent on age, weight, height or BMI. The initial studies
[4][5][6] required the walking on the ground along a straight line for 20-30 sec-
onds. Due to the promising results of the method, work is currently carried out
on a treadmill. The treadmill alleviates the constraint of long corridors, and ad-
ditionally offers better control on the gait velocity, minimum deviation in the
coronal plane, and less variability in the GEDEM values [7, 8]. This work in-
vestigates the relationship between the gait velocity and the GEDEM. The gait
velocity is a measurement parameter that influences the gait acceleration spec-
trum and therefore it is expected to influence GEDEM values.
1 Introduction
Human walking patterns are different. Each person’s ideal gait is a combination of
periodic movements determined by the body characteristics and the personal ability to
control the gait. In the case of neuromuscular and musculoskeletal pathologies or
injuries, these movements are not periodic and provide random variability. The walk-
ing pattern variability reflects the quality of the individual neuromuscular control and
increases in cases of neuromuscular and musculoskeletal pathologies or injuries [9]
Accelerometer methods have proved appropriate and reliable for gathering gait da-
ta. Human body motion acceleration measurements have been analyzed with the use
of entropy, as a measure of randomness, during the last two decades. Accelerometer
sensors are low cost, small, light and easy to be adopted into portable measuring
systems.
Shannon introduced the term entropy in order to quantify the information on a sig-
nal [10]. The concept of entropy was proposed as a general measure for both the
randomness and harmony by Christakis [11]. The entropy is correlated, by definition,
to the variability and the randomness while harmony is defined as the property of
Papadakis N., Tzagarakis G., Kampanis N., K. S., Katonis P., Stergiopoulos K. and Christakis D. (2009).
The Velocity Effect on GEDEM Measurements.
In Proceedings of the 1st International Workshop on Mobilizing Health Information to Support Healthcare-related Knowledge Work, pages 3-12
DOI: 10.5220/0001811900030012
Copyright
c
SciTePress

systems to match each other. Systems in harmony provide periodic, repeatable and
identical behaviour and thus they are easy to be recognized and serve for definite,
prescribed purposes, able to be matched to related systems. Christakis [12, 13] distin-
guished between harmony and the randomness proposing appropriate models for each
concept. The current physics and mathematics do not provide a coherent general
background for the study of harmony while the entropy stands as a basic concept to
measure the randomness of systems. Entropy reduction is considered as an indication
but not a measure of harmony. Randomness is a different concept than harmony.
Because of the relationship between entropy and harmony and the existence of rele-
vant mathematical formulations, entropy was introduced as a measure to evaluate the
quality of the human gait and, therefore, to detect injuries and pathologies.
In 1991, Pincus introduced the approximate entropy technique [14]. ApEn is a
technique that can be used to quantify the irregularity or variability of short finite
time series based on the statistics. ApEn is a measure of likelihood of predicting fu-
ture behaviour of a time series based on past values of the signal.
Arif et al. [15, 16, 9] and other authors proposed accelerometers and Approximate
Entropy for studying the effect of fatigue on walking stability and the walking stabil-
ity of young and elderly subjects. Kavanagh et al. [17] used Approximate Entropy for
studying the effect of ageing on the pattern and structure of head and trunk accelera-
tions during walking.
Gait Evaluation Differential Entropy Measure (GEDEM) [1] is a new quantitative
approach to evaluating the condition of a subject by monitoring the accelera-
tion[2][3]. The approach is capable to identify medical conditions [2, 3] and is also
not dependent on age, weight, height or BMI. A device records the gait acceleration.
Through spectral analysis is possible to estimate and quantify the level of uncertainty
in the movement and summarize it in the GEDEM index. The principle is that patho-
logical or mental conditions will increase the movement uncertainty and non perio-
dicity of the movement. The initial studies required the walking on the ground along a
straight line for 20-30 seconds. This work investigates the relationship between the
walking velocity and the GEDEM. The gait velocity is a measurement parameter that
influences the gait acceleration spectrum and therefore it is expected to influence
GEDEM values.
2 Measurement Protocol
2.1 General Overview of GEDEM Method
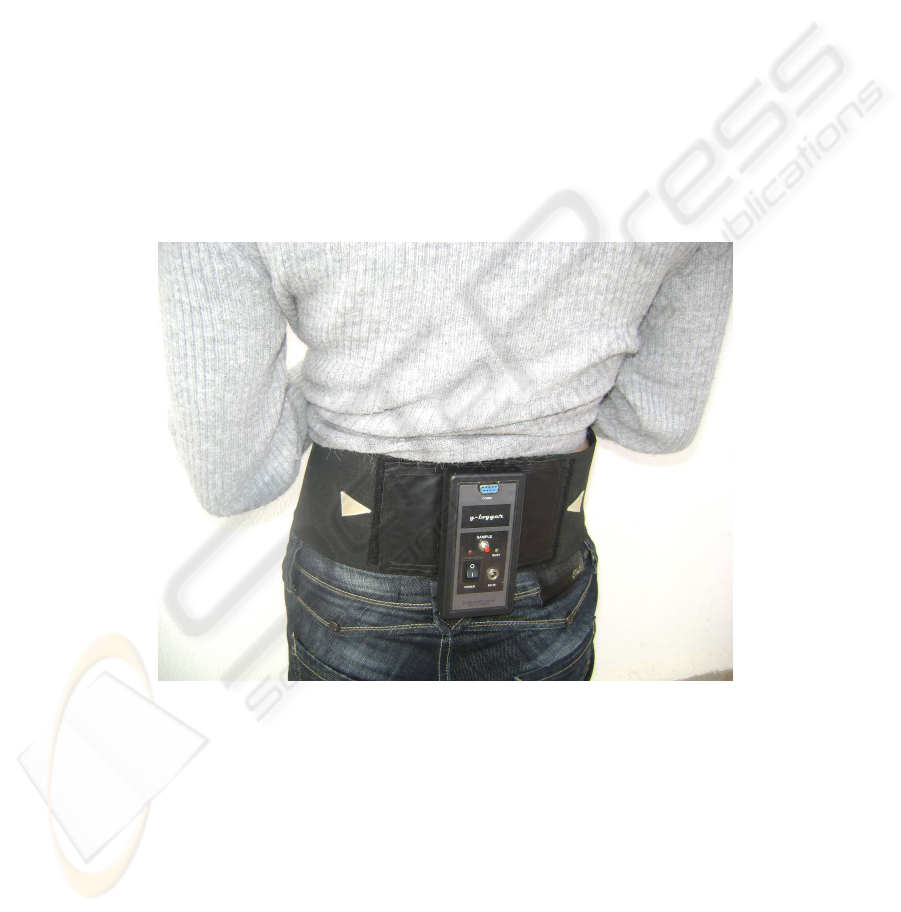
The GEDEM Method consists of the following steps. The measurement of the gait
acceleration signal is the first step. The measurement device consists of a tri-axial
accelerometer device connected appropriately to a data logger. The device is attached
on the subject’s body near the O5 (Figure 1). The human body Centre of Gravity
(COG) is considered to be near the O5 [18, 19]. The COG is reflects body movements
and has an important role in maintaining the dynamic stability during walking [15,
16, 9, 20]. The measurement devise is designed to achieve the minimum disturbance
4
on the subjects’ walking. The subject executes a usual walking pattern; e.g. walk for
15 meters or walk for more than 15 seconds on treadmill.
In the second step, the gait acceleration signal is analysed by the differential Entropy
method developed by Papadakis and Christakis [1]. Differential entropy values are
obtained for each axis. In this study only the Z-axis results will be presented.
2.2 Equipment
The Gait acceleration measurement device consists of an accelerometer sensor, a
microcontroller, a voltage regulator, a memory, a transceiver and a battery. Acceler-
ometer sensor is a tri-axial 12-bit accelerometer, capable to measure accelerations up
to 2 g. The measurement device is based on an 8-bit microcontroller, ΑΤΤΙΝΥ2313.
The device dimensions are 125x65x25 mm weight 150 g (including the battery). Low
weight is important to minimise the effect on the measurement. The data is trans-
ferred to PC via an RS232 port. The data is stored in a PC in ASCCI Format. An
example of a typical raw accelerometer signal is presented in Figure 2. In this study
only z-axis acceleration is was used.
Fig. 1. Accelerometry Device on the body.
3 Measurement Procedure
Acceleration data was collected whilst the participant walks across a distance of sev-
eral metres on the treadmill. All measurements were performed in the afternoon. All
subjects were asked to walk on the treadmill for at least 2 minutes before the meas-
urements were obtained. The subject was not alerted with regard to the commence-
5

ment of the measurement. The measurement duration was 30 sec. Subjects wore light
clothes and thin shoes. The subjects were calm and not nervous.
3.1 Exercise Protocol
During the measurement, the treadmill inclination was zero. Five 5 repetitions for
each velocity level were performed. The order of the velocity is random to avoid any
systematic error.
The subjects are wearing light clothes and casual walking shoes. During the meas-
urement, the subjects were asked to focus on a point on the wall positioned 140 cm
above the floor lying directly in front of their walking path. This was to avoid distrac-
tions. In general, every possible measure was taken to avoid outside stimuli on the
subject during the measurement.
The following treadmill speeds were selected:2.5 [km/h], 4.0 [km/h], 5.5 [km/h],
7.0 [km/h].
3.2 Subjects
The subjects’ were interviewed. The surname, name, father name, gender, occupa-
tion, address, telephone, height, weight, age and medical history was recorded. All
subjects signed an informed consent according to the University Institutional Review
Board. The measurements were performed in the premises of the TEI of Crete in an
airconditioned room. Care was taken to minimise distraction on the subjects during
the measurements. All subjects are healthy individual. The names of the subjects are
not presented.
Table 1.
No ID Gender Age Height Weight BMI
1 ZA Male 26 172 70 23.6
2 MS Male 23 165 65 23.8
3 MI Male 23 177 60 19.1
PP Male 26 170 75 25.9
AS Male 24 180 89 27.4
4 Analysis/Discussion
4.1 X-axis Distribution GEDEM
This index represents the dispersion of the acceleration values in the axis of the
movement. It is expected that increased velocity will lead to an increased dispersion.
Fig. 2 presents the X-axis Distribution GEDEM values vs the gait velocity. It is obvi-
ous that as velocity increased the X-axis Distribution GEDEM values increase. It
appears that the gradient of the increase is similar. In all the subjects, a gradient be-
tween 0.2 and 0.21 was exhibited. Only one subject has a higher value.
6
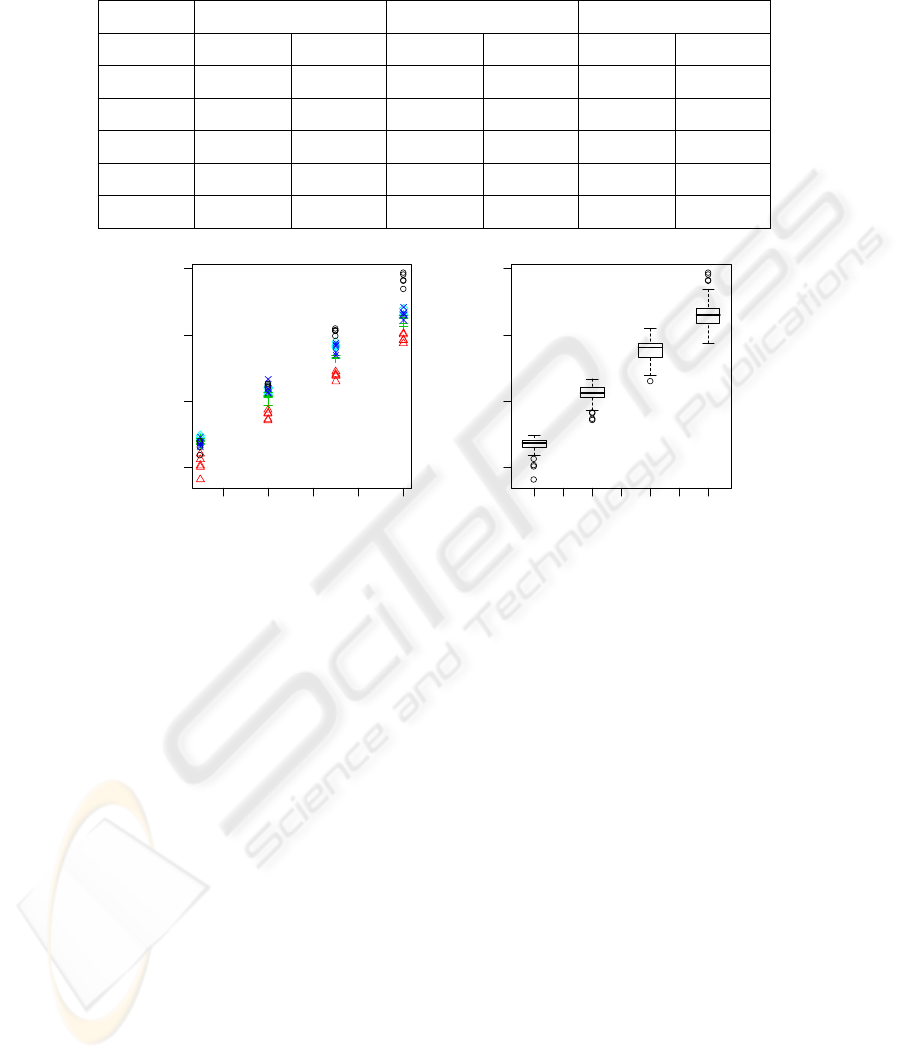
Table 2. X-Axis Distribution GEDEM Value vs Velocity Linear Model Coefficients.
X-Axis Dist GEDEM Y-Axis Dist GEDEM Z-Axis Dist GEDEM
Name Intercept Gradient Intercept Gradient Intercept Gradient
AS -1.511 0.277 -1.076 0.2401 -1.434 0.317
MI -1.48 0.2105 -1.42 0.1861 -1.677 0.3127
MS -1.295 0.2027 -1.521 0.2444 -1.865 0.3246
PP -1.309 0.2145 -1.352 0.1769 -1.578 0.3167
ZA -1.279 0.2106 -1.411 0.2172 -1.861 0.3632
34567
-1.0 -0.5 0.0 0.5
Velocity [km/h]
Distribution GEDEM X Axis [Nats]
(2.5,3.14] (4.43,5.07] (6.36,7]
-1.0 -0.5 0.0 0.5
Velocity [km/h]
Distribution GEDEM X Axis [Nats]
Fig. 2. X-Axis Distribution GEDEM vs Gait Velocity scatter plot (left) and whisker plot
(right).
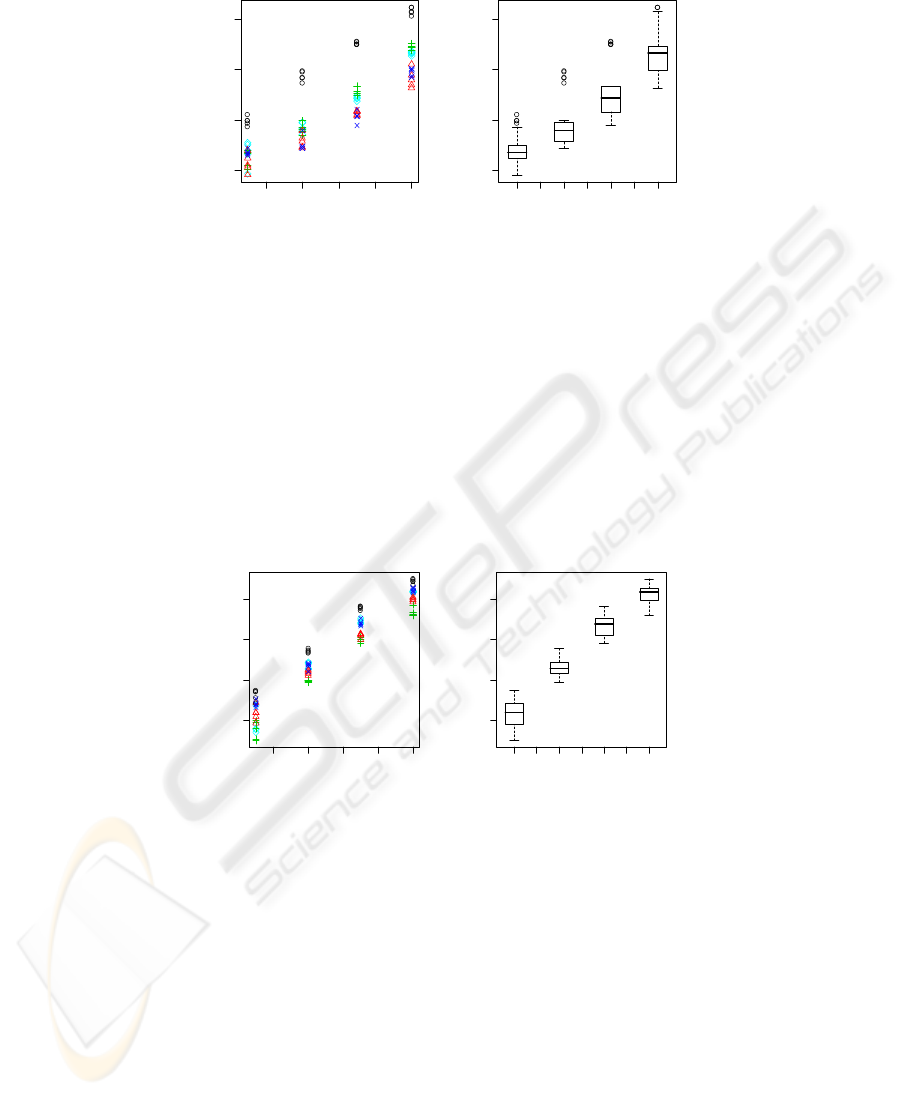
4.2 Y-Axis Distribution GEDEM
This index represents the dispersion of the acceleration values in the lateral axis (y-
axis) (on the transverse plane perpendicular to the axis of movement). Since the total
displacement on the Y-axis is zero, the uncertainty is calculated from oscillations
around the zero acceleration value. As the velocity increases, the movement in the y-
axis needs to be more pronounced. Therefore, it is expected that increased velocity
will lead to an increased dispersion.
Fig. 3 presents the Y-axis Distribution GEDEM values vs the gait velocity. It is ob-
vious that as velocity increased the Y-axis Distribution GEDEM values increase.
Table 2 present the gradients of a linear model. It appears that the gradient of the in-
crease range from 1.7 to 2.5.
7
34567
-1.0 -0.5 0.0 0.5
Velocity [km/h]
Distribution GEDEM Y Axis [Nats]
(2.5,3.14] (4.43,5.07] (6.36,7]
-1.0 -0.5 0.0 0.5
Velocity [km/h]
Distribution GEDEM Y Axis [Nats]
Fig. 3. Y-Axis Distribution GEDEM vs Gait Velocity scatter plot (left) and whisker plot
(right).
4.3 Z-Axis Distribution GEDEM
This index represents the dispersion of the acceleration values in the vertical axis (z-
axis). Similarly to the Y-axis It is expected that increased velocity will lead to an
increased dispersion and therefore increased GEDEM index.
Fig. 4 presents the Z-axis Distribution GEDEM values vs the gait velocity. It is obvi-
ous that as velocity increased the Z-axis Distribution GEDEM values increase.
Table 2
presents the gradients of a linear model. It appears that the gradient of the increase
range from 3.1 to 3.6.
34567
-1.0 -0.5 0.0 0.5
Velocity [km/h]
Distribution GEDEM Z Axis [Nats]
(2.5,3.14] (4.43,5.07] (6.36,7]
-1.0 -0.5 0.0 0.5
Velocity [km/h]
Distribution GEDEM Z Axis [Nats]
Fig. 4. Z-Axis Distribution GEDEM vs Gait Velocity scatter plot (left) and whisker plot (right).
4.4 X axis Spectral GEDEM
This index represents the dispersion of the power spectrum in the axis along the
movement nt (x-axis). This index is lower if the number of frequency components
which are important is less (i.e. when the movement is constant and at a certain
rhythm). If there are significant changes in the rhythm then the index will increase.
Fig. 5 presents the X-axis Spectral GEDEM values vs the gait velocity. The figure
initially appear not to be consistent. Because there is high dispersion during the initial
values, a decrease around 5.5[km/h], and a further increase at 7.0[km/h]. This is at-
8
tributed to the fact that at low velocities during the measurement on the treadmill, it
was observed that the subjects were finding the velocity to low. As a result the lim-
ited length of the treadmill resulted in accelerations and decelerations trying to com-
pensate for the movement; thus having a significant effect on the movement. The
effect was different among the subjects (i.e. some performed better at 4.0[km/h],
some better at 5.5[km/h]). Beyond 5.5.[km/h] the dispersion of the values increased.
34567
-1.0 -0.5 0.0 0.5 1.0 1.5
Velocity [km/h]
Spectral GEDEM X Axis [Nats]
(2.5,3.14] (4.43,5.07] (6.36,7]
-1.0 -0.5 0.0 0.5 1.0 1.5
Velocity [km/h]
Spectral GEDEM X Axis [Nats]
Fig. 5. X -Axis Spectral GEDEM vs Gait Velocity scatter plot (left) and whisker plot (right).
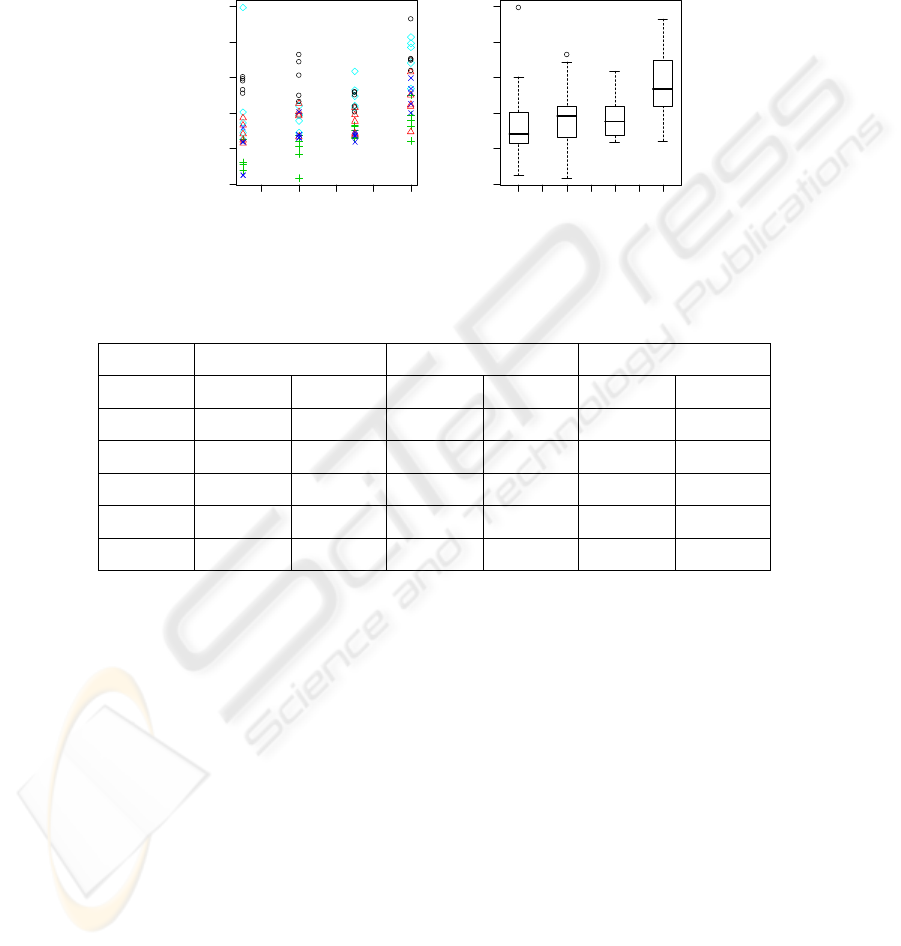
Table 3. X,Y,Z -Axis Spectral GEDEM Value vs Velocity Linear Model Coefficients.
X-Axis Spectral GEDEM Y-Axis Spectral GEDEM Z-Axis Spectral GEDEM
Name Intercept Gradient Intercept Gradient Intercept Gradient
AS 0.1709 0.06568 1.733 -0.243 1.681 -0.371
MI -0.4487 0.07911 1.059 0.008 1.609 -0.444
MS -1.0123 0.1318 1.09 -0.092 1.244 -0.411
PP -0.9658 0.15675 1.36 -0.096 1.356 -0.387
ZA -0.4489 0.15491 1.171 0.092 1.336 -0.293
Table 3 presents the gradients of a linear model for each subject. This index could be
used to determine a velocity that the subject is comfortable with.
4.5 Y axis Spectral GEDEM
This index represents the dispersion of the power spectrum in the lateral movement
axis (y-axis) – on the transverse plane perpendicular to the movement. This index is
lower if the number of frequency components which are important is less (i.e. when
the movement is constant and at a certain rhythm). If there are significant changes in
the rhythm then the index will increase.
9
34567
0.0 0.5 1.0 1.5 2.0
Velocity [km/h]
Spectral GEDEM Y Axis [Nats]
(2.5,3.14] (4.43,5.07] (6.36,7]
0.0 0.5 1.0 1.5 2.0
Velocity [km/h]
Spectral GEDEM Y Axis [Nats]
Fig. 6. Y-Axis Spectral GEDEM vs Gait Velocity scatter plot (left) and whisker plot (right).
Fig. 6 presents the Y-axis Spectral GEDEM values vs the gait velocity. There appear
to be totally different trends in this graph between subjects. Others appear to increase
and other to decrease. Due to the limited number of samples it was not possible to
investigate a relationship, with other characteristics. This will be the subject of a
further study.
Table 3 presents the gradients of a linear model for each subject. One is almost
constant, two appear to increase and two to decrease.
4.6 Z axis Spectral GEDEM
This index represents the dispersion of the power spectrum in the vertical movement
axis (z-axis) – intersection of Coronar and Sagittal planes. This index is lower if the
number of frequency components which are important is less (i.e. when the move-
ment is constant and at a certain rhythm). If there are significant changes in the
rhythm then the index will increase.
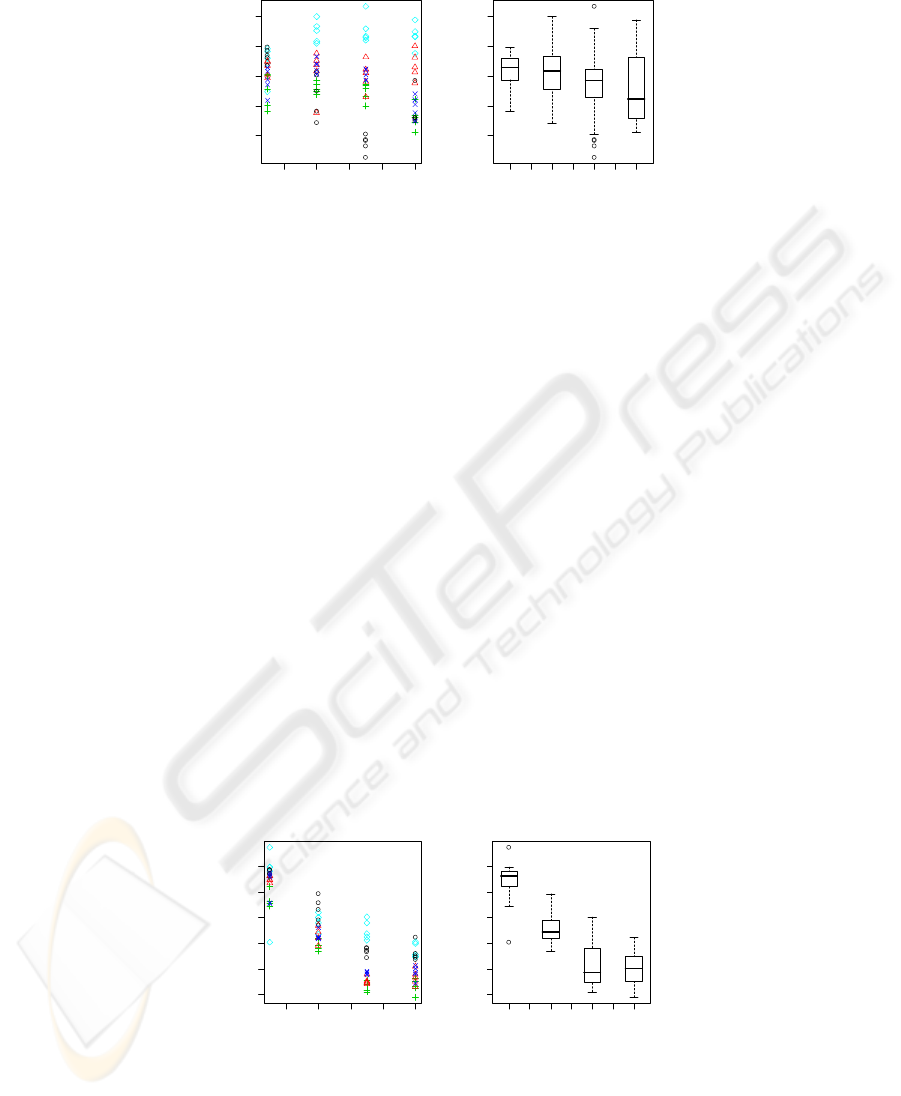
Fig. 7 presents the Z-axis Spectral GEDEM values vs the gait velocity. Up to 5.5.
[km/h], all subjects exhibit lower Z-axis Spectral GEDEM values with increasing
velocity. Beyond 5.5. [km/h] the metric appears to level or increase in some subjects.
It appeared that the movement on the treadmill beyond 4.0[km/h] was more regular
than the vertical movement below 4.0[km/h]. This metric could be used to identify a
velocity that the subject is comfortable with.
Table 3 presents the linear model gradients of Z-axis Spectral GEEM for each sub-
ject. The gradient values appear to be decreasing with values between -.29 and -.45.
34567
-1.5 -1.0 -0.5 0.0 0.5 1.0
Velocity [km/h]
Spectral GEDEM Z Axis [Nats]
(2.5,3.14] (4.43,5.07] (6.36,7]
-1.5 -1.0 -0.5 0.0 0.5 1.0
Velocity [km/h]
Spectral GEDEM Z Axis [Nats]
Fig. 7. Z -Axis Spectral GEDEM vs Gait Velocity scatter plot (left) and whisker plot (right).
10

4.7 Implications
Until now there was no understanding of the velocity effect on the GEDEM meas-
urements. Through this work, the effect has been clarified. Also it was identified that
a linear model between the measurements can be a good approximation in certain
cases. Therefore a method for translating measurements to other velocities and com-
paring is possible.
Also some of the indexes with respect to the velocity exhibited inflection points.
This is attributed to velocities that corresponded to measurements that the subject
appeared to be more comfortable. As a result these indexes could be used to develop
a methodology for identifying the normal gait velocity. However this is beyond the
scope of this work.
5 Conclusions
This work presents the effect of gait velocity on GEDEM values. One of the problems
until now was that it was not possible to compare measurements at different veloci-
ties.
Five subjects were measured. The subjects walked on a treadmill at 4 different ve-
locity levels (2.5, 4 and 5.5 and 7km/h) and the accelerations were obtained. There
was statistically significant evidence that the gait velocity influences the GEDEM
values. In all cases a point of inflection appeared. The gradient of GEDEM index vs
velocity appeared to be consistent and is possible to use the results for comparing
GEDEM measurements at different velocity rates. Also this work maybe used to
standardise a measurement protocol.
Acknowledgements
The authors of that paper would like to acknowledge the financial help from the
medical company Ygiea and the PENED project 03ED966 of GSRT under Measure
8.3 of the Operational Program "Competitiveness" of 3
rd
CSF
References
1. Christakis, D. & Papadakis, N. (2008). “A continuous random variable differential entropy
calculation method” (Tech. Rep. No 61). Greece: Technological Education Institution of
Crete, Wind Energy and Energy Systems Synthesis Laboratory.
2. Nikos Papadakis, G. N. Tzagarakis, D. G. Christakis, N. A. Kampanis, K. N. Stergiopoulos
& P. G. Katonis “Entropy as a Spinal Stenosis Detection Parameter”, submitted July 2008
3. Stylianos D. Tsivgoulis, Nikolaos C. Papadakis;Konstantinos Condaxakis, Nikolaos Kam-
panis, Dimitrios Christakis, Pavlos Katonis “Evaluation of gait pattern in healthy soccer
11

athletes with the use of accelerometry, Medicine and Science in Sports and Exersice, sub-
mitted August 2008
4. Archimedes II- project 2.2.16, Technical Report [2006]
5. D Christakis, C. Stergiopoulos, P.Katonis, N.Kampanis, N.Papadakis, X.Babouranakis,
S.Tsivgoulis “Entropic kinesiometry: a new evaluation method for the muscosceletal sys-
tem of athletes”, 62 Panhellenic Orthopaedic Conference, Athens, Greece, October 2006
(abstract and presentation in Greek)
6. D Christakis, C. Stergiopoulos, M Drettakis, D.Poulis, C. Contaxakis N.Papadakis,
X.Babouranakis, S.Tsivgoulis “Entropic Kinesiometry: a new muscosceletal evaluation
method”, 13 PanCretan Medical Conference, Heraklion, Greeece, November 2006
7. Papadakis, N., Tzagarakis G, Christakis. D. (2008). “ Jetstream JBM 4355Treadmill vs
Ground Comparison report of GEDEM measurements on 24 Jan 2008” (Tech. Rep. No
107). Greece: Technological Education Institution of Crete, Wind Energy and Energy Sys-
tems Synthesis Laboratory..
8. Papadakis, N., Tzagarakis G, Christakis. D. (2008). “ Body Sculpture BT3130 Treadmill vs
Ground Comparison report of GEDEM measurements” (Tech. Rep. No 109). Greece:
Technological Education Institution of Crete, Wind Energy and Energy Systems Synthesis
Laboratory..
9. Arif, M., Othaki, Y., Nagatomi, R., Ishihara, T., & Inooka, H. (2004). Estimation of the
effect of cadence on gait stability in young and elderly people using approximate entropy
technique. Measurement Science Review, 4 (2), 29-44.
10. C.E. Shannon, "A Mathematical Theory of Communication", Bell System Technical Jour-
nal, vol. 27, pp. 379-423, 623-656, July, October, 1948
11. Christakis, D. (1989). Entropy of harmony. Symposium of “Culture and Technology”,
Chania, Crete, Greece.
12. Christakis, D. (1992). The society of production and the society of creation. Proceedings of
the “Society, Technology and Reformation of Production” Symposium. Technical Univer-
sity of Crete.
13. Christakis D. (2005) On the definition of technergia and the relation between production
and creativity. Proceedings of the 2nd International Exergy, Energy and Environment
Symposium (IEEES2), 3 - 7 July, 2005, Kos – Greece.
14. Pincus, S. (1991). Approximate entropy as a measure of system complexity. Proceedings of
the National Academy of Sciences of the United States of America, 88, 2297–2301.
15. Arif, M., Othaki, Y., Nagatomi, R., Ishihara, T., & Inooka, H. (2002). Analysis of the
Effect of Fatigue on Walking Gait Stability. Proceedings of International Symposium on
Micromechatronics and Human Science. IEEE.
16. Arif, M., Othaki, Y., Nagatomi, R., Ishihara, T., & Inooka, H. (2002b). Walking gait stabil-
ity in young and elderly people and improvement of walking stability using optimal ca-
dence. Proceedings of International Symposium on Micromechatronics and Human Sci-
ence. IEEE.
17. Kavanagh, J., Barrett, R., & Morrison, S. (2005). Age-related differences in head and trunk
coordination during walking. Human Movement Science, 24, 574–587.
18. Auvinet, B., Chaleil, D. & Barrey E. (1999). Accelerometric gait analysis for use in hospi-
tal outpatients. Rev. Rhum., 66, 389-97.
19. Hellebrandt, F.A., Tepper, R.H. & Braun, G.L. (1938). Location of the cardinal anatomical
orientation planes passing through the center of weight in young adult women. American
Journal of Physiology, 121 (2) 465- 470.
20. Smidt, G.L., Arora, J. & Johnston, R.C. (197l). Accelerographic analysis of several types
of walking. Am. J. Phys. Med., 50 (6), 285-300
12
