
Mammographic Density Classification
based on Local Histograms
Rafael Llobet
1
, Juan A. Solves
1
, Juan C. Perez-Cortes
1
and Francisco Ruiz-Perales
2
1
Instituto Tecnol´ogico de Inform´atica
Universidad Polit´ecnica de Valencia, Camino de Vera s/n, 46071 Valencia, Spain
2
Conseller´ıa de Sanitat. Comunitat Valenciana, Valencia, Spain
Abstract. In this work, the task of classifying mammograms according to breast
density is studied using a local-histogram-based feature extraction method and
a non-parametric classification scheme. Breast density estimation is important
due to its association with a higher risk of cancer and an increased difficulty of
diagnosis. 322 images from the Mammographic Image Analysis Society (MIAS)
Database have been analyzed, and the density prediction accuracy of the method
has been assessed. The obtained results show an agreement of 77.96% between
automatic and expert radiologist manual classification.
1 Introduction
Breast cancer is a leading cause of cancer-related mortality in women. Some studies
have estimated that approximately 12.6% of women will develop breast cancer during
their lifetime [1]. Early detection of cancer is extremely important as only an early
treatment will cure the disease in a significant number of cases.
Mammographic screening programs are currently an effective method to detect
breast cancer at an early stage, because they allow the identification of tumors before
being palpable. Nevertheless, it is not trivial for a radiologist to interpret correctly a
mammogram due to the extremely wide variation in the mammographic appearance
of normal and abnormal tissue of the breast. In fact, only 15 to 35% of women with
radiographically-suspiciousnon-palpable lesions who are subject to a biopsy, show ma-
lignancy after histological analysis [2, 3]. On the other hand, some incipient tumors
can remain undetected after a radiography has been examined, which makes difficult
a successful treatment. Retrospective studies have shown that, in current breast cancer
screening, 10% to 25% of the tumors are missed by the radiologist [4,5].
In case of dense breasts, the diagnosis is even more difficult, because dense tissue
has similar X-ray attenuation than some type of tumors. Therefore, dense breast tissue
can obscure a lesion. In addition to the difficulty involved in the detection of certain
types of tumors in dense breasts, some studies have demonstrated a correlation between
dense tissue and the risk of developing cancer [6–8]. The risk of breast cancer asso-
ciated with mammographic density is larger than almost all other risk factors for the
disease. Women with dense breasts are at four-to-six-fold higher risk than those with
primarily fatty breasts [9,10,8].
Llobet R., Solves J., Perez-Cortes J. and Ruiz-Perales F. (2009).
Mammographic Density Classification based on Local Histograms.
In Proceedings of the 1st International Workshop on Medical Image Analysis and Description for Diagnosis Systems, pages 85-90
DOI: 10.5220/0001813600850090
Copyright
c
SciTePress

Since the discovery of this relationship, several metrics for breast density classifi-
cation have been proposed: Wolfe’s four parenchymal patterns [6, 7], Tabar’s five pat-
terns [11], Boyd’s six class categories [8] and BI-RADS [12].
Regardless of the method employed to classify and estimate the mammographic
density, this measure is of major importance as it could influence the choice of alter-
native screening paradigms, such keeping short the intervals between mammograms,
using other modalities such as magnetic resonance imaging (MRI), or to signal the
need for more careful interpretation of the mammogram, as double-reading. However,
all these methods based on the radiologists’ assessment present a major drawback: the
subjectiveness in the categorization.
Computer-assisted measurement of breast density has been studied in the last few
years in an attempt to obtain more objective risk assessments. Boyd et al. [8] proposed
a semiautomatic method based on interactive thresholding which computes the percent-
age of the segmented dense tissue over the segmented breast area. Jamal et al. [13] de-
scribed a similar technique and compared the semi-automatic assessment of breast den-
sity with Tabar patterns. Karssemeijer [14] developed an automated method where fea-
tures are calculated from gray level histograms computed in different regions in which
distance to the skin line is approximately equal, and then classified using the k-nearest
neighbor (k-NN) rule. Saha et al. [15] described a method using a scale-based fuzzy
connectivity approach. Klifa [16] et al. developed a segmentation technique based in
fuzzy clustering to quantify breast density from MRI data. Oliver et al. [17] suggested
an approach based on gross segmentation and the extraction of texture features of pixels
with similar tissue appearance. This work was extended in [18] where a Fuzzy C-Means
clustering approach was used for gross segmentation. Muhimmah et al. [19] used a fea-
ture extraction scheme based on a multiresolution histogram.
Segmentation of non-fatty tissue in mammograms appears to be more difficult than
one might think, due to large differences in appearance between different parenchymal
types [14]. In this sense, global thresholding techniques give limited results as mammo-
grams differing in their density can present similar global histograms and vice versa.
Our approach is based on local gray-level histograms and on a two-stage classifica-
tion scheme.
2 Dataset
In this work, the Mammographic Image Analysis Society (MIAS) Database [20] has
been used both to train and to evaluate the proposed method according to a leave-one-
out scheme.
The MIAS database contains 322 mammograms corresponding to the left and right
breasts of 161 patients. Each image has a resolution of 200µm per pixel and a size of
1024 × 1024 pixels. Mammograms have been subjectively classified by a radiologist
as fatty (F ), glandular (G) and dense (D), according to its parenchymal tissue. This
classification is what we consider the ground-truth. From the 322 mammograms that
contains the dataset, 106 correspond to class F , 104 to G and 112 to D. Figure 1 shows
a mammogram of each class.
86
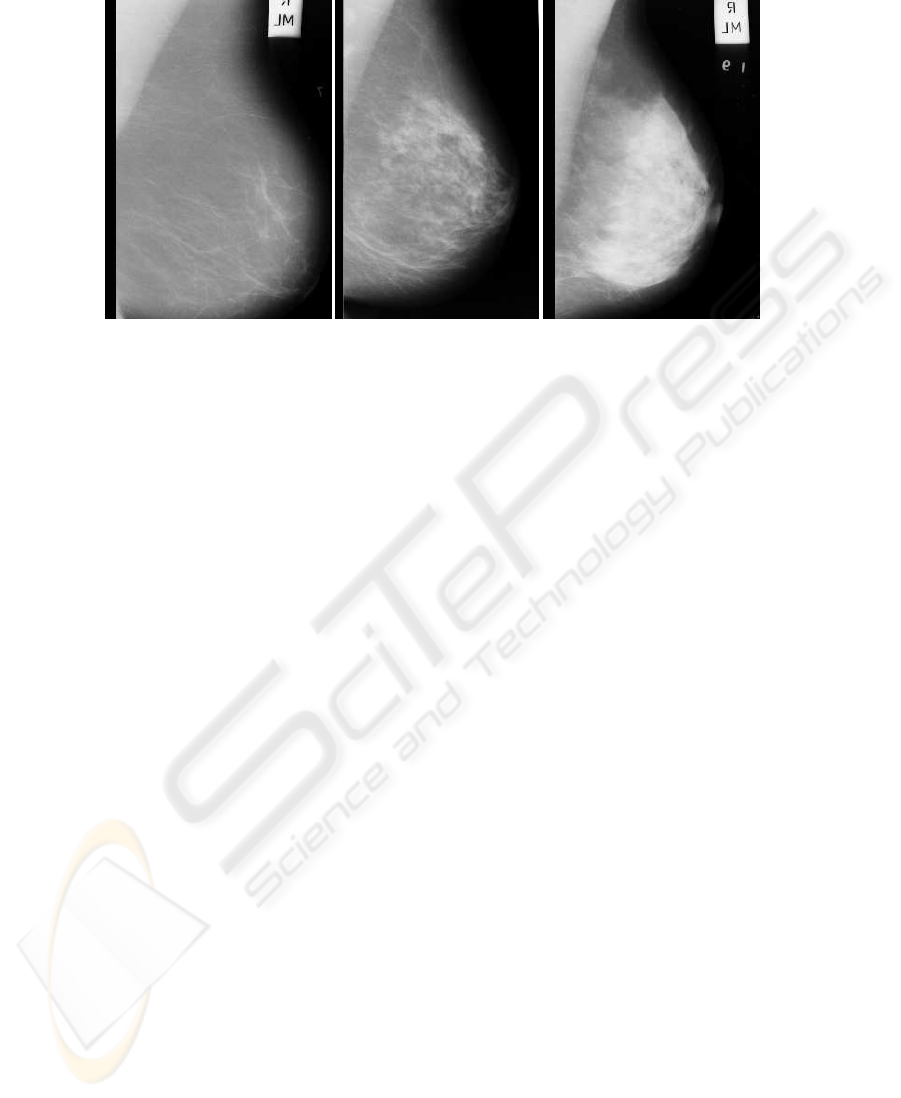
Fig.1. Three mammograms of different types in the MIAS dataset. (a) Fatty, (b) Glandular, (c)
Dense. The images have been cropped to show the region of interest.
It must be mentioned that this classification approach differs from that of Wolfe [6],
Tabar [11], Boyd [8] and BI-RADS [12] presented at section 1 which all used four or
more classes.
Fatty and dense tissue areas have not been segmented in each mammogram during
the labeling process. Instead, a single global label is assigned to the whole mammo-
gram.
3 Methodology
As mentioned before, only a single class label (F, G or D) is specified for each mam-
mogram. This means that ground-truth at pixel level (or local level) is not available and
therefore it is not possible to use a supervised method based on local features to train
the classifier. On the other hand, methods based only on global features tend to fail
due to high intraclass variability. In our approach, an unsupervised method for training
with local features, which assigns local labels to each region of the mammogram is
used. Then a supervised method where each mammogram is globally represented by a
histogram of local labels is applied. This process is shown in Figure 2.
In a first process, the breast is manually segmented from the background of the
mammogram. In this process, the breast is separated from other objects present in the
mammography:black background, labels and the pectoral muscle. Although this can be
automatically performed [14], in this work we have relied on a manual segmentation to
avoid any contribution of segmentation errors to the results.
In the training phase, local features are first extracted from each image in the train-
ing set. For this purpose, a local window of 40x40 pixels is shifted along the breast
region and the gray level histogram is computed at each position of the window, pro-
ducing a local feature vector for each local window. To make these features invariant
to acquisition parameters, breast thickness or other factors non-related with parenchy-
mal type, histograms are stretched over the range [0 − 31]. With this operation we give
87

Test
Training
Training images
Test image
Global
model
Global feature vectors
Classification
Hypothesis
Global
extraction
feature
model
Local
Clustering
Cluster labelsLocal feature vectors
extraction
feature
Local
segmentation
Breast
Classification
Local
Global feature vectorsLocal feature vectors
feature
extraction
Breast
segmentation
Fig.2. Training and testing approaches proposed. In the first stage of training, local features are
extracted, and an unsupervised approach is used, whereas in the second stage global features
are extracted and a supervised method is applied. In the testing phase, a two-stage classification
scheme is used, firstly, to switch from local to global features and then to obtain a hypothesis.
more relevance to the contrast between different textures in the local window, rather
than the average gray level. In addition, histograms are conveniently reduced from 256
to 32− dimensional feature vectors to limit the contribution of noise and the intraclass
variance.
Then, the set of all local feature vectors is partitioned into n clusters using the k-
means algorithm. This yields what we call the local model. Finally, the number of local
feature vectors belonging to each cluster is computed for each mammogram. This yields
an n-dimensional vector per mammogram, representing the normalized n-clusters his-
togram. This is what we call the global features vector of the mammogram and the set
of all these vectors gives rise to the global model.
In the test phase, local feature vectors are computed in the same way as in the train-
ing phase. Then, local vectors are classified against the local model using the k-nearest
neighbors (k-nn) rule, which assigns a cluster label to each vector. Next, cluster labels
are counted to generate the normalized n-clusters histogram (global feature vector). Fi-
nally, this vector is classified against the global model using the k-nn rule again, which
gives an F-G-D hypothesis.
4 Experiments and Results
For the evaluation of the performance of our approach, the whole set of 322 mammo-
grams in the MIAS database was used. A leaving-one-patient-out technique has been
employed, guaranteeing that when a mammogram is being classified, all the prototypes
belonging to the same patient are left out from the training set.
Experiments were carried out for different number of clusters. The best results were
obtained with 6 clusters. According to the classification in one of the three aforemen-
tioned classes determined by a radiologist, a success rate of 77.96% was obtained. The
“Major classification error rate” (confusion between classes F and D) was only 1.24%.
Among major errors, 75% (3 out of 4) are due to misclassifying a dense mammogram
in class F, while 25% (1 out of 4) are due to misclassifying a fatty mammogram in class
88

D. It must be said that, in a practical task consisting of detecting specifically the images
of dense breasts, misclassifying a dense mammogram in class F would be more serious
than misclassifying a fatty mammogram in class D.
Table 1 shows the confusion matrix obtained. Rows represent the hypothesis and
columns the ground truth.
Table 1. Confusion matrix for automatic classification and MIAS groundtruth.
Fatty Glandular Dense
Fatty 94 8 3
Glandular 11 67 19
Dense 1 29 90
Our approach has been compared with other published results using the MIAS
database. Table 2 summarizes these results. Muhimmah et al. [19] used a multireso-
lution histogram technique and a Directed Acyclic Graph - Support Vector Machine
(DAG-SVM) classifier. Oliver et al. [17] used a method based on gross segmentation
and the extraction of texture features of pixels with similar tissue appearance. A Deci-
sion Tree was employed for classification. Masek et al. [21] used average histograms of
each density class as features and a Euclidean distance measure.
Table 2. Comparison with published results using the MIAS database.
Author Agreement (%) Major errors (%)
Our approach 77.96 1.24
Muhimmah et al. 77.57 3.43
Oliver et al. 70.0 4.44
Masek et al. 62.42 −
Our method outperforms the existing techniques tested with the MIAS database,
and more importantly, major errors have been drastically reduced, which suggests that
most of the minor errors could be attributed to mammograms whose density are actually
in the frontier between two classes.
Also radiologists are reported to disagree on classifications. Some studies have
found an inter-observer agreement of 66 to 80% [14,18] in a 4-class test. Therefore,
a significantly higher agreement using automatic classification is probably not to be
expected.
5 Conclusions
Experimentsof classification of mammographicdensity using local gray-levelhistograms
and a two-stage classification scheme are presented. Using 322 images from the Mam-
mographic Image Analysis Society (MIAS) Database in a 3-class leaving-one-out test,
the results of 77.96% of agreement and 1.24% of major errors show an improvement
89

over other existing techniques. These results are probably at the same level that could
be expected for expert manual classification.
References
1. E.J. Feuer, L.M. Wun: DEVCAN: Probability of Developing or Dying of Cancer. Version
4.0. Bethesda MD: National Cancer Institute. (1999)
2. A.M. Knutzen, J.J. Gisvold: Likelihood of malignant disease for various categories of mam-
mographically detected, nonpalpable breast lesion. Mayo Clin Proc, Vol. 68 (1993) 454–460
3. D.B. Kopans: The positive predictive value of mammography. AJR, Vol. 158 (1992) 521–526
4. G.M. te Brake, N. Karssemeijer: Automated detection of breast carcinomas that were not
detected in a screening program. Radiology”, Vol. 207 (1998) 465–471
5. M. Wallis, M. Walsh et al.: A review of false negative mammography in a symptomatic
population. Clin Radiol Vol. 44 (1991) 13–15
6. J.N. Wolfe: Breast pattern as an index of risk for developing breast cancer. AJR, Vol. 126
(1976) 1130–1139
7. J.N. Wolfe: Risk for breast cancer development determined by mammographic parenchymal
pattern. Cancer, Vol. 37 (1976) 2486–2492
8. N.F. Boyd, J.W. Byng, R.A. Jong, et al.: Quantitative classification of mammographic densi-
ties and breast cancer risk: Results from tha Canadian national breast screening study. J. Nat.
Cancer Inst., Vol. 87 (1995) 670–675
9. A.F. Saftlas, R.N. Hoover, L.A. Brinton, et al.: Mammographic densities and risk of breast
cancer. Cancer, Vol. 67 (1991) 2833–2838
10. C. Byrne, C. Schairer, J.N. Wolfe, et al.: Mammographic features and breast cancer risk:
Effects with time, age and menopause status. J. Nat. Cancer Inst., Vol. 87 (1995) 1622–1629
11. I.T. Gram, E. Funkhouser, L. Tabar: The Tabar classification of mammographic parenchymal
patterns. Eur. J. Radiol., Vol. 124, (1997) 131–136
12. American College of Radiology (ACR): Illustrated Breast Imaging Reporting and Data Sys-
tem (BI-RADS). 3rd edn. Reston, VA: American College of Radiology, (1998) 167–181/
13. N. Jamal, K.H. Ng, L.M. Looi, et al.: Quantitative assessment of breast density from digitized
mammograms into Tabar’s patterns. Phys. Med. Biol., Vol. 51 (2006) 5843–5857
14. N. Karssemeijer: Automated classification of parenchymal patterns in mammograms.
Physics in Medicine and Biology, Vol. 43 (1998) 365–378
15. P.K. Saha, J.K. Udupa, E.F. Conant, D. Sullivan: Breast tissue density quantification via
digitized mammograms. IEEE Trans. on Medical Imaging, (8) Vol. 20 (2001) 792–803
16. C. Klifa, J. Carballido-Gamio, L. Wilmes, et al.: Quantification of breast tissue index from
MR data using fuzzy clustering. Proceedings of the 26th Anual International Conference of
th IEEE EMBS, San Francisco, CA, USA (2004) 1667–1670
17. A. Oliver, J. Freixenet, A. Bosch, et al.: Automatic classification of breast tissue. Lecture
Notes in Computer Science, Vol. 3523 (2005) 431–438
18. A. Oliver, J. Freixenet, R. Marti, et al.: A novel breast tissue density classification method-
ology. IEEE Trans Inf Technol Biomed., Vol. 12 (2008) 55–65
19. I. Muhimmah, R. Zwiggelaar: Mammographic density classification using multiresolution
histogram information. Proceedings of the International Special Topic Conference on Infor-
mation Technology in Biomedicine, (2006)
20. J. Suckling, J. Parker et al.: The mammographic images analysis society digital mammogram
database. Exerpta Medica. International Congress Series, Vol. 1069 (1994) 375–378
21. M. Masek, S.M. Kwok, C.J.S. deSilva et al.: Classification of mammographic density using
histogram distance measures. Proceedings of the World Congress on Medical Physics and
Biomedical Engineering, (2003)
90
