
Semi-Automatic Modeling of Bones for Real-Time
Surgery Support
Roger Cuypers, Benjamin Weyers and Wolfram Luther
Insititute of Computer Science and Cognitive Science, University of Duisburg-Essen
Lotharstr. 65, Duisburg, Germany
Abstract. Model-based reconstruction of human bones for surgical purposes is
an upcoming field of research in informatics and kinematics. Tools for planning
surgeries and real-time support require appropriate mathematical models for
rendering, interacting and reconfiguration. It is our conviction that superquad-
rics offer this powerful mathematical modeling capability. Image-based data
from MRI and X-ray examinations have to be extracted and gathered to 3D-
point sets, which are afterwards fitted by superquadric-based models. The fit-
ting process is complex and time-consuming. To solve this problem and to pro-
vide real-time simulation for surgical support, it is necessary to apply the
knowledge of the expert user. This paper presents the concept and a prototypi-
cal implementation of an interactive system that involves the user in the fitting
process to accelerate the calculation and enhance the resulting model.
1 Introduction
Recently, computer-based pre-operative planning has come to be considered a very
important practice for giving the surgeon a detailed understanding of the complex
interior body structure and the effects of possible treatment approaches. For this rea-
son, methods and models for manipulating and processing components of the human
skeletal system in an intuitive and efficient manner have become a topic of practical
importance in the development of appropriate computer-based skeletal crafting and
simulation tools.
One of the drawbacks of existing tools is the fact that most of them are still
closely oriented towards traditional generic computer-aided construction applications
that allow only simple navigation and surface manipulation using primitive geometric
shapes. The resulting modeling reflects neither the topology of the bone nor the inten-
tions of the surgeon sufficiently.
This paper presents a task-oriented, computationally efficient and flexible geo-
metric modeling approach for a skeletal component classification, reconstruction and
manipulation tool together with an effective interface that exposes the capabilities of
the model to the user in an intuitive manner.
Cuypers R., Weyers B. and Luther W. (2009).
Semi-Automatic Modeling of Bones for Real-Time Surgery Support.
In Proceedings of the 1st International Workshop on Medical Image Analysis and Description for Diagnosis Systems, pages 13-23
DOI: 10.5220/0001814000130023
Copyright
c
SciTePress

2 Prior Research
The generation of customized geometric models from 3D point cloud data has been
the subject of extensive research. In medical applications, the geometrical models
were mainly selected due to their capability of giving an exact reproduction of the
bone surface. Popular models are triangle meshes [8], [18] or octrees [14]. Martin et
al. [12] use B-spline surfaces to model a femur’s cortical and trabecular part. Kura-
zume et al. [9] use a statistical shape model whose parameters can be extracted from
two 2D fluoroscopic images. However, feature-extraction algorithms that make use of
these models receive very little beforehand-information about the global features of
the bone that help them with their tasks. Furthermore, overall handling of the recon-
structed models by the user is difficult due to their high number of parameters.
Of special interest are implicit superquadric (sq) models, which, due to their high
modeling power and their well-behaved mathematical nature, proved a powerful tool
for modeling even complex surface topologies. Originally invented by Barr in 1981,
the usage and capabilities were greatly improved in papers by Solina and Metaxas by
providing advanced deformation [6] and blending [16]. Zhou et al. [19] further ex-
tended the sq-model by replacing the exponents of the inside/outside function with
Bezier curve functions, thus making it possible to increase surface complexity to an
arbitrary level. Others tried to enhance accuracy by raising the number of components
within the model.
There are several approaches that target a fully automatic generation of sq-models
from scattered 3D point data. Chevalier et al. [3] introduce a split-and-merge ap-
proach to generate a composite model of several SQs. All these approaches are ge-
neric in nature and do not make use of any a priori knowledge that could improve the
result leading to an optimal approximation of the actual bone surface. A sophisticated
fitting approach that considers the specific bone geometries and allows basic user
interaction has been studied in the context of the ongoing PROREOP project and is
proposed in [4].
The special and complex geometric nature of the human bone requires a model-
generating process to gather as much information as possible about the object of
interest in order to generate an optimal result. This can best be achieved by providing
the user with the ability to influence the fitting process and the parameter flow. Since
the final application should be suitable for clinical environments, a comfortable user
interface is mandatory. Therefore, this paper introduces a sophisticated sq-based
selection tool that allows the user to intuitively steer the fitting process by helping the
system identify and classify the relevant data and parameters whenever necessary.
3 Bone Modeling
The aim of our research on human skeletal modeling was to produce a geometric
model of a given set of lower-limb bones that could later be used for kinematical
simulation. The model should be able to reproduce the bone surface as exactly as
possible while keeping the processing time short enough for real-time use. SQs offer
the power to model a great variety of shapes from only a few parameters, which
14

makes the search for appropriate parameter sets very efficient. Their dual implicit-
parametric nature also allows straight-forward rendering approaches using widely
available 3D programming interfaces like OpenGL.
3.1 Superquadrics
An SQ-surface is an implicit surface in 3D space that consists of all the points (x, y,
z) with [1]:
1
1
2
22
2
3
2
2
2
1
),,(
ε
ε
ε
εε
⎟
⎟
⎠
⎞
⎜
⎜
⎝
⎛
+
⎟
⎟
⎟
⎠
⎞
⎜
⎜
⎜
⎝
⎛
⎟
⎟
⎠
⎞
⎜
⎜
⎝
⎛
+
⎟
⎟
⎠
⎞
⎜
⎜
⎝
⎛
≡
a
z
a
y
a
x
zyxF
= 1 .
(1)
The parameters a
1
, a
2
and a
3
specify the scale of the shape in x, y and z direction, and
ε
1
and ε
2
define its roundness. This surface can be fitted to a 3D point cloud by mini-
mizing a distance function that measures the proximity of the points to the surface.
The distance function is defined by the radial Euclidean distance between a point and
a superellipsoid, which reads as:
d( A, x, y, z ) = F
ε
1
(x, y, z) - 1 .
(2)
where A is the surface, (x, y, z) are the points and F is the inside-outside function
from formula (1) that yields 1 for points that lie on the surface, < 1 for points that lie
inside and > 1 for points that lie outside the shape.
Next to the simple superellipsoidal model in Formula 1, a supertoroidal model
supports toroidal shapes. Additionally, Solina [6] proposes an extended SQ model
supporting tapering and bending. This allows for the modeling of a greater class of
shapes, which benefits the design of bone representations introduced in the following
section.
3.2 Superquadric Fitting
To fit an SQ to a set of 3D data points, it is necessary to determine a set of model
parameters for which the distance between the SQ surface and the point cloud is
minimized. The method used in this paper was introduced by Solina [15] and repre-
sents a least squares fit that minimizes the sum expression in Formula (3) which
measures the radial euclidean distance defined according to formula (2)
()
2
1
321
1),,(min
1
∑
=
−
n
i
iii
A
zyxFaaa
ε
.
(3)
where n is the number of input 3D points. This nonlinear optimization task is solved
by using a sequential quadratic programming method.
15
In order to optimize the quality of the fit, three conditions must be met:
The initial guess for the parameter set should already be close to the actual val-
ues; the algorithm used performs a local optimization.
The selection of the point cloud fragment serving as input should span the tar-
get geometry as exactly as possible.
The selection should resemble a shape that can be closely approximated by an
SQ.
To achieve this goal, the semi-automatic approach introduced in this paper includes
an extended selection tool that allows the user not only to define outlines that resem-
ble simple geometrical objects, like cubes or spheres, but also to use true sq-shapes
for the selection. This improves the fit, firstly, by delivering an area with an optimal
sq-shape and, secondly, by providing a parameter set that represents a close initial
surface approximation. The complete procedure of the interactive fit together with the
user interface is described in section 4 (below).
3.3 Superquadric Bone Modeling
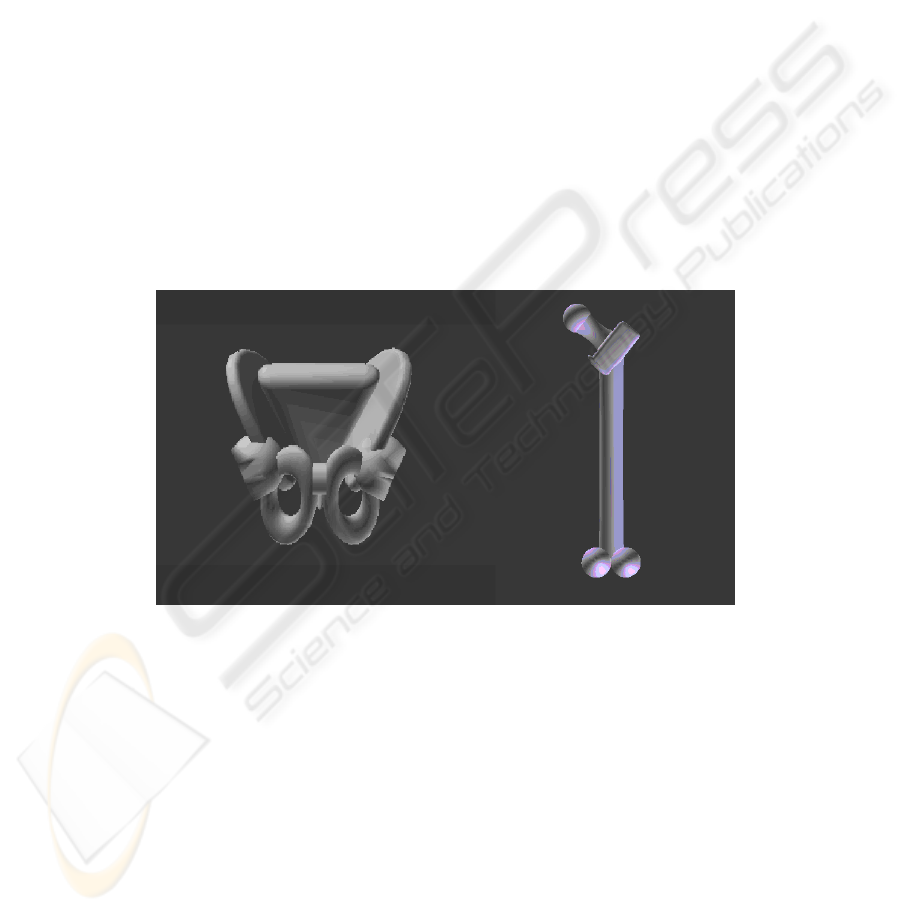
Fig. 1 shows implemented versions of the generic femur and hip models.
Fig. 1. Generic SQ models of hip and femur.
The bones are decomposed into several SQ primitives oriented in an analytic descrip-
tion of the bone shapes supplied by Goldfinger [5]. Each bone model is therefore
reconstructed by fitting the SQs from the generic model to the 3D point clouds repre-
senting the respective parts of the bone. To perform this task, the significant bone
parts are labeled beforehand, either by a fully automatic approach (which several tests
have found unreliable) or by a semi-automatic approach, which is introduced in sec-
tion 4 (below).
16
4 Interactive Fitting Process
In order to optimize the described fitting algorithm (section 3.2), we developed an
interactive pre-fitting process, which is introduced in this section. This interactive
process involves the following two major aspects:
1. The
decomposition of a given 3D point cloud into fragments, which includes (a)
the definition of point sets approximating the target geometry as exactly as possi-
ble and (b) the identification of ideal initial values for the fitting algorithm.
2. The classification of several parts of the geometrical model, which provides in-
formation necessary for the calculation of characteristic bone features like those
listed in Table 1.
Table 1. A selection of characteristic features from the femur and hip bone.
Femur Hip
Femur axis origin ASIS position
Femur axis direction PSIS position
Femur head center Hip joint center (left, right)
Femur head diameter Pelvis origin
Greater trochanter tip Pelvis orientation
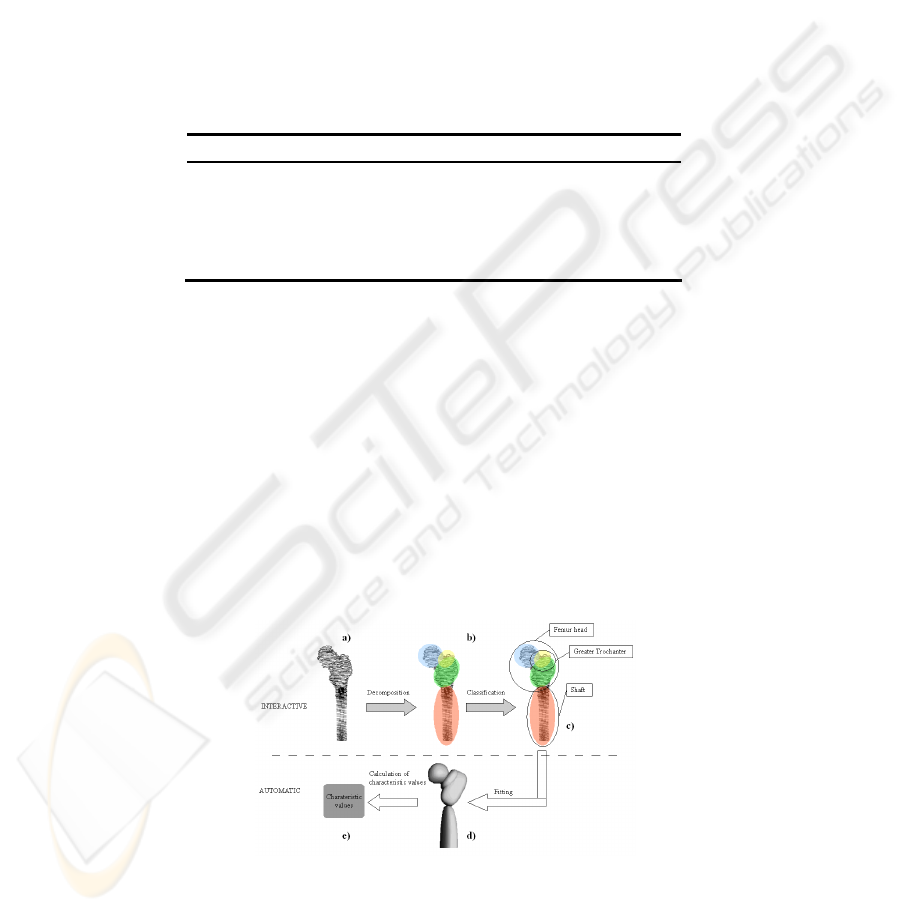
Fig. 2 shows how decomposition and classification are integrated in an interactive
workflow. Beginning with a data cloud of 3D points, the user starts by defining sub-
sets of points that are close to a functional fragmentation of the bone (as shown in
Fig. 1 for the femur: femur head as sphere, femur shaft as cylinder etc.) and a possible
model based on sq-geometries (section 3.1). To this end, we have implemented an
interactive selection tool based on an sq-geometry. After finishing the decomposition,
the user classifies the subsets according to the individual functions of the bone parts.
This classification is comparable to a tagging operation in a tagging system [11].
After the classification step in the workflow, the user’s task is to start the auto-
matic fitting process. The fitting algorithm first extracts information from the interac-
tive process and then calculates the sq-model for the given bone (section 3.3). From
the geometric model, the characteristic values are automatically extracted and pre-
sented to the surgeon.
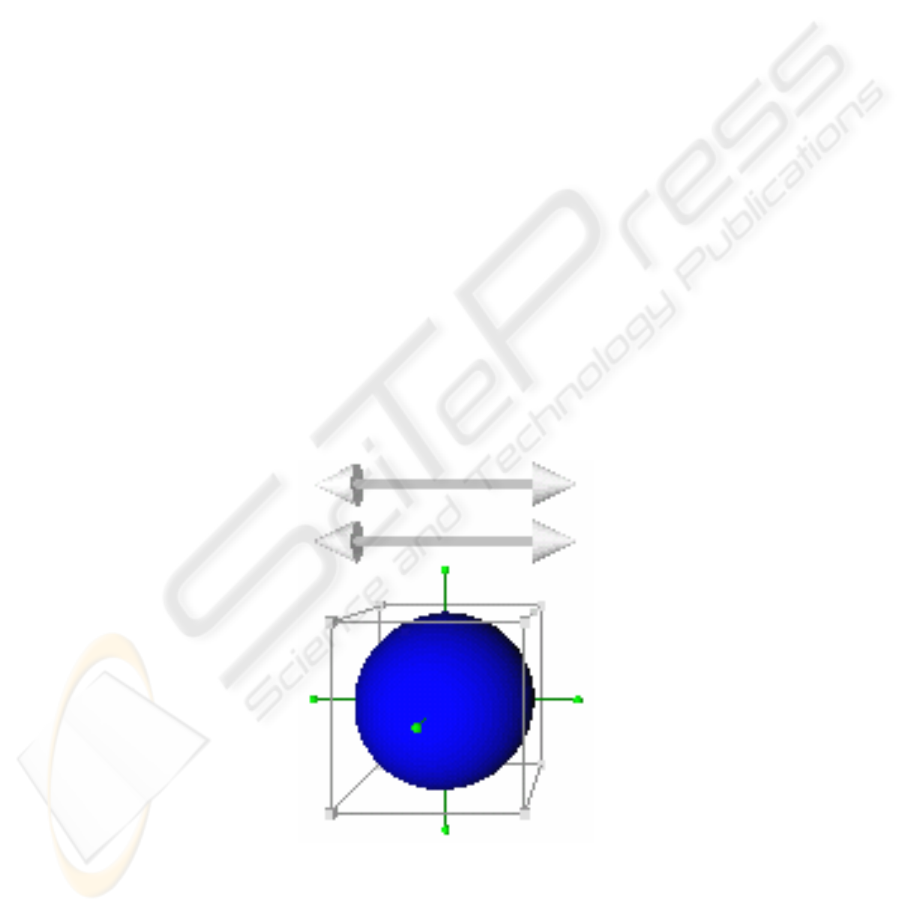
Fig. 2. Selection tool, based on the basic sq-model.
17
4.1 Data Decomposition
The main aim of data decomposition in the context of surgical support and modeling
of bones from patient data (CRT or X-ray images) is the identification and fragmenta-
tion of the bone into its functional parts. A fully automatic approach to the identifica-
tion resulted in a less precise and unsatisfying fitting result (see section 5, below).
Therefore, the data decomposition in the process is a candidate for user intervention
(shown in Fig. 2), resulting in a more efficient and precise fitting result.
For the manual decomposition of the initial point cloud (Fig. 2, [a]), which results
from a prior segmentation process, the user interface has to offer an interactive selec-
tion tool feasible for a 3D environment. Like a spoon, the tool should separate a sub-
set of the initial point cloud using basic drag-and-drop operations combined with
transformation operations, like scaling and deforming the shape of the tool. Based on
the 3D engine for mechanical multi-body modeling and simulation called MOBILE
[7], we have developed selection tools that consist of an SQ paired with the complex
dragger component of the Inventor [17] library shown in Fig. 3. This implementation
combines several operations, including translation, rotation and scaling, on an sq-
model that result in a tool for precise positioning and selection in a 3D point cloud.
There are several reasons for using an sq-geometry in the tool. First, the geometry is
closely connected to the fitting process because the result of the fitting is a bone,
modeled as a set of SQs. By using SQs for selection, the fitting algorithm is initial-
ized with an adequate SQ (see section 3, above). Second, it is easy to test whether a
point in the point cloud belongs to the selected subset or not using the SQ’s inside-
outside function (see equation 1). Evaluating the inside/outside function which re-
quires only few parameters is much more efficient than testing a point’s position
against complex surfaces like B-spline or free-form surfaces, making this tool spe-
cially suited for achieving real-time processing.
Fig. 3. Selection tool, based on the basic superquadric model.
18
Depending on their definition, SQs have additional parameters that influence their
shapes. For the basic sq-model introduced in section 3 (see above), the parameters
1
ε
and
2
ε
define the roundness. Therefore, our selection tool shown in Fig. 3 offers
two 3D-dragger widgets for manipulation.
For each of the two above-mentioned models, the basic one and the deformable
one, an adequate selection tool has been implemented that grants access to all of the
model’s parameters. Each change to a parameter immediately updates the tool’s
shape. Due to the low complexity of the mathematical model, this update can be
achieved in real-time on state-of-the-art, especially with a high-end GPU-
implementation.
After selecting an area of the point cloud by having the SQ surround it, the user
presses a button to create the input-subset for the fitting algorithm. The resulting
information from this selection process is (a) the point-subset on which one SQ
should be fitted and (b) a set of initial sq-parameters directly given by the tool itself.
This approach supersedes the automatic fragmentation of the original point cloud
because of the expert knowledge of the user. It results in a faster and more precisely
fitted sq-model. Fig. 2 and 3 provide a comparison of a manual measurement ap-
proach with the semi-automatic approach using the additional data described.
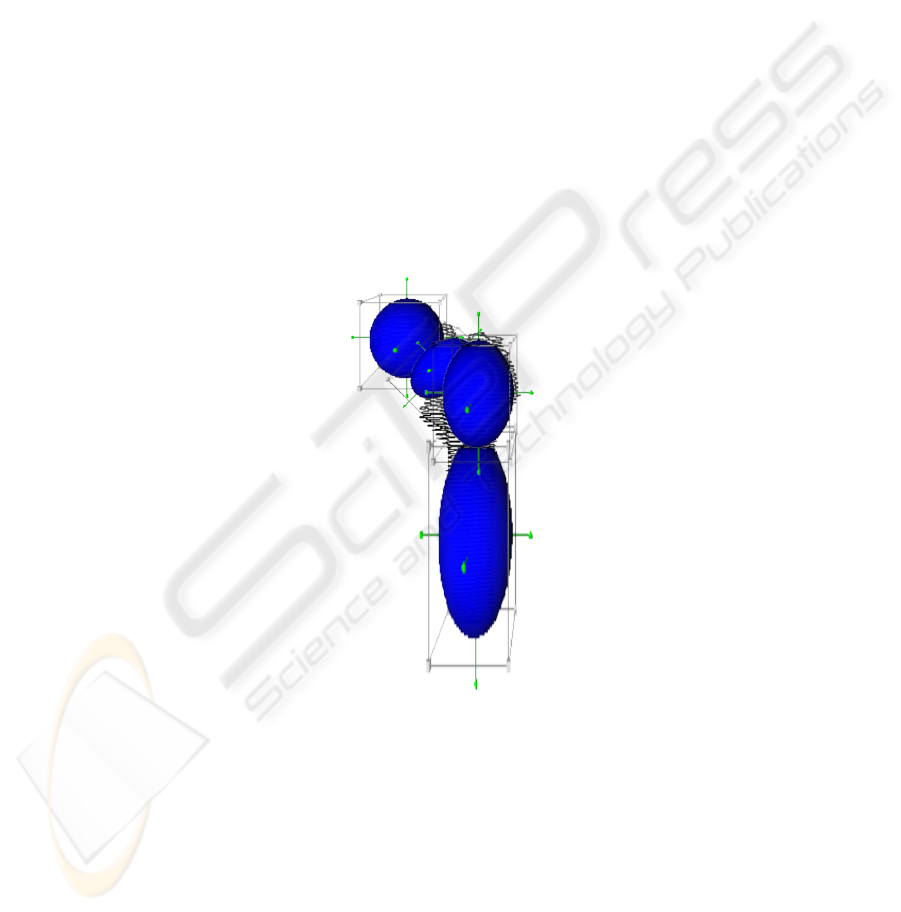
Fig. 4. Example of finished data decomposition.
4.2 Component Classification
Classification of the defined point subsets in the sq-model is closely related to the
data decomposition step. After creating the subset, the user can classify the selected
part of the bone by choosing an identifier out of a list (see Figure 2 [c]). This step is
19
similar to the one used in a tagging system when the user connects data content with
computer-readable semantic information (tags). Classification is mainly used (a) as
additional information for the fitting algorithm and (b) to provide a subordinated
calculation of the characteristic features of the bone being examined.
Table 1 shows a
selection of the characteristic features of a bone that can be extracted using the fitted
sq-model. To do this, component classification is necessary. In the context of surgical
support, it is of paramount importance that the system to be able to calculate those
values automatically in order to eliminate the time overhead otherwise required for
user interaction and to use mathematical models to verify accuracy. The quality of the
result depends on the correct classification of every part of a given bone in the model,
so that the system selects the appropriate parameter set to determine the features of
the bone at hand.
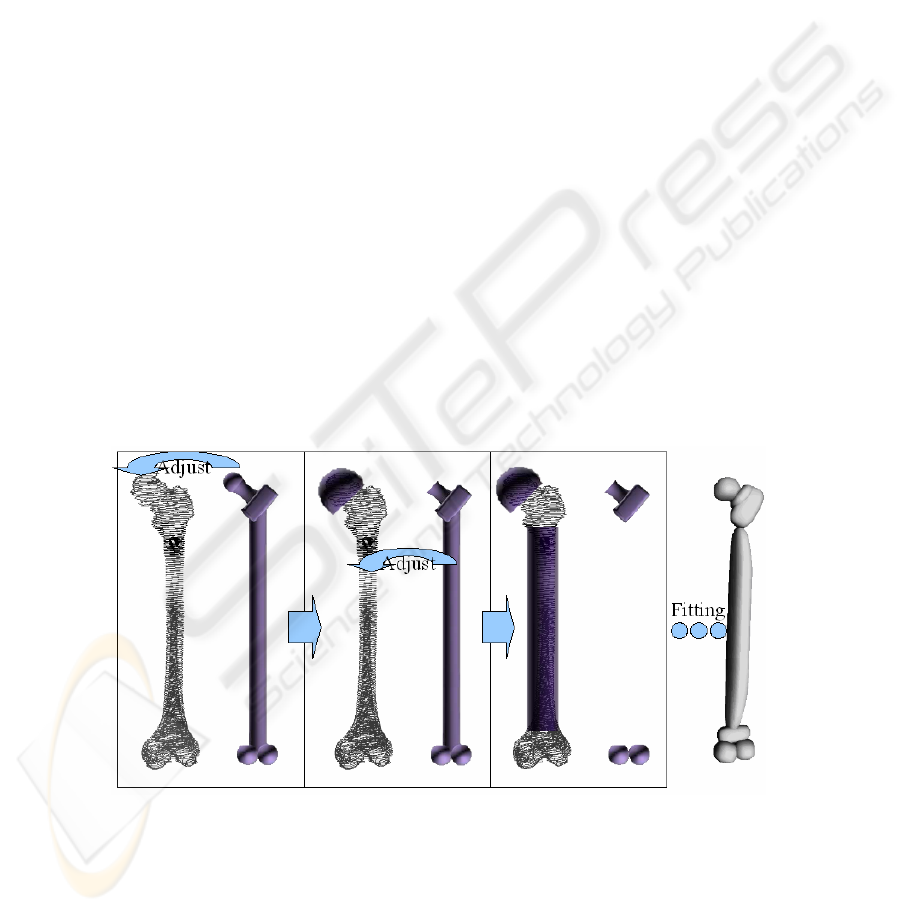
4.3 Combination of Data Decomposition and Classification
Fig. 5 shows the combination of the manual data decomposition and classification
operation by offering a basic bone model to the user. If the point cloud is segmented
from MRI images of a leg, for example, the user has to choose the standard model of
a leg. The same is true for every other bone in the human body (see Fig. 1). The clas-
sifications of all parts of the bone, like the femur head (Fig. 5), are previously con-
nected to the single SQ in the standard model.
After loading the standard model, the user matches each SQ of the standard model
to the point cloud by adjusting the parameters using the described tool (see section
4.1). In this way, data decomposition as well as component classification is combined
in a unique step without changing interaction tools or paradigms.
Fig. 5. One-step solution: an example of the data decomposition step for the femur.
20

5 Results
For testing the implementation, the decomposition and fitting procedures have been
performed on five sets of intact lower-limb bone data, each taken from a human pro-
band using MRI imaging. Each set consists of a hip bone and its two attached femoral
bones. Additional validation has been performed using two sets of pig bones of the
same type. Both selection tool models have been implemented and tested with the
patient data as input. Due to space constrains we only list the results of two exem-
plary components, although the remaining result does not significantly differ. The
first represents a human pelvis bone, the second an attached femoral bone. As can be
seen, the absolute error between the manual and semi-automatic approaches is only a
few millimeters or even less, meaning that the result comes close to established clini-
cal standards while saving time that might otherwise be spent on user-interaction.
Errors are mainly caused by ambiguities resulting from certain extreme-points lying
in comparatively flat surface areas where the SQ model’s approach would choose
differently from the intuitive approach, yet quantitatively correctly. A fully automated
test was also conducted; however, the results included components that were far from
their actual position.
Table 2. Results from semi-automatic sq-fitting (femur, left, positions / lengths in m, directions
as vector).
Feature Manual method SQ-Method
Axis
(org / dir)
(-0,143, -0.358, -0,312)
(0.1395 -0.9901 0.0068)
(-0.1494, -0.3614, -0.3112)
0.1495, -0.988, 0.0364
Head center (-0,158 -0.12 -0.295) (-0.1584, -0.1226, -0.2985)
Head diameter 0.044 0.0422
G.Trochanter tip
position
(-0.184, -0.133 -0.347) (-0.1812, -0.13 -0.341)
Knee axis
(org / dir)
(-0.14, -0.565, -0.298)
(0.1013, 0.9948, 0.0001)
(-0.138, -0.57, -0.301)
(0.08, 0.9967, 0.0006)
Table 3. Results from semi-automatic sq-fitting (pelvis, positions and lengths in m, directions
as vector).
Feature Manual method SQ-Method
HJC
(left, right)
(-0.158 -0.12, -0.295)
(-0.168, -0.131, -0.113)
(-0.158, -0.123, -0.298
(-0.167, -0.132, -0.110
ASIS pos.
(left, right)
(-0.094, -0.06, -0.31)
(-0.104, -0.066, -0.088)
(-0.096, -0.054, -0.306
(-0.106, -0.051, -0.082
PSIS pos.
(left, right)
(-0.221, -0.051, -0.279)
(-0.229, -0.052, -0.132)
(-0.22, -0.051, -0.268
(-0.222 -0.055 -0.133
Pelvis origin (-0.168, -0.131, -0.113) (-0.167, -0.132, -0.110
Pelvis
orientation
),,( zyx
v
v
v
(0.999, 0.004, 0.0445)
(0.0034, 0.9999, -0.013)
(0.0445, 0.0134, 0.9989)
(0.9989, 0.004, 0.0445)
(-0.0034, 0.9999, -0.013)
(-0.0445, 0.0133, 0.9989)
21

6 Conclusions
In this paper, we have presented a prototype for an interactive system that supports
the surgeon in the sophisticated task of reconstructing a realistic model of the human
skeletal system from 3D point data. Our technique was based on presenting the user
with a powerful and efficient model to steer the reconstruction, classification and
manipulation process of the algorithms. It embeds the model into an easily accessible
tool that provides important information as desired to achieve an optimal result. Due
to the efficiency of the sq-model and the vast possibilities of parallelization, which
are discussed in [4], these techniques are suitable for real-time applications. Tables 2
and 3 show the first results using this approach in comparison with the “analogue” or
“by-hand” process used during surgery planning today.
Several enhancements to the existing approach are planned. First, more analytic
descriptions of a larger amount of limb components are needed to provide the user
with as many templates as possible for the bone component classification task. In the
longer term, it is planned to provide a model of the whole lower limb structure of the
human body. Furthermore, the geometric models will be improved to allow for cap-
turing finer topological details that result in an even more exact approximation of the
bones’ surfaces. For this, the components of the sq-formula, especially those that
influence overall curvature, will be brought to a more abstract level and, at the same
time, be replaced by smooth interpolating functions. Finally, the selection tool will be
improved in compliance with the additional capabilities of the enhanced models.
References
1. Barr, A.H., 1981. Superquadrics and angle-preserving transformations. IEEE computer
graphics and applications, 1:1, pp. 11–23.
2. Banégas, F., Jaeger, M., Michelucci, D.. Roelens, M., 2001. The ellipsoidal skeleton in
medical applications. In Proceedings of the sixth ACM symposium on solid modeling and
applications, ACM Press, pp. 30–38.
3. Chevalier, L., Jaillet, F., Baskurt, A., 2003. Segmentation and superquadric modeling of 3D
objects. In Journal of Winter School of Computer Graphics, WSCG'03, 11:2, Feb. 2003, pp.
232–239.
4. Cuypers, R., Tang, Z. Luther, W., & Pauli, J., 2008. Efficient and Accurate Femur Recon-
struction using Model-based Segmentation and Superquadric Shapes. Proceedings Tele-
health and Assistive Technologies ~ TeleHealth/AT 2008 - Editor(s): R. Merrell, R.A. Coo-
per 4/16/2008 - 4/18/2008 Baltimore USA, ACTA Press 2008
5. Goldfinger, E., 1991 Human anatomy for artists: The Elements of form, Oxford University
Press, New York.
6. Jaklič, A., Leonardis, A., Solina, F., 2000. Segmentation and recovery of superquadrics. In
Vol. 20 of Computational Imaging and Vision, Kluwer, Dordrecht.
7. Kecskeméthy, A., 1999. MOBILE Version 1.3. User’s Guide
8. Kršek P., Krupa P., 2003. Human tissue geometrical modelling, In: Applied Simulation and
Modeling, Calgary, CA, IASTED, 2003, pp. 357-362, ISBN 0-88986-384-9
9. Kurazume, R., Nakamura, K., Okada, T., Sato, Y., Sugano, N., Koyama, T., Iwashita, Y.,
Hasegawa, T., 2007. 3D reconstruction of a femoral shape using a parametric model and
22

two 2D fluoroscopic images. IEEE International Conference on Robotics and Automation,
pp.3002-3008, 2007
10. Muraki, S., 1991. Volumetric shape description of range data using "blobby model", Com-
puter graphics, 25:4, July 1991, pp. 227–235.
11. Marlow, C., Naaman, M., Boyd, D., Davis, M., 2006. HT06, tagging paper, taxonomy,
Flickr, academic article, to read. In HYPERTEXT ’06: Proceedings of the seventeenth con-
ference on hypertext and hypermedia, pp. 31–40, ACM, New York, USA.
12. Martin, T., Cohen, E., and Kirby, M, 2008. Volumetric parameterization and trivariate B-
spline fitting using harmonic functions. In Proceedings of the 2008 ACM Symposium on
Solid and Physical Modeling (Stony Brook, New York, June 02 - 04, 2008). SPM '08.
ACM, New York, NY, pp. 269-280.
13. Metaxas, D., DeCarlo, D., 1998. Shape evolution with structural and topological changes
using blending. IEEE transactions. Pattern recognition and machine intelligence, 20:11,
Nov. 1998, pp. 1186–1205.
14. Peng, X., Chi, X., Ochoa, J.A., Leu, M. C., 2003. Bone surgery simulation with virtual
reality. ASME DETC2003/CIE, Chicago USA, September 2-6 2003.
15. Solina, F., Bajcsy, R., 1990. Recovery of parametric models from range images: The case
for superquadrics with global deformations. IEEE transactions on pattern analysis and ma-
chine intelligence 12, pp. 131–147.
16. Terzopoulos, D., Metaxas, D., 1991. Dynamic 3D models with local and global deforma-
tions: Deformable superquadrics. In Transactions on pattern analysis and machine intelli-
gence, 13: 7, July 1991, pp. 703–71.
17. Werneke, J., 1994. The Inventor Toolmaker: Extending Open Inventor. Addison Wesley
Pub Co Inc.2
nd
Edition.
18. Zheng, G., Dong, X., Rajamani, K.T., Xuan Zhang; Styner, M., Thoranaghatte, R.U.,
Nolte, L.-P., Ballester, M.A.G., 2007. Accurate and Robust Reconstruction of a Surface
Model of the Proximal Femur From Sparse-Point Data and a Dense-Point Distribution
Model for Surgical Navigation. Biomedical Engineering, IEEE Transactions on , vol.54,
no.12, pp.2109-2122,.
19. Zhou, L., Kambhamettu, C., 1999. Extending superquadrics with exponent functions:
Modeling and reconstruction. In CVPR99, pp. II: 73-78.
23
