
Remote Patient Monitoring in Home Environments
Paulo Gonçalves, José Torres, Pedro Sobral and Rui Moreira
Faculdade de Ciência e Tecnologia, Universidade Fernando Pessoa
Praça 9 de Abril, 349, Porto, Portugal
Abstract. The humanity is currently facing the difficulties of an aged society
with an ever-growing predominance of chronic diseases and associated
problems (e.g., mobility issues, possibility of falls, etc.). Traditional hospital or
clinical internment is not an efficient answer both in terms of human,
therapeutic or economical aspects. Alternatively, ambulatory and home
healthcare are becoming preferred and predominant solutions. However, the
typical home environment is not suited nor prepared for monitoring and helping
to take care of elderly and/or disabled people. To overcome some of these
issues, this paper proposes a wireless low cost hardware solution based on a
microcontroller with several sensors (cf. temperature, oxymeter, 3-axis
accelerometer) which allows monitoring several physiological parameters (e.g.,
temperature, heart bit, etc.) and infer human activities (e.g., standing, walking,
falling, etc.) of home confined people. A similar platform with ambient
temperature and light sensors was also created for monitoring the home
environment. The collected data is pre-processed on the sensor nodes and then
transmitted to a wireless gateway allowing the backend system to log the
patient activity, his health condition as well as the living surroundings. Finally,
a web application is provided to healthcare professionals for viewing, analyzing
and statistically operating this information, thus empowering homecare.
1 Introduction
As the average span of life increases, people at the age of 65 or older are the fastest
growing population in the world. According to the projections of an EUROSTAT
report [4], the median age of the European population will rise from 40.4 years in
2008 to 47.9 years in 2060. The share of people aged 65 years or over in the total
population is projected to increase from 17.1% to 30.0% and the number is projected
to rise from 84.6 million in 2008 to 151.5 million in 2060. The healthcare system in
the developed countries is growing under pressure and will not be efficient enough to
provide a reliable service on the health treatment for this aging population [9].
Even though wireless sensor networks research was initially driven by military
applications, more recently, the medical community is the one showing more interest
in the applicability of this technology to the development of telemedicine health care
systems. These systems use modern telecommunication and information technologies
to provide clinical care to remote located individuals. With more research progresses
in this field it will be possible to provide a better quality of life to patients while
reducing healthcare costs [11].
There are several issues that will lead to the use of telemedicine systems, e.g.,
Gonçalves P., Torres J., Sobral P. and Moreira R. (2009).
Remote Patient Monitoring in Home Environments.
In Proceedings of the 1st International Workshop on Mobilizing Health Information to Support Healthcare-related Knowledge Work, pages 87-96
DOI: 10.5220/0001818600870096
Copyright
c
SciTePress

critical shortages of medical staff, an increase in chronic illnesses or medical
conditions requiring continuous monitoring, a complex medical environment in which
diagnostic errors can contribute to raise hospital admissions, increased healthcare
costs and decreased access to healthcare providers, etc.
The requirements for reliability, flexibility and portability make wireless sensor
technologies particularly attractive for telemedicine applications [7]. Venkata-
subramanian et al identified the following challenges for developing a health
monitoring system using wireless sensor networks [9]:
Dependability (the ability of a system to be able to avoid service failures);
Long-term Data Collection (the capability to provide continuous data collection
facilities);
Energy Efficiency;
Real-time information Gathering;
Information Completeness (collected data has to be complete, allowing medical
staff to accurately diagnose the patient’s condition);
Security (Integrity and confidentiality of the data must be preserved).
A smart homecare system can hold the essential elements of diagnostic used in
medical facilities. It extends healthcare from traditional clinic or hospital settings to
the patient’s home. A smart homecare system benefits the healthcare providers and
their patients, allowing 24/7 physical monitoring, reducing labour costs and
increasing efficiency. Wearable sensors can notice even small changes in vital signs
that humans might overlook [8].
There are some projects for remote medical monitoring [5]. In comparison to this
work, the following are the most relevant ones:
Code-Blue: is a wireless sensor network developed at Harvard University and
intended to assist the triage process for monitoring victims in emergencies and
disaster scenarios. The caregivers, using a query interface, can access data
obtained from the sensors [6].
AMON: encapsulates many sensors (blood pressure, pulse oximetry, ECG,
accelerometer and skin temperature) into one wrist-worn device that is
connected directly to a telemedicine center via a GSM network, allowing direct
contact with the patient[2].
AlarmNet: continuously monitors assisted-living and independent-living
residents. The system integrates information from sensors in the living areas as
well as body sensors. It features a query protocol for streaming online sensor
data to user interfaces [1]
2 Home Healthcare
The main goal of this project was to create a homecare framework with the following
requirements: design simplicity, reliability, low cost and with the less possible user
interaction as possible. Our system has four elements: a corporal device, an
environment monitoring appliance, a wireless gateway and a server. The corporal
device detects the patient vital signs (temperature and heart rate) as well as its
activity. The environment appliance senses the patient environment temperature and
88

light conditions. All the data gathered from the sensors is sent over a wireless Zigbee
link to the Gateway. The data is then recorded on a MySQL database located on the
server.
2.1 Devices and Sensed Data
All system components were built using low cost hardware. Size and shape of the
corporal device were considered to improve the device usability. Sensors raw data is
processed in the device and then transmitted to the gateway.
2.1.1 Hardware Devices
For the device data processing and control we used a Sparkfun (www.sparkfun.com)
WEE based on the Arduino platform. This is a prototyping platform based on flexible,
easy to use hardware and software. The WEE has an ATmega168V micro controller
running at 8 MHz and 8Kbytes of in-system programmable flash. For power supply
we used two AA batteries with 5V DC-to-DC step up. For data transmission we used
the WEE serial communication capabilities. This hardware is programmed using the
Arduino development environment.
The wireless link between the devices and the gateway is established using the
ZigBee Technology (IEEE 802.15.4). The ZigBee defines a set of communication
protocols developed for small and low power digital radios. It is also a low cost
technology compared with other WPAN solutions like Bluetooth (e.g. a simple
ZigBee device uses only 2% of the software design needed for the same Bluetooth
application). We have choosen the MaxStream XBee pro radio for the ZigBee
communication.
Data collection was done with several kinds of sensors. For temperature sensing
we have used a DALLAS DS18B20-PAR 1-wire Parasite-Power digital thermometer.
The digital thermometer has a unique 64-bit identification code, it provides 9 to 12-bit
centigrade temperature measurements, communicates over a 1-wire bus and it has an
operating temperature range from -55º C to +100º C and is accurate to ±0,5ºC over a
range of -10ºC to +85ºC. For patient activity monitoring we have used a Freescale
Semiconductor MMA7260QT ±1.5g-6g Three Axis Low-g Micromachined
Accelerometer. The accelerometer measures acceleration and gravity induced reaction
forces. The MMA7260QT has temperature compensation and a g-Select which allows
selecting among four sensitivities. This accelerometer includes a Sleep mode that
makes it ideal for handheld battery powered electronics.
The pulse oximeter uses an ultra bright red LED (Light Emitting Sensor) and a
LDR (Light Dependent Resistor). The LDR is facing the LED through a fingertip, and
measures the absorption of the red light. From the ratio of absorption it is possible to
determine the patient oxygenation percentage. The monitored signal bounces in time
with the heart beat because the arterial blood vessels expand and contract with each
heartbeat. However due to the lack of reliability of this particular oximeter setup, we
will not use it in this project. We are now looking for alternatives for the heart rate
and blood oxygenation monitoring.
89
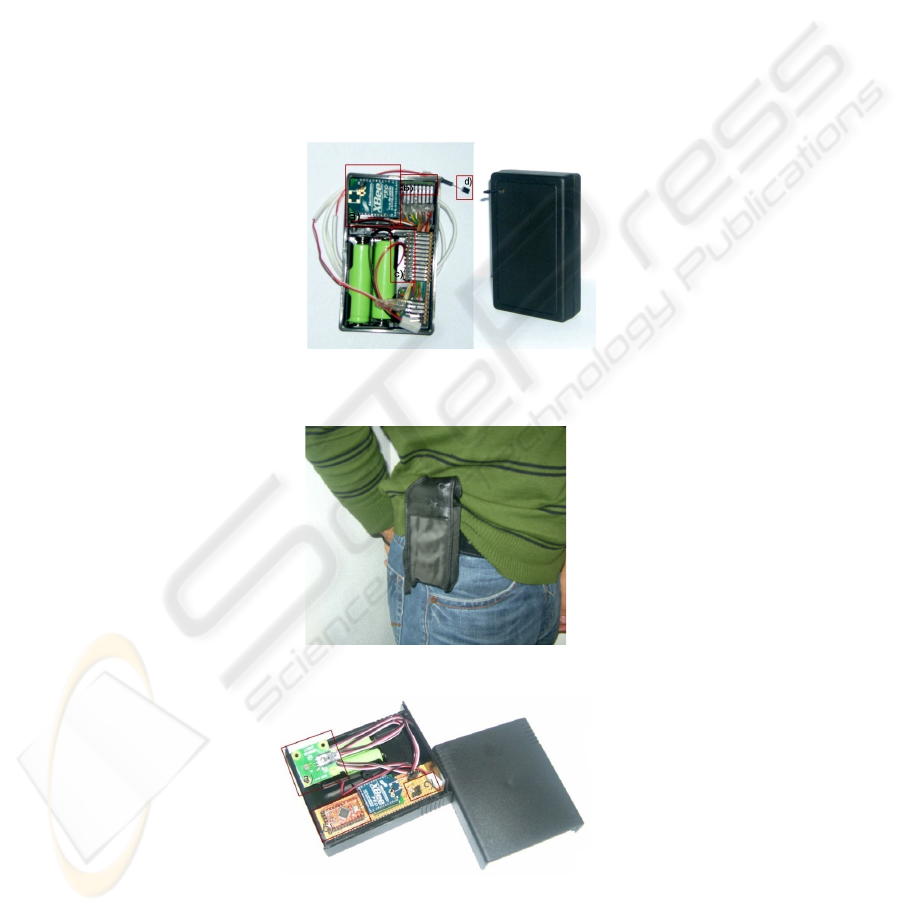
2.1.2 Corporal and Environment Devices
The corporal device was assembled using a prototype board and some wiring to
connect the components. It is composed by a WEE microcontroller, a three-axis
accelerometer, a digital temperature sensor, a XBee pro radio and the power supply.
With 10x6x2.5 cm and weighing 150g the device can accommodate all the
components and be wearable without causing too much discomfort to the patient.
Using different materials it is possible to reduce the size and weight of this prototype,
allowing a better user experience. The corporal device should be placed above the
patient right hip, pointing up, because this is the location in the human body with less
position changes during activity. The accelerometer measures the acceleration on a
3D axis of that given point. The digital temperature sensor measures skin temperature,
so for a more reliable body temperature, the sensor must be placed in the patient
armpit. The corporal device transmits the current patient activity and body
temperature.
Fig. 1. Corporal device - a) XBee pro radio, b) accelerometer, c) microcontroller, d) digital
temperature sensor.
Fig. 2. Position of the corporal unit in the body of the subject.
Fig. 3. Ambient device setup a) LDR sensor, b) microcontroller WEE, c) Temperature sensor.
90
The environment device is composed by a microcontroller, a XBee pro radio, a
digital temperature sensor and a LDR – Light Dependent Resistor to detect light
conditions. By gathering the patient environment sensor data, it’s possible to frame
the received patient vital signs and activity within its surroundings. For instance, we
may statistically link the patient activity or some physiological changes to the
environment light conditions.
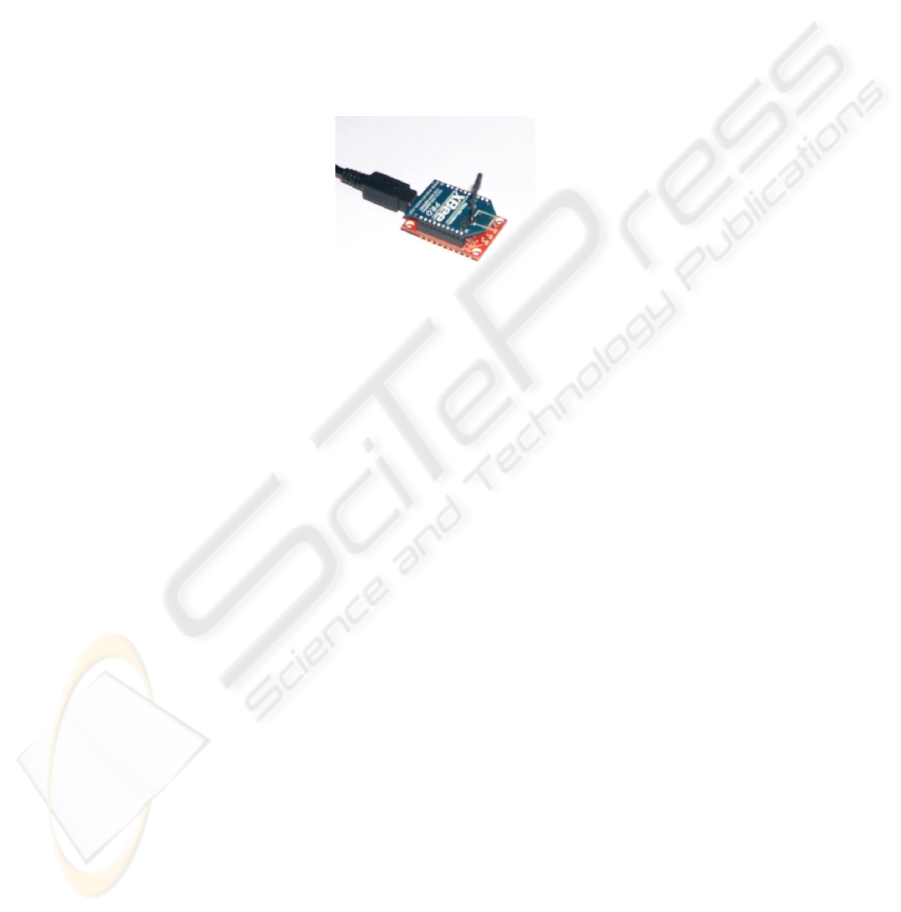
2.1.3 Gateway Device
The gateway is a XBee pro radio with a USB interface connected to a server which
receives the data sent by the sensor devices and stores it in a MySQL database. The
gateway has a wireless coverage area of 300 meters indoor and 1500 meters outdoor;
this makes it suitable for in home monitoring.
Fig. 4. Xbee pro USB gateway.
2.2 Sensed Data Processing and Analysis
Digital sensors output a formatted value; however, analogue sensors output a value
from 0 to 1023. Raw data read from the analogue sensors must be pre-processed in
order for the readings to make sense to the application.
2.2.1 Accelerometer Data
The accelerometer is an analogue sensor which outputs its data value as an integer
from 0 to 1023. It outputs a value for every axis (X, Y, Z), which corresponds to the
measured acceleration. In rest position the accelerometer outputs the average values
of 500 for the X and Y axis, and 750 for the Z axis. The Z axis shows a different
value because it’s affected by gravity.
After a series of tests, where the volunteered subjects performed their daily routine
activities, we were able to select the following main activities identified by the
accelerometer:
Standing
Sitting
Walking
Running
Laying down (Sleeping)
Falling
91
It is possible to determine if the patient is sleeping in the back position, side position
or stomach position. Although this is not a particular important distinction for
monitoring elderly patients, it can be important for monitoring infant’s sleeping
position. For example, an infant sleeping on his stomach has up to 12.9 times more
probability to die from SIDS (Sudden Infant Death Syndrome), hence, forcing
children to sleep on their backs reduces the incidence of SIDS by 40% [3].
Detecting a fall is a two class decision problem; we can have positive samples for
a fall and negative data for non-fall. While the positive samples have a lot of
commonness, negative samples are extremely diversified. So, for training a classifier
correctly, we would need a lot of negative samples, and even so a real fall could be
classified into a doubtful data set [12]. Processing all this data takes a lot of
processing power, and being ours a low cost approach, less processing power is
available. So, the objective was to find a way of classifying activity without a lot o
processing.
For determining the activity pattern values, the volunteered subjects performed
their activities and we recorded the raw accelerometer data into the database. One
value for each axis was reported by the accelerometer every 100 milliseconds. After
several runs, 200 values for each activity were selected. The analysis of the graphics
generated by the stored data, allowed us to understand that single values have no
meaning; sets of values, however, could be used to determine pattern activities.
Nevertheless, different activities may sometimes produce similar sets of values, so it
was important to find another characteristic that, combined with the set of values
could identify, without any doubt, a given activity. Further graphical analysis allowed
us to recognise that the value of each axis could also determine an activity. So, the set
of values and the correspondent axis can determine accurately the current activity.
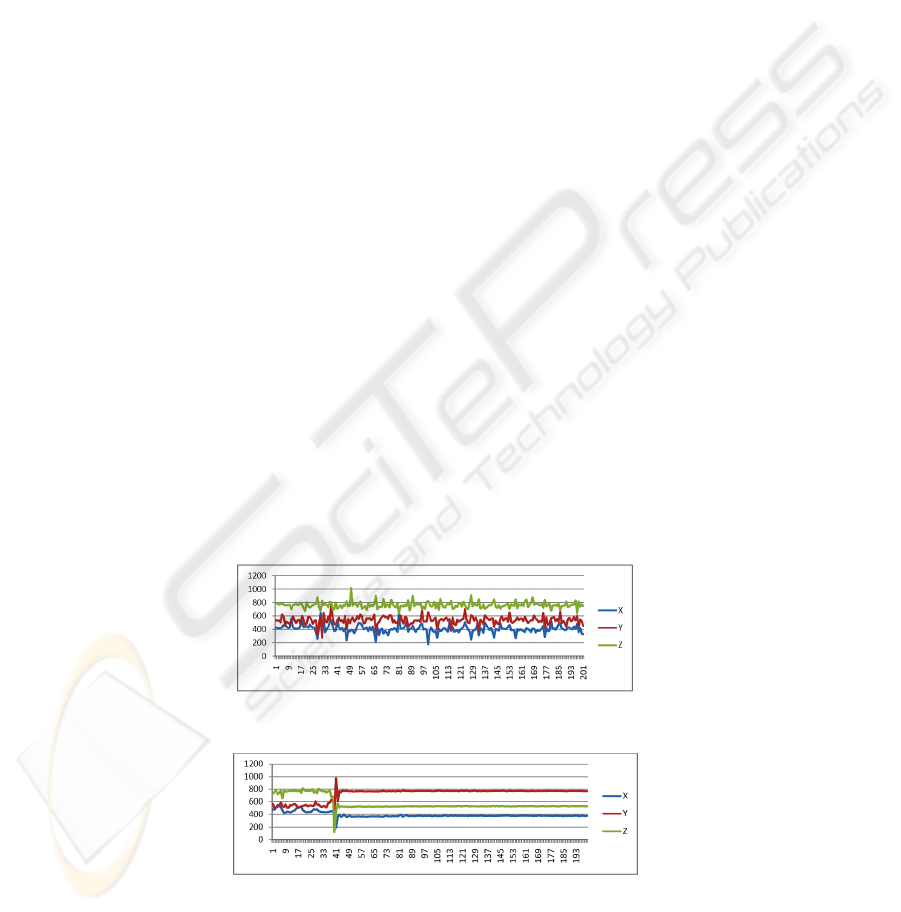
The next challenge was to decide how large should be the set of values; if it is too
small it will not allow to identify a pattern, but if it is to large the risk of overlapping
different activity patterns increased. So a set of values cannot be longer than the
fastest occurrence of an activity. In fact, the activity that takes less time to occur is a
fall (about one second). Based on this, we selected a set of 10 values. Figure 5 and 6
show a sample of the graphics for walking and falling; the fall occurs only between
readings 33 and 43; after that the volunteer subject lies down on his stomach.
Fig. 5. Walking accelerometer raw data.
Fig. 6. Fall accelerometer raw data.
92

Having the sets of values we required a formula for transforming each set of values
into a single value without losing it’s meaning. The statistical variance was the best
way to do it, but calculating the variance for the set of values of each axis, would give
us three distinct values. Hence, the average between these values would give us a
single value that could be used to identify an activity. We have called this value VAI
which stands for Value for Activity Indicator. The variance and VAI formula are
shown below:
1
1
i
(1)
3
(2)
The accelerometer values vary from subject to subject, and it is impossible, for
example, to walk exactly the same way all the time, so we needed to identify a list of
range values for each activity. Therefore using the VAI formula and the raw data
previously acquired we built with the following table.
Table 1. Max and Min VAI values for each activity.
Stand,
Sit,
Laying
Down
walk
Run
Fall
Min
0 450 50000 15000
Max
120 5000 - 48000
From table 1 we realize that stand, sit and laying down activities have the same
VAI range. So we use the axis values, for instance, for lying down back the x and z-
axis must return almost the same value, x must be lower than 420 and y-axis value
must be lower than the x-axis value. With this definition most activities can be well
identified by a simple algorithm. However, the identification of a fall poses some
problems. Sometimes running is miss-identified as fall and a fall may be misidentified
as running. To solve this problem we added to the algorithm an activity matrix that
incorporates known situations in which a fall occurs, e.g, if someone is running and in
the next second is laying in his stomach it is feasible to say he suffered a fall. So we
filled the matrix with several of these scenarios. The matrix is composed by: two past
activities, the activity to analyse, two future activities and the activity we wish to
identify. In real time an array is filled with the activities identified by the
accelerometer readings. This array has two past activities, the “present” activity to
analyze and two “future” activities. The array is then compared with the matrix. If we
have a match with a sequence of events in the matrix then the algorithm outputs the
corresponding activity. If we do not have a match, the algorithm decides, based on the
single window of data for the “present” activity. In reality, the detection has a delay of
3 seconds, because we need to wait for two more future readings before making a
93

decision. After the use of the known scenarios matrix the fall detection improved
from 30% to 60%, adding more know cases to the matrix will improve even more the
detection. However, it can cause some false positive detection. Running activity
detection has a rate of 70% accuracy, this numbers can be improved by adding known
case for running to the matrix. All the other activities have 95% detection accuracy.
However, when tested on an elderly subject, and being that our main objective, due to
their degraded motor skills, the activity detection improves for near 100%.
2.2.2 Temperature and Light Sensor Data
A digital sensor monitors body and environment temperature. The output is in
centigrade degrees, so no pre-processing is needed.
The light sensor LDR is an analogue sensor so its output needs to be transformed
in meaningful values. We considered three categories: bright light (values from 0 to
250), medium light (from 250 to 600) and dark (above 600).
2.3 Gateway and Transmission
The gateway connects to the server via a serial port, allowing it to receive the
information transmitted wirelessly from de sensor devices. The messages exchanged
by the devices and the gateway have a specific format. The gateway receives a string
with the following format; “M001S00136.23”, the first four characters address the
sensor device. This way we can have from M001 to M999 devices or if needed even
more using an alpha numeric sequence. The second four characters represent a
specific sensor, for example “S001” is the code for the temperature sensor, the
number of sensor can also be 999 in case we use a numeric sequence. The remaining
characters represent the sensed value, in this case 36.23º C. For activity monitoring
the following message could be received in case of a fall: “M001S002FALL”. Using
a python script we disassemble the received string into meaningful data and insert it
in the database. The corporal sensor device reads a temperature value every second
and the accelerometer every 100 milliseconds, but for power saving reasons a sensor
device only transmits the sensed data if it is different from the previously transmitted
one.
3 Data Visualisation
The monitoring system is composed by the sensor devices, the gateway, server and
graphical user interface for visualisation and data managing.
After deploying the sensor devices (corporal and environmental), we need to plug
to the server the USB ZigBee gateway, and then run the connection python script.
After this, all the data received by the gateway is treated and stored in the database.
The application has three main users, healthcare professional, patient and family
member. The healthcare professional can create a new patient, link a given corporal
device and environment device to a patient during a certain period of time, insert
diagnostic or process notes for a patient, view patient data and create patient and
family member login.
94
Corporal device
Healthcare GUI
Ethernet
User GUI
Internet
Server (Backbone)
Environment device
Database
ZigBee
ZigBee
Fig. 7. System components diagram.
The patient can insert the symptoms that he is feeling at the time and view his log in
real time. The family member can view the patient real time data.
The connection python script has an alert system that sends a SMS, using a GSM
modem, to the patient family member contact phone if some disturbing values are
received, such as if the patient fall or if the body temperature rises rapidly.
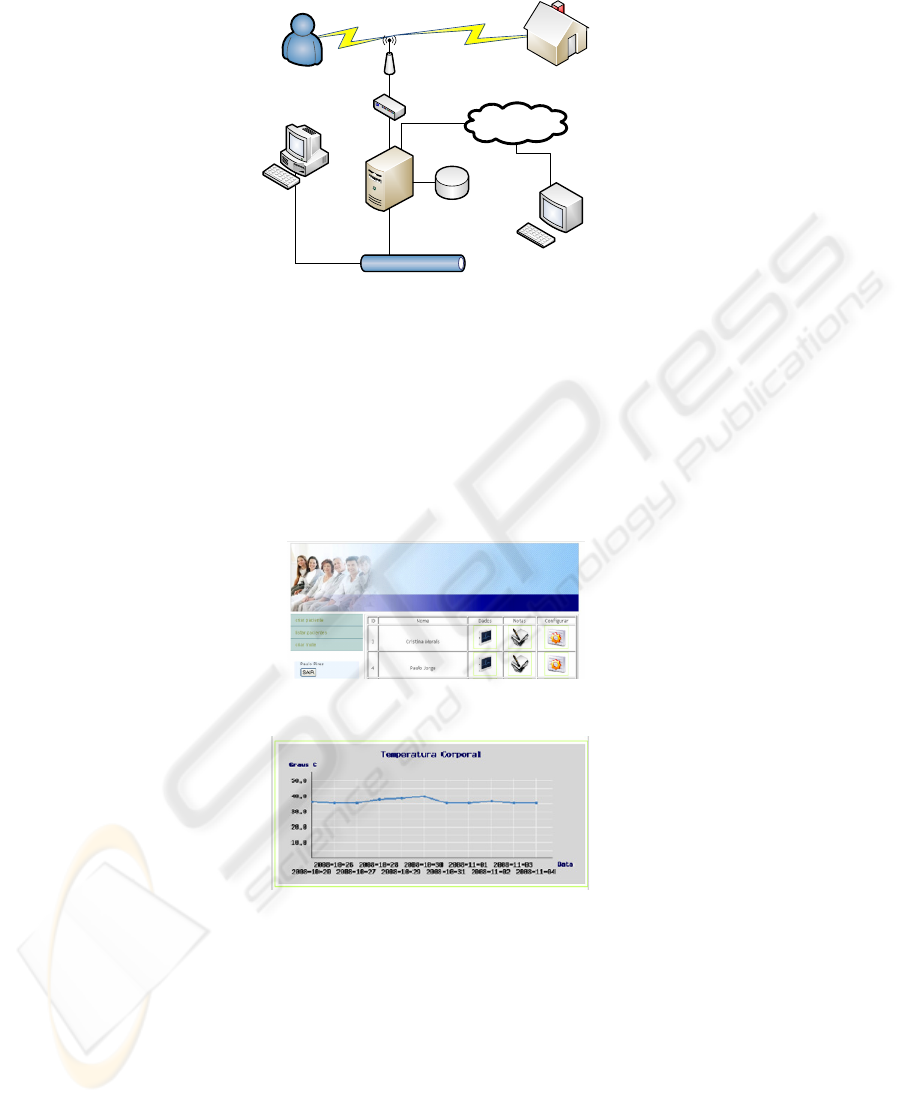
The health care professional can view, in one page, all the received data related to
one patient during a certain period of time. In this way they can relate the patient
symptoms with the activity and environmental conditions.
Fig. 8. Example of the healthcare professional GUI for listing patients.
Fig. 9. Example of the healthcare professional GUI for corporal temperature data visualisation.
4 Conclusions
To design an ambulatory monitoring system, several aspects must be taken into
account, reliability, cost, security and user friendliness. By acquiring some ECG,
heart rate and other medical sensor equipment we can cover all vital signs, increase
95

the number of applications maintaining the low cost approach. Fall detection can be
improved increasing the number of known position in the matrix. A trial and error
approach can be used to achieve the maximum detection reliability without too much
false positives. This way the system can be reliable and remain low cost.
Acknowledgements
We would like to acknowledge Filipe Valpereiro of INMOTION for the support on
hardware configuration.
References
1. Alarmnet (2007) alarmnet: Assisted-living and Residential Monitoring Network - A
wirEless Sensor Network for Smart Healthcare, http://www.cs.virginia.edu/wsn/medical/.
2. Anliker, U. W., J. A. Lukowicz, P. Troster, G. Dolveck, F. Baer, M. Keita, F. Schenker, E.
B. Catarsi, F. Coluccini, L. Belardinelli, A. Shklarski, D. Alon, M. Hirt, E. Schmid, R.
Vuskovic, M. (2004) Amon: A Wearable Multiparameter Medical Monitoring and Alert
System. IEEE Transaction on Information Technology in Biomedicine.
3. Chris R. Baker, K. A., Simon Belka, Merwan Benhabib, Vikas Bhargava, Nathan
Burkhart,, Artin Der Minassians, G. D., Lilia Gutnik, M. Brent Haick, Christine Ho*, Mike
Koplow, Jennifer Mangold, S. R., Matt Rosa, Miclas Schwartz, Christo Sims, Hanns
Stoffregen, & Andrew Waterbury, E. S. L., Trevor Pering, and Paul k. Wright (2007)
Wireless Sensor Networks for Home Health Care. 21
st
International Conference on
Advanced Information Networking and Applications Workshops (AINAW'07). IEEE.
4. Giannakouris, K. (2008) Ageing Characterises the Demographic Perspectives of the
European Societiess. Population and Social Conditions. Eurostat.
5. Jurik, A. D. W., Alfred C. (2008) Remote Medical Monitoring. Computer.
6. Moulton, d. M. T. F.-J. M. W. S. (2004) CodeBlue: An Ad Hoc Sensor Network
Infrastructure for Emergency Medical Care. MobiSys 2004 Workshop on Applications of
Mobile Embedded Systems (WAMES 2004).
7. Ng, H. S. S., M. L., Tan, C. M., Wong, C. C. (2006) Wireless Technologies for
Telemedicine. Bt Technology Journal, vol 24.
8. Stankovic, J. A. C., Q., Doan, T., Fang, L., He, Z., Kiran, R., Lin, S., Son, S., Stoleru, R.,
Wood, A. (2005) Wireless Sensor Networks for In-Home Healthcare: Potential and
Challenges. Workshop on High Confidence Medical Devices Software and systems (HCMDSS).
9. Venkatasubramanian, K. D., Guofeng, Mukherjee, Tridib, Quintero, John, Annamalai,
Valliappan; Gupta, Sandeep K. S. (2005) Ayushman: A Wireless Sensor Network based
Health Monitoring Infrastructure and Testbed.
10. Krishna Venkatasubramanian, Guofeng Deng, Tridib Mukherjee, John Quintero,
Valliappan Annamalai, Sandeep k. S. Gupta. International Conference on Distributed
Computing in Sensor Systems (DCOSS).
11. Xu, N. (2003) A Survey of Sensor Network Applications. University of Southern California
12. Zhang, T. W., Jue; Liu, Ping and Hou, Jing (2006) Fall Detection by Embedding an
Accelerometer in Cellphone and using KFD algorithm. IJCSNS International Journal of
Computer Science and Network security, vol. 6.
96
