
CONSIDERING THE WAVELET TYPE AND CONTENTS ON
THE COMPRESSION-DECOMPRESSION ASSOCIATED WITH
IMPROVEMENT OF BLURRED IMAGES
Aura Conci, Marcello Santos Fonseca
Institute of Computation, UFF, Rua Passo da Patria 156, Niteroi, Brazil
Carlos S. Kubrusly
Electrical Engineering Department, PUC-RJ, R. Marques de S. Vicente 225, Rio de Janeiro, Brazil
Thomas Walter Raubert
Department of Informatic, UFES, Av Fernado Ferrari s/n,Vitoria, Brazil
Keywords: Compression-denoising, Additive White Gaussian Noise, Image Filtering, Wavelet Family, Haar’s Wavelet,
Daubechies’ Wavelet, Biorthogonal Wavelet, Coiflet Wavelet, Symlet Wavelet.
Abstract: Uncompressed multimedia data such as high resolution images, audio and video require a considerable
storage capacity and transmission bandwidth on telecommunications systems. Despite of the development
of the storage technology and the high performance of digital communication systems, the demand for huge
files is higher than the available capacity. Moreover, the growth of image data in database applications
needs more efficient ways to encode images. So image compression is more important than ever. One of the
most used techniques is compression by wavelet, specified in the JPEG 2000 standard and recommended
also for medical image DICOM database. This work seeks to investigate the wavelet image compression-
denoising technique related to the wavelet family bases used (Haar, Daubechies, Biorthogonal, Coiflets and
Symlets), database content and noise level. The target of the work is to define which combination present
the best and the worst compression quality, through quality evaluation by quantitative functions: Root Mean
Square Error (RMSE), Sign Noise Ratio (SNR) and Peak Sign Noise Ratio (PSNR).
1 INTRODUCTION
Huge images are used in an increased number of
applications. They require a considerable storage
capacity and transmission bandwidth. Wavelet
compression, used in the DICOM standard (Digital
Imaging and Communications in Medicine) and
JPEG 2000 format is the most used image
compression technique (Stahl et al., 2000; Ouled
Zaid et al., 2002). Simultaneous compression and
denoising is and important aspect of wavelets
compression (Bruni and Vitulano, 2007). These,
namely comp-denoisers, are mainly based on
thresholding the components dominated by noise.
We investigate the quality concerning the blur level,
the image content and the type of wavelet used. The
idea is to modify out the coefficient components
dominated by noise. This improves the image
quality and the compression rate as well. This work
compares results of 36 different wavelet types. For
this we implement in the same environment five
families of bases: Haar, Daubechies, Biorthogonal,
Coiflets and Symlets with many possibilities. They
are used to compress a group of natural and
synthetic images in different resolutions. We
consider three level of degradation by Additive
White Gaussian Noise (AWGN). The target of the
work is to propose a comp-denoiser adapted to each
type of images and technique used. We try to define
which aspect present the best and the worst
compression quality, through evaluation of the Root
Mean Square Error (RMSE), Sign Noise Ratio
79
Conci A., Santos Fonseca M., Kubrusly C. and Raubert T. (2009).
CONSIDERING THE WAVELET TYPE AND CONTENTS ON THE COMPRESSION-DECOMPRESSION ASSOCIATED WITH IMPROVEMENT OF
BLURRED IMAGES.
In Proceedings of the Fourth International Conference on Computer Vision Theory and Applications, pages 79-84
Copyright
c
SciTePress
(SNR) and Peak Sign Noise Ratio (PSNR). By
analyzing the results is possible to verify that the
best choice related to quality is more dependent to
the image content than expected initially.
The fidelity with respect to the original is an
important aspect of lossy compression methods.
However, quality is not an easy issue to measure.
Comparisons can be performed considering visual
quality of the decompressed image or quantitatively
using error evaluators. These are pointwise
information associated with the image generated by
subtracting the differences between the original
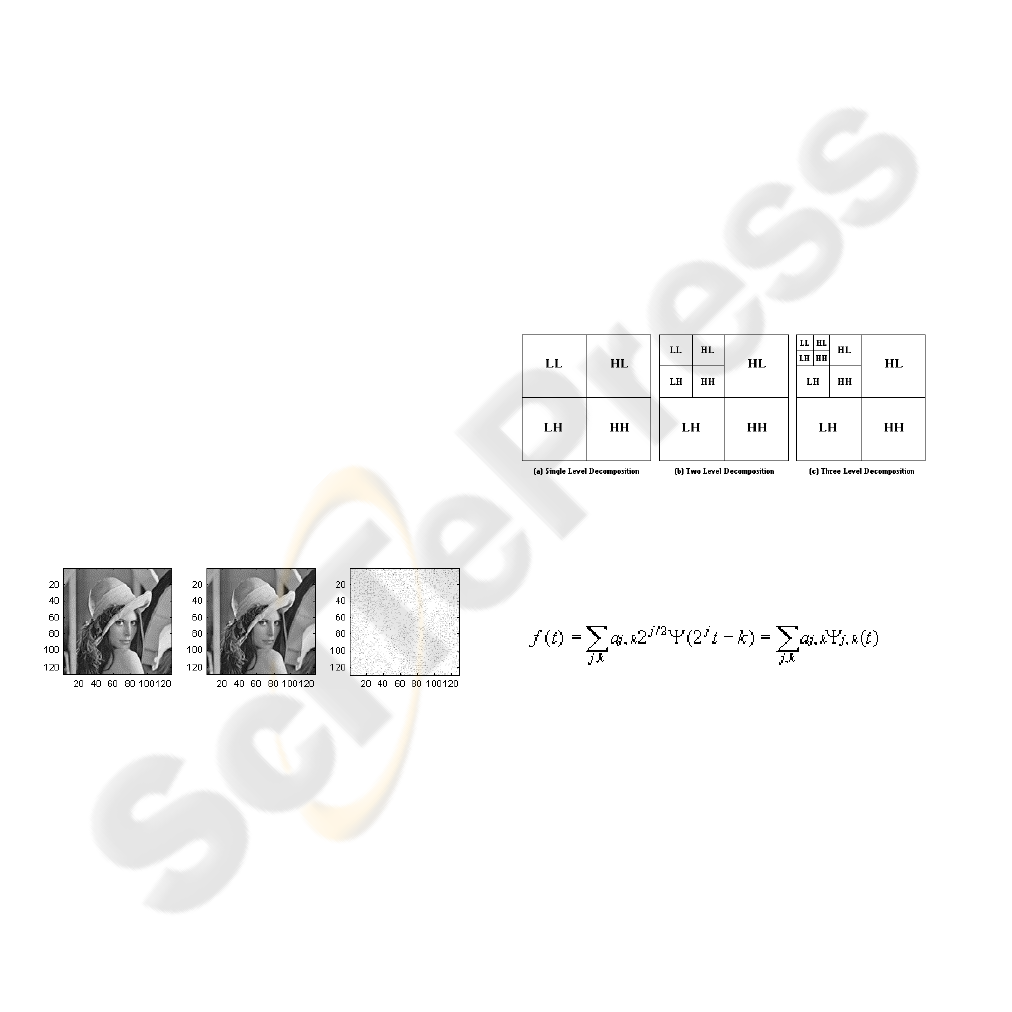
image and the decompressed images. Figure 1 shows
an example of a compression error for the Lena
image (Conci et al., 2008). The pointwise
differences were amplified to fit into the interval
between 0 and 255 in order to facilitate their
visualization. The Haar coefficients in this example
are adjusted to get a file 80% reduced. Comparing
the performance using error images makes it easier
to see where the decompressed image has been
slightly changed: some elements with low spatial
frequencies have been removed improving the
image. If these elements originated from noise the
compression process additionally improves the
image quality. Moreover, the same idea can be used
to improve the details if the noise is responsible of
blurring the images.
The following is an outline of this paper: in
Section 2 we consider the relation between wavelet
based denoising and wavelet coefficients. Section 3
gives a brief review on wavelets types and provides
details of the experiments. Finally, conclusions are
presented, in section 4.
Figure 1: “Lena” (128 x 128), its compressed version by
Haar and the rescaled error image.
2 DENOISING BY WAVELET
The low frequency components (smooth variations)
constitute the base of a natural image. The high
frequency components add upon low frequency
components to refine the image, thereby giving a
detailed image. Separating the smooth variations and
details of the image can be done in many ways. One
such way is the decomposition of the image using a
Discrete Wavelet Transform (DWT) in the following
way: A low pass filter (LPF) and a high pass filter
(HPF) are chosen, such that they exactly halve the
frequency range between themselves. These are
called the Analysis Filter Pair. First, the LPF is
applied for each row of data, thereby getting the low
frequency components of the row. But since the LPF
is a half band filter, the output data contains
frequencies only in the first half of the original
frequency range. So, they can be sub sampled by
two and the output data now contains only half the
original number of samples. Now, the HPF is
applied for the same row of data, and similarly the
high pass components are separated, and placed by
the side of the low pass components. This procedure
is done for all rows. Next, the filtering is done for
each column of the intermediate data. The resulting
two-dimensional array of coefficients contains four
bands of data, each labeled as LL (low-low), HL
(high-low), LH (low-high) and HH (high-high). The
LL band can be decomposed once again in the same
manner producing even more sub bands. This can be
done up to any level, thereby resulting in a
pyramidal decomposition as shown in figure 2.
Figure 2: Pyramidal decomposition.
The wavelet transform calculates inner products
of a signal with a set of basis functions to find
coefficients that represent the signal:
(1)
where the two-dimensional set of coefficients a
j,k
is
the DWT of f(t). When the index k changes, the
location and scaling of the wavelet moves along the
time axis. When the index j changes, the shape of
the wavelet changes in scale. As the scale becomes
finer (j larger), the time steps become smaller. Both
the narrower wavelet and the smaller steps allow a
representation of greater detail or resolution. In
order to use the idea of multi resolution, a scaling
function j(t) is used to define the wavelet (Kubrusly.
and Levan, 2006). Since this is a linear system, the
signal can be reconstructed by a weighted sum of the
basis functions (Levan, and Kubrusly, 2007). A
signal's energy, therefore, is usually well represented
VISAPP 2009 - International Conference on Computer Vision Theory and Applications
80

by just a few wavelet expansion coefficients.
Wavelet analysis produces several important
benefits, particularly for image compression. First,
an unconditional basis causes the size of the
expansion coefficients to drop off with j and k for
many signals. Since wavelet expansion also allows a
more accurate local description and separation of
signal characteristics, the DWT is very efficient for
compression. Secondly, a great variety of different
wavelet types provides flexibility to design wavelets
to fit individual applications. The LL band at the
highest level can be classified as most important,
and the other 'detail' bands can be classified as of
lesser importance, with the degree of importance
decreasing from the top of the pyramid to the bands
at the bottom (figure 2) (Conci et al., 2008).
The wavelets denoising main aspect is to
distinguish between low and high energy regions,
and modify the coefficients using an adaptive
thresholding strategy. When noise is added to the
image, it tends to increase the magnitude of the
wavelet coefficients on average. Specifically, in the
regions where one expects the coefficients to be
dominated by noise, consequently most of these
coefficients should be removed since the noise is
highly noticeable here. In regions of sharp
variations, the coefficients have a lot of energy due
to the signal, and some due to noise (which is not as
visible in these regions), thus they should be kept to
ensure that signal details are retained.
The wavelet thresholding approach removes
noise from wavelet coefficients of the detail, while
keeping the lowest resolution coefficients unaltered.
It filters each noisy wavelet coefficient, from the
detail sub-band, with a non linear thresholding
function. The problem is to estimate correctly the
threshold value in order to obtain good performance.
Statistical approaches have been addressed for
wavelet-based denoising (or thresholding). Wavelet
hard threshold has been proposed (Donoho and
Johnstone, 1994). As an alternative, a denoising
algorithm via soft-thresholding has been developed
to remove noise from wavelet coefficients (Donoho,
1995). Many variants and improvements of these
works have appeared in the literature. It has been
shown that optimal thresholding can be carried out
based on the ratio between noise and original signal
variance at each decomposition sub-band. The
T
value can then be well approximated by
:
(Ruggeri. and Vidakovic, 1998). This alternative is
implemented using the Wavelet Toolbox
(Mathworks, 2001) for Matlab and used in our
experiments to exploit the relation of the results to
the image type and wavelet family.
3 EXPERIMENTAL RESULTS
The JPEG-2000 standard (selected in 2001 for
inclusion in the DICOM standards) is based on the
discrete wavelet transform using the Daubechies
(9,7) biorthogonal wavelet, also named the Cohen-
Daubechies-Feauveau 9/7 wavelet (Daubechies,
1992). Moreover, a coding denoising procedure
based on a thresholding function has been integrated
to JPEG2000 part II standard which is designed to
support a variety of applications, including the
compression and transmission of medical images
(Stahl et al. 2000). But is this the best choice
concerning quality at any time? In this work we
compared the results from 36 different variations of
wavelets compression schemes to explore their
differences related to image content and quality.
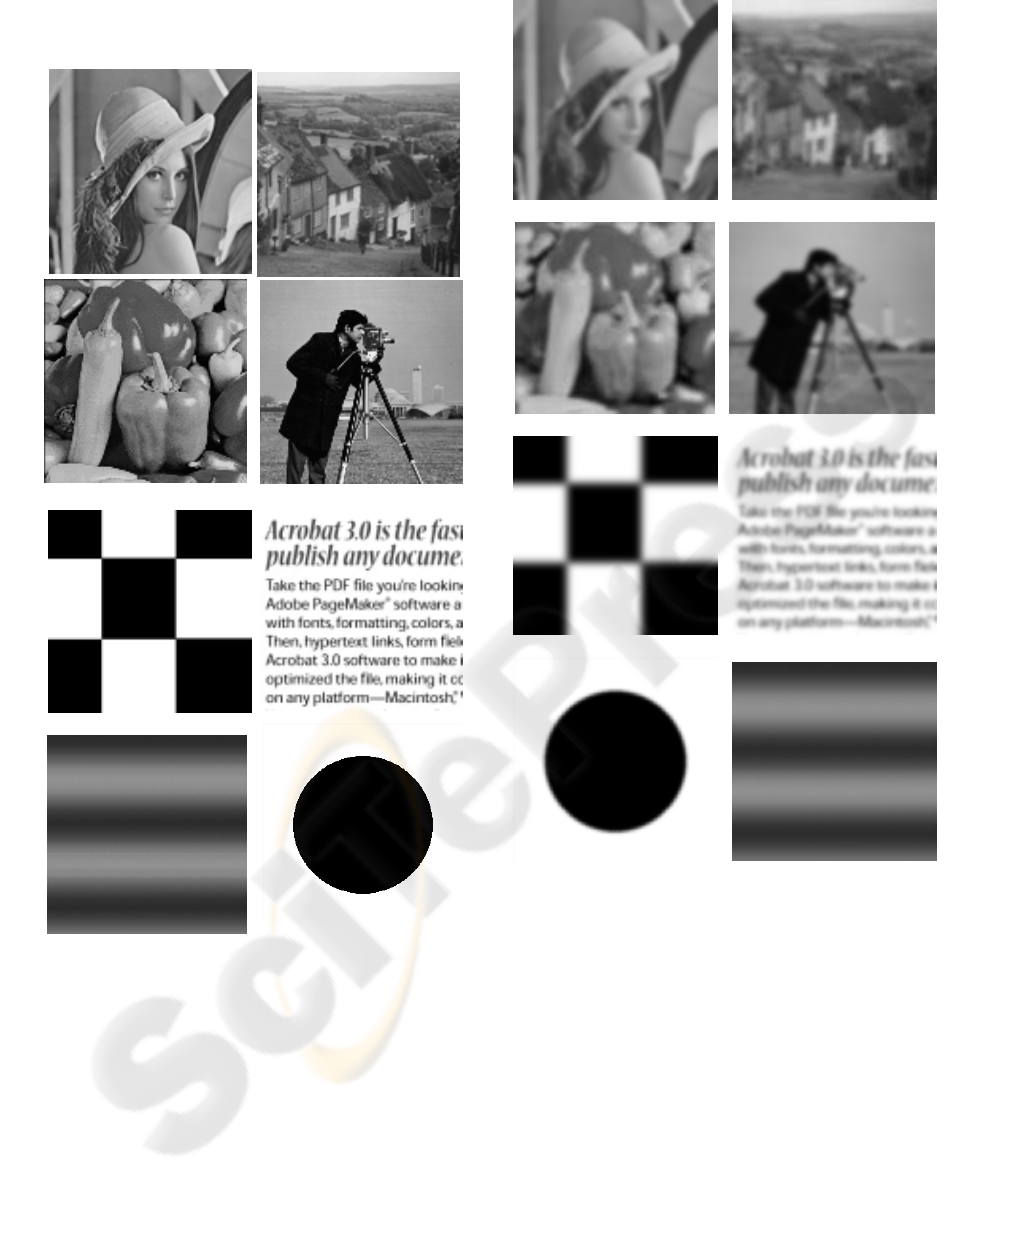
Two grouped images with different levels of
complexities and content are used to evaluate the
relation among fidelity, image content and noise
level. The contents consist of
humans, landscape,
things, textual information and synthetic objects.
The first group is formed by the natural images:
Lena, Cameraman, Goldhill, and Peppers. The
second group is formed by the synthetic images:
Circle, Checkerboard, Sinusoidal Gray Level and
Text. These images are used on three resolutions
(128x128, 256x256 and 512x512). They are tested
without noise and altered by Additive White
Gaussian Noise (AWGN) with three noise levels:
5
=
σ
,
10
=
σ
, and
20=
σ
. They are
reconstructed after compression and denoise by
thresholding. To choose these images as samples we
observed four aspects: the main motive, the number
of elements, the richness or simplicity of the
background. The performance of each approach is
evaluated by fidelity comparing the original versus
the same images after compression/denoising and
decompression. Figures 3 and 4 show the first and
third noise versions of these images, respectively. It
should be noted that only two of these images are
binary with well defined boundaries (Circle and
Checkerboard). Comparing figure 3 and 4 you see
that they are extremely sensitive to noise.
Performance analysis was done using three objective
evaluation criteria: Root Mean Square Error
(RMSE), Signal to Noise Ratio (SNR) and Peak
Signal to Noise Ratio (PSNR).
Small RMSE means
better results: the denoised image is close to the
original. High values for SNR means lower error and
this translates to a high value of PSNR. The main
drawback of using RMSE and SNR as a measure of
image quality is that in many instances these values
do not match the quality perceived by the human
σσ
2
n
T =
CONSIDERING THE WAVELET TYPE AND CONTENTS ON THE COMPRESSION-DECOMPRESSION
ASSOCIATED WITH IMPROVEMENT OF BLURRED IMAGES
81
visual system (Wang et al., 2004). The PSNR is
more representatives.
Figure 3: Tested image with low noise (
5
=
σ
).
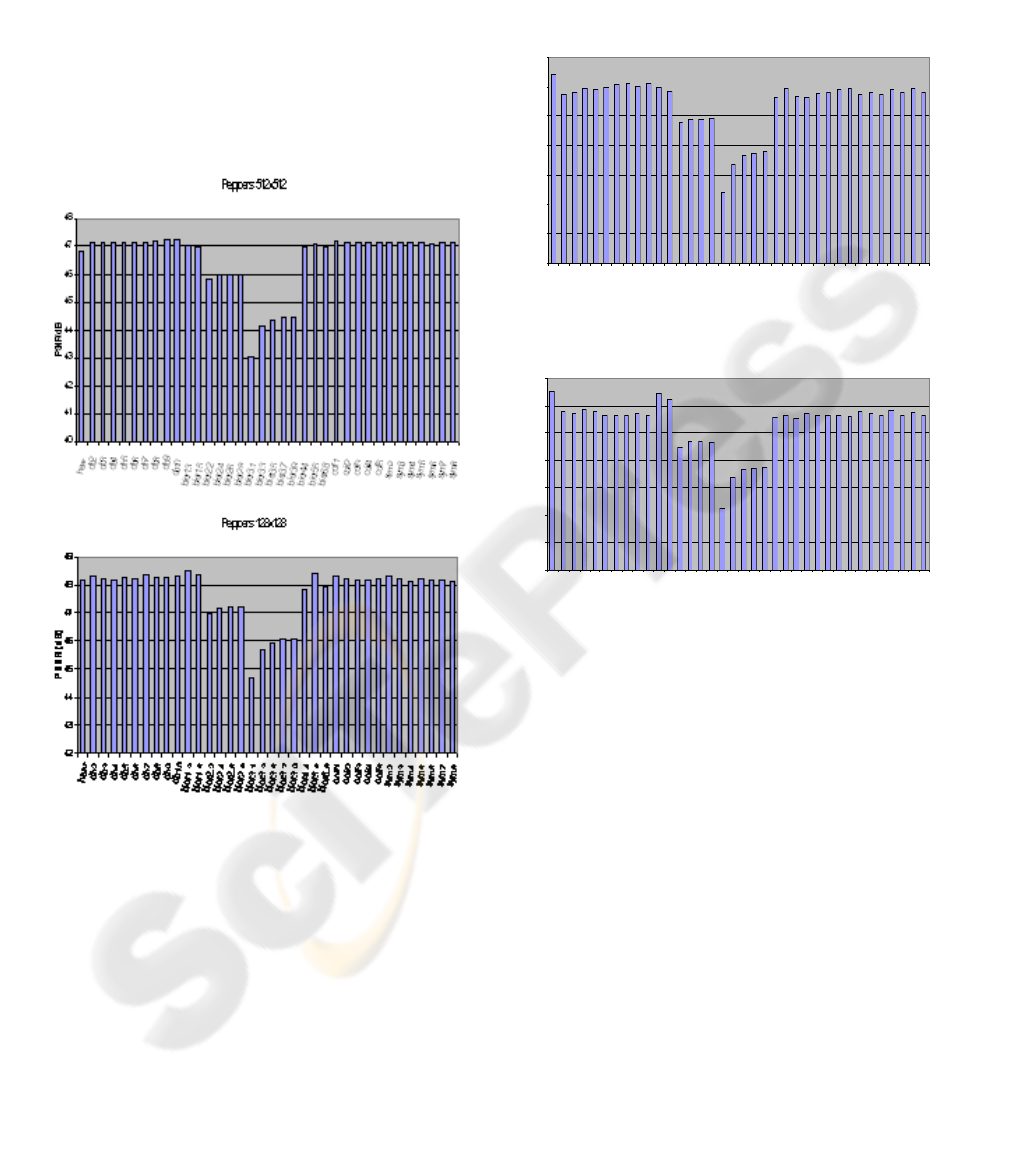
The test results (3456 cases) are presented in 96
tables or 288 graphs (one graph for each evaluation
criteria). Eight of these graphs are presented on
figures 5 to 7. In this graphs the horizontal axe
represent each one of the 36 type of wavelets used.
Figure 5 shows the PSNR results for the Peppers
image with low noise ( ) but with at two different
resolution. Comparing these it is possible to see that
the worst results at both resolutions is related to the
use of Biorthogonal 3.1 type, while the best wavelet
type is not the same for both cases (for small image
Figure 4: Images with high noise (
20=
σ
).
it is the Biorthogonal 1.3 but for the 512x512
version of the same image it moves to the
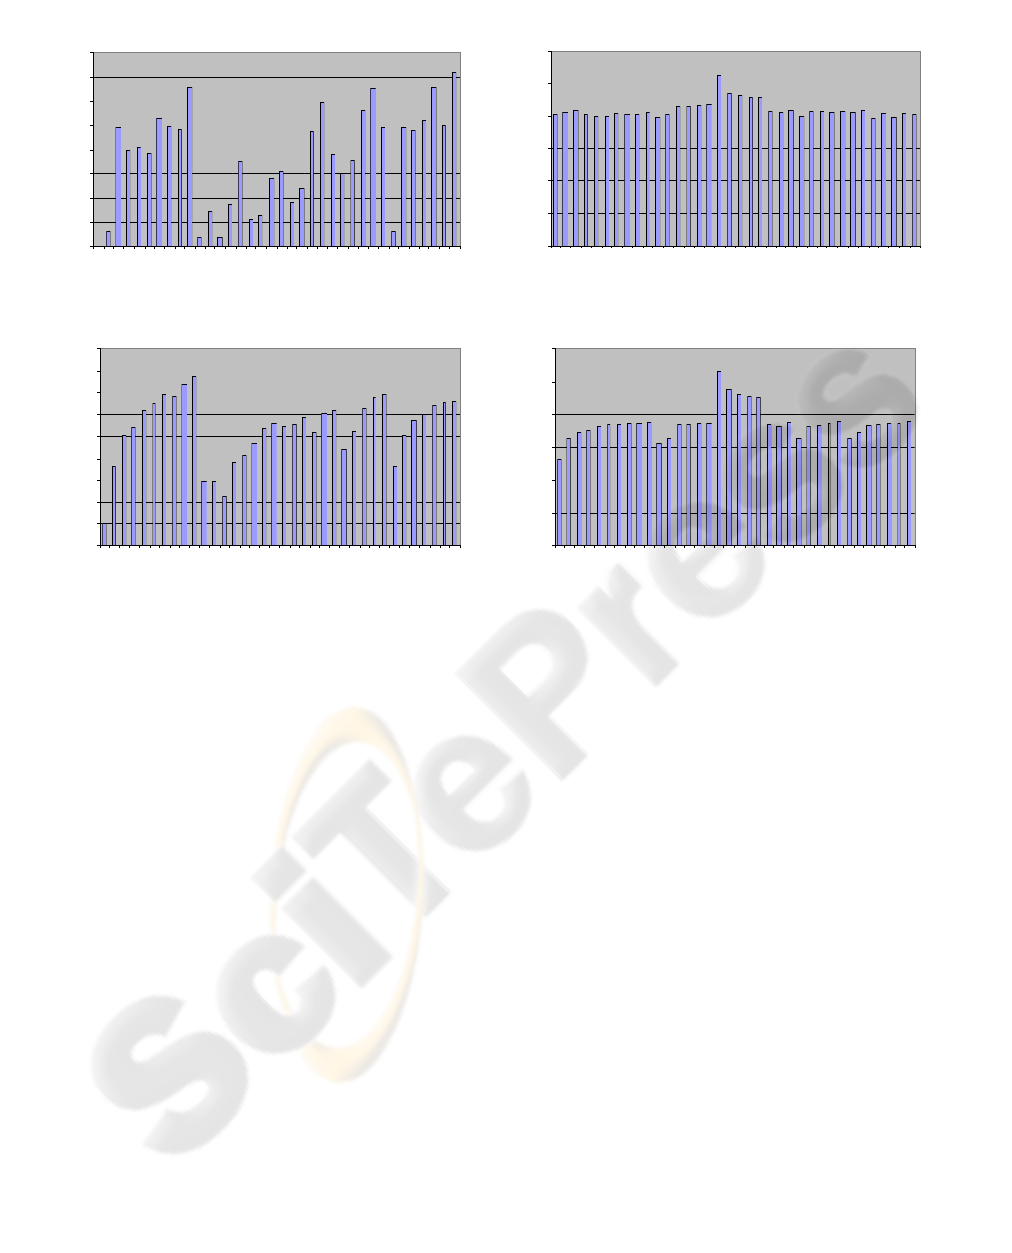
Daubechies 10 type). Figure 6 shows the results for
the Cameraman image at same resolution (256x256)
but with two different noise levels (5 and 20).
Although, in these case the best and worst results are
presented by the same wavelet type (that is Haar and
Biorthogonal 3.1), all others intermediate position
have been changed. More significant yet are the
changes associated with the image content as can be
seen comparing the completely different pattern of
the graphs considering the RMSE for the four
synthetic images in the same resolution without
noise (figure 7). The results have been analyzed and
VISAPP 2009 - International Conference on Computer Vision Theory and Applications
82
combined in different manners. The graphs for
natural images related to the wavelets type used
have been presents similar distribution considering
all noise level and denoising approach. They are
combined in a group of natural images. The non
binary synthetic images (text and sinusoidal)
presents more similar behavior for median and high
noise level. But the circle and chessboard images
present no characteristics that permits adequate
conclusion related with what could be pointed as
best wavelet type for compression and denoising.
Figure 5: Example of PSNR results variation considering
only resolution variation.
4 CONCLUSIONS
In this paper presents a broad analysis for wavelet
based compression and denoising of synthetic and
photographic or natural images. Our experiments
compare a thresholding process to remove additive
noise from three noisy versions (low Φ.5, median
10=
σ
and high
20=
σ
). Averaging the results, the
Haar and Biorthogonal 1.3 types present the first and
second best quality. Worst results are obtained with
the Biorthogonal 3.1 type. Considering the image
content, they show more dependent on the image
type and wavelet (Haar, Daubechies, Biorthogonal,
Coiflets, or Symlets) used than could be expected.
Camer aman noise level 1
44
45
46
47
48
49
50
51
ha
a
r
d
b
2
d
b3
d
b
4
d
b
5
d
b
6
d
b7
d
b
8
d
b
9
d
b1
0
b
i
o
r
1
.
3
b
i
o
r
1
.
5
bi
o
r
2
.
2
b
i
o
r
2
.
4
b
i
o
r
2
.
6
bi
o
r
2
.
8
bi
or
3
.
1
bi
o
r
3.
3
bi
o
r
3
.
5
b
i
o
r
3.
7
bi
o
r
3
.
9
bi
o
r
4
.
4
bi
o
r
5
.
5
b
i
o
r
6
.
8
c
o
i
f
1
co
i
f
2
co
i
f
3
c
o
i
f
4
c
o
i
f
5
s
y
m
2
s
y
m
3
s
y
m
4
s
y
m
5
sy
m
6
s
y
m
7
sy
m
8
PSNR
(
dB
)
Cameraman noise level
3
35
36
37
38
39
40
41
42
h
a
a
r
d
b
2
d
b
3
d
b
4
d
b
5
d
b
6
d
b
7
d
b
8
d
b
9
d
b
1
0
b
io
r
1
.
3
b
i
o
r
1
.
5
b
i
o
r
2
.
2
b
i
o
r
2
.
4
b
io
r
2
.
6
b
io
r
2
.
8
b
i
o
r
3
.
1
b
i
o
r
3
.
3
b
i
o
r
3
.
5
b
i
o
r
3
.
7
b
i
o
r
3
.
9
b
i
o
r
4
.
4
b
i
o
r
5
.
5
b
i
o
r
6
.
8
c
o
if
1
c
o
if
2
c
o
i
f
3
c
o
i
f
4
c
o
i
f
5
s
y
m
2
s
y
m
3
s
y
m
4
s
y
m
5
s
y
m
6
s
y
m
7
s
y
m
8
PSNR
(
dB
)
Figure 6: Example of PSNR results variation considering
only noise level variation.
The performance assessment of the compression
denoising results was performed by RMSE, SNR
and PSNR objective measures. Our experiments
showed that by incorporating a thresholding in the
wavelet based coding chain, we can improve the
quality of the compressed natural noisy image,
without sacrificing performance and without
increasing the computational complexity, but this is
not effective on all types of synthetic images. The
thresholding process improve the visual quality of
natural images on the practically the same amount of
the noise added. Based in this comparative study
only the binary synthetic images present the
denoised process related to the noise level. It is
expected that the obtained results can be further
improved if the other denoised scheme are exploited.
Hence, we are currently investigating context
adaptive extensions of the used thresholding process
and others compression/denoising process to wavelet
based coding.
CONSIDERING THE WAVELET TYPE AND CONTENTS ON THE COMPRESSION-DECOMPRESSION
ASSOCIATED WITH IMPROVEMENT OF BLURRED IMAGES
83
Xadrez 256x256
0,0000
0,2000
0,4000
0,6000
0,8000
1,0000
1,2000
1,4000
1,6000
haa
r
db2
db3
db
4
db5
db6
db7
d
b
8
db9
d
b1
0
bi
or
1
.
3
bi
or
1
.
5
bi
o
r
2
.
2
bi
or
2
.
4
bi
or
2
.
6
bi
o
r
2
.
8
bi
or
3
.
1
bi
or
3
.
3
b
i
or
3
.
5
bi
o
r
3
.
7
bi
or
3
.
9
b
i
or
4
.
4
bi
o
r
5
.
5
bi
o
r
6
.
8
c
oi
f
1
c
oi
f
2
c
oi
f
3
c
oi
f
4
c
oi
f
5
s
y
m
2
sym
3
sy
m
4
sy
m
5
sym
6
sy
m
7
sy
m
8
RMSE
Sen iodal 2 56x2 5
6
0,0000
1,0000
2,0000
3,0000
4,0000
5,0000
6,0000
h
a
a
r
d
b
2
d
b
3
d
b
4
d
b
5
d
b
6
d
b
7
d
b
8
d
b
9
d
b
1
0
b
i
o
r
1
.
3
b
i
o
r
1
.
5
b
i
o
r
2
.
2
b
i
o
r
2
.
4
b
i
o
r
2
.
6
b
i
o
r
2
.
8
b
i
o
r
3
.
1
b
i
o
r
3
.
3
b
i
o
r
3
.
5
b
i
o
r
3
.
7
b
i
o
r
3
.
9
b
i
o
r
4
.
4
b
i
o
r
5
.
5
b
i
o
r
6
.
8
c
o
i
f
1
c
o
i
f
2
c
o
i
f
3
c
o
i
f
4
c
o
i
f
5
s
y
m
2
s
y
m
3
s
y
m
4
s
y
m
5
s
y
m
6
s
y
m
7
s
y
m
8
RMSE
Círcul o 2 56x2 5
6
0,0000
0,2000
0,4000
0,6000
0,8000
1,0000
1,2000
1,4000
1,6000
1,8000
h
a
a
r
d
b
2
d
b
3
d
b
4
d
b
5
d
b
6
d
b
7
d
b
8
d
b
9
d
b
1
0
b
i
o
r
1
.
3
b
i
o
r
1
.
5
b
i
o
r
2
.
2
b
i
o
r
2
.
4
b
i
o
r
2
.
6
b
i
o
r
2
.
8
b
i
o
r
3
.
1
b
i
o
r
3
.
3
b
i
o
r
3
.
5
b
i
o
r
3
.
7
b
i
o
r
3
.
9
b
i
o
r
4
.
4
b
i
o
r
5
.
5
b
i
o
r
6
.
8
c
o
i
f
1
c
o
i
f
2
c
o
i
f
3
c
o
i
f
4
c
o
i
f
5
s
y
m
2
s
y
m
3
s
y
m
4
s
y
m
5
s
y
m
6
s
y
m
7
s
y
m
8
RMSE
Te xt o 2 56x2 5
6
0,0000
1,0000
2,0000
3,0000
4,0000
5,0000
6,0000
h
a
a
r
d
b
2
d
b
3
d
b
4
d
b
5
d
b
6
d
b
7
d
b
8
d
b
9
d
b
1
0
b
i
o
r
1
.
3
b
i
o
r
1
.
5
b
i
o
r
2
.
2
b
i
o
r
2
.
4
b
i
o
r
2
.
6
b
i
o
r
2
.
8
b
i
o
r
3
.
1
b
i
o
r
3
.
3
b
i
o
r
3
.
5
b
i
o
r
3
.
7
b
i
o
r
3
.
9
b
i
o
r
4
.
4
b
i
o
r
5
.
5
b
i
o
r
6
.
8
c
o
i
f
1
c
o
i
f
2
c
o
i
f
3
c
o
i
f
4
c
o
i
f
5
s
y
m
2
s
y
m
3
s
y
m
4
s
y
m
5
s
y
m
6
s
y
m
7
s
y
m
8
RMSE
Figure 7: Example of RMSE results variation with the wavelet type for the synthetic image group without noise.
ACKNOWLEDGEMENTS
This work is partially supported by CAPES and
CNPq.
REFERENCES
Bruni, V. and Vitulano, D. (2007) ‘Combined image
compression and denoising using wavelets’, Journal of
Signal Processing, Vol. 22, pp.86-101.
Conci, A. Azevedo E. and Leta, F.R (2008) Computação
Gráfica,Vol. 2. Elsevier, Rio de Janeiro.
Daubechies, I. (1992), ‘Ten lectures on wavelets’, In
Regional Conf. Applied Mathematics Society for
Industrial and Applied Mathematics, Philadelaphia.
Donoho, D.L. and Johnstone, I.M. (1994) ‘Ideal spatial
adaptation via wavelet shrinkage’, Journal of
Biometrika, Vol. 81, pp.425-455.
Donoho, D.L. (1995) ‘De-noising by soft-thresholding’,
Journal of IEEE Transactions on Information Theory,
Vol. 41, No. 3, pp.613-627.
Kubrusly, C.S. and Levan, N. (2006) ‘Abstract wavelets
generated by Hilbert Space Shift Operators’, Advances
in Mathematical Sc. and Applications 16, 643-660.
Levan, N and C.S. Kubrusly, C. S. (2007) ‘Reversed
Wavelet Functions and Subspaces’, International
Journal of Wavelets, Multiresolution and Information
Processing 5, 99-707.
Mathworks, Inc.(2001) ‘Wavelet Toolbox: User's Guide”.
Ouled Zaid, A., Olivier, C. and Marmoiton, F. (2002)
‘Wavelet Image Coding with Adaptive Dead-zone
Selection: Application to JPEG2000’, Proceedings of
the IEEE International Conference on Image
Processing, Vol. 2371, pp. 253-256.
Stahl, J.N., Zhang, J., Zellner, C., Pomerantsev, E. V.,
Chou, T.M., and Huang, H.K. (2000)
‘Teleconferencing with Dynamic Medical Images’,
Journal of IEEE Transaction on Information
Tecnology in Biomedecine, Vol. 4, No. 2, pp.88-96.
Ruggeri, F. and Vidakovic, B. (1998) ‘A Bayesian
decision theoretic approach to wavelet thresholding’,
Journal of American Statistic Association, Vol. 93,
No. 441, pp.173–179.
Wang, Z., Bovik, A.C., Sheikh, H.R., and Simoncelli, E.P.
(2004) ‘Image quality assessment: From error
measurement to structural similarity’, IEEE Trans. on
Image Process., Vol. 13, No. 4, pp.600-612.
VISAPP 2009 - International Conference on Computer Vision Theory and Applications
84
