
VISUALIZING NETWORKS OF MUSIC ARTISTS WITH RAMA
Lu´ıs Sarmento
1
, Fabien Gouyon
2
, Bruno G. Costa
3
and Eug´enio Oliveira
4
1
LIACC/FEUP, Univ. do Porto, Rua Dr. Roberto Frias, s/n, Porto, Portugal
2
INESC Porto, Rua Dr. Roberto Frias, 378, Porto, Portugal
3
Univ. Cat´olica Portuguesa, Rua Diogo Botelho, 1327, Porto, Portugal
4
LIACC/FEUP, Univ. do Porto, Rua Dr. Roberto Frias, s/n, Porto, Portugal
Keywords:
Information visualization, Search interfaces, Content ranking using social media, User interfaces for search
interaction.
Abstract:
In this paper we present RAMA (Relational Artist MAps), a simple yet efficient interface to navigate through
networks of music artists. RAMA is built upon a dataset of artist similarity and user-defined tags regarding
583.000 artists gathered from Last.fm. This third-party, publicly available, data about artists similarity and
artists tags is used to produce a visualization of artists relations. RAMA provides two simultaneous layers of
information: (i) a graph built from artist similarity data, and (ii) overlaid labels containing user-defined tags.
Differing from existing artist network visualization tools, the proposed prototype emphasizes commonalities
as well as main differences between artist categorizations derived from user-defined tags, hence providing
enhanced browsing experiences to users.
1 INTRODUCTION
One of the fastest growing media on the web is
web-radio. There are now many web-radios avail-
able where millions of users spend a very signifi-
cant amount of their time. Users can customize a
million-track collection to very specific music tastes.
Web-radios usually allow users to type in a tag that
describes the music they want to hear (e.g. “acid
jazz”, “wake up”, etc.), and music items with that
tag will make up the personalized radio feed recom-
mended to that user. Artist similarities (computed
by methods described in Section 2) are also used
to generate playlists. Albeit very useful, tag-based
or similarity-based playlists are sometimes difficult
for users to understand. The reason why a given
artist or music was “selected” by the web radio is
not always obvious and it can easily become confus-
ing or frustrating for less experienced users that are
unable to clearly express their musical preferences
through queries. For example, very famous artists
(e.g. “U2”) can sometimes be considered “similar” to
other –otherwise quite different– popular artists (e.g.
“Queen”, “Sting”, “Coldplay”, “Counting Crows”),
just because they are also popular or end up receiving
the same relatively uninformative tags (e.g. “pop”).
In this paper, we explore the idea that net-
works of music artists contain rich and multi-
faceted information (music artist similarities, user
tags, etc.) that can be useful for recommendations
that go beyond the creation of playlists. We present
RAMA, Relational Artist MAps, available through
http://pattie.fe.up.pt/RAMA/. RAMA is a visualiza-
tion tool that allows the user to navigate inside the
network of artists of the Last.fm web-radio. Our tool
uses information about artists similarity and artists
tags provided by Last.fm to produce a visualization of
artists relations and corresponding user-defined tags
in a graph, hence fostering the visualization of rela-
tional information. One of the original contributions
of our work over Last.fm’s web interface is to allow
users not only to see which tags are common to a set
of artists, but also those which are specific to a given
artist when compared to similar artists.
2 RELATED WORK
There are different approaches to music recommen-
dation, which makr use of the different facets of mu-
sic. Recommending music items is essentially based
on the definition of a similarity metric between items,
possibly tuned for a particular user. As developed in
greater details in (Celma, 2006), this can be achieved
232
Sarmento L., Gouyon F., Costa B. and Oliveira E.
VISUALIZING NETWORKS OF MUSIC ARTISTS WITH RAMA.
DOI: 10.5220/0001820802320237
In Proceedings of the Fifth International Conference on Web Information Systems and Technologies (WEBIST 2009), page
ISBN: 978-989-8111-81-4
Copyright
c
2009 by SCITEPRESS – Science and Technology Publications, Lda. All rights reserved

by: (i) automatic analysis of contents (i.e. via algo-
rithms computing e.g. rhythmic and tonal descrip-
tions of audio files), (ii) expert analysis (as is the
case of Pandora, or Tapestry
1
), (iii) collaborative fil-
tering (i.e. exploiting a user-item relational matrix),
(iv) co-occurrence analysis (using e.g. crawling tech-
niques to fetch from the web text related to mu-
sic artists and seek co-occurrences of artists names,
terms, etc. (Schedl et al., 2007)), (v) analysis of
meta-information provided by users (i.e. recommend-
ing music clips with a specific tag –e.g. “alternative
rock”). Hybrid alternatives to these techniques also
exist.
The most frequent way for systems to present mu-
sic recommendations to users (e.g. on the Last.fm
website), is by generating lists of potentially relevant
music items (artist names, songs, etc.). An alterna-
tive way, is to provide users with more informative
visualization methods for inspecting the similarities
between music items (Pampalk et al., 2002), (Pam-
palk and Goto, 2007). For instance, a lot of attention
has recently been given to the visualization of artist
networks. In artist networks, two different types of
data are usually presented. On the one hand, there is
traditional encyclopedic data about individual artists.
This includes biographic data such as names of al-
bums, names of music tracks, photos and other im-
ages, etc. On the other hand, there is relational data,
regarding e.g. artist similarities, connections between
them, etc.
A popular metaphor for visualizing these two
types of data is that of connected graphs, where the
data is presented through nodes and edges connect-
ing them. Connected graphs offer a number of “con-
tainers” to represent information (Shneiderman and
Aris, 2006): (i) Node Labels, (ii) Node Attributes,
(iii) Edge Labels, (iv) Edge Attributes (v) Edge Di-
rections (either directed or undirected links). Given
specific types of artist-related data one wants to visu-
alize, a specific mapping must be done onto these data
“containers”. Nodes (or vertices) and edges are also
central to the science of complex networks (Barab´asi,
2002), and a number of works in this field have re-
cently brought some light onto the manifold inter-
twinements of musical artists networks (Cano et al.,
2006), (Teitelbaum et al., 2008). There are several
applications for visualizing artist networks as two-
dimensional connected graphs. For instance Musi-
covery
2
, TuneGlue’s “music map”
3
, Gnod’s “music
1
http://www.amgtapestry.com/
2
http://musicovery.com/
3
http://audiomap.tuneglue.net/
map”
4
, Dimvision’s “music map”
5
, Kyle Scholz’s
music recommendation tool
6
, or the “SimilarArtist-
Graph”
7
by Last.fm user Shoxrocks. These applica-
tions make use of both individual and relational data.
In some applications, nodes can be expanded to reveal
attributes such as label names, dates of album release,
biographies and link to artist websites.
In the above-mentioned applications, data regard-
ing the similarity between artists is gathered from
third parties such as Last.fm or Amazon. Artists (i.e.
nodes) that are somehow similar (i.e. that Last.fm
considers similar, or that Amazon recommend to-
gether) share a link (i.e. are connected via an edge).
A bird eye’s view upon the topology of artist
graphs may reveal clusters of artists, and users can
embrace in one sight artists that are similar to their
query as well as those similar to the answers, and so
on.
Our system also uses third-party (i.e. Last.fm)
similarity data to display music artists in 2D con-
nected graphs, where edges represent similarities. In
our prototype, node labels also convey similar data
as they do. But an original aspect is that we intend to
make further use of node attributes, as well as edge la-
bels, edge attributes and directions, in order to convey
more relational information (i.e. artist commonalities
and specificities) computed from Last.fm data. By
making use of more data, we sought a good balance
between readability (avoiding cluttered use of space)
and richness of the data presented to the user. Hence
the special focus, in the design phase, on a proper use
of graphical features (e.g. colors and transparencies)
as well as interactivity between the user and the pro-
totype (some information is shown by default, some
other only as results of users’ interactions).
3 Last.FM
Last.fm (http://www.last.fm) is one of the leading
internet-based social music platforms, where users
can listen to music, find information about artists they
like, or discover artists they might not know. Follow-
ing Web 2.0 concepts, users can also set up their own
profile, facilitating targeted automatic recommenda-
tions, among other things they can also get informa-
tion about users with similar tastes, gigs in their lo-
cal area, videos, etc. Last.fm provides an interface for
users to collaborativelyedit encyclopedic information
4
http://www.music-map.com/
5
http://www.dimvision.com/musicmap/
6
http://kylescholz.com/projects/speaking/tae2006/music/
7
http://lastfm.dontdrinkandroot.net/
VISUALIZING NETWORKS OF MUSIC ARTISTS WITH RAMA
233
about artists. For some of the more popular artists
there is also extensive biographic information already
available.
User profiles –hence recommendations– are con-
stantly updated via a software (free of use) which
gathers (“scrobbles” in the Last.fm vernacular) statis-
tics about the music listened to by users. User listen-
ing patterns are recorded and analyzed by Last.fm in
order to better organize and recommend music. Users
are also encouraged to organize the music they lis-
ten to by assigning tags to artists, or even to spe-
cific albums or tracks. The definition of tags is up
to the users and can describe any aspect users believe
are relevant, as music genres (e.g. “rock”, “Viking
metal”), locations (e.g. “Berlin”), mood (e.g. “chill”),
opinions (e.g. “songs my mother would like”), con-
texts (e.g. “love”) or just about anything that cross
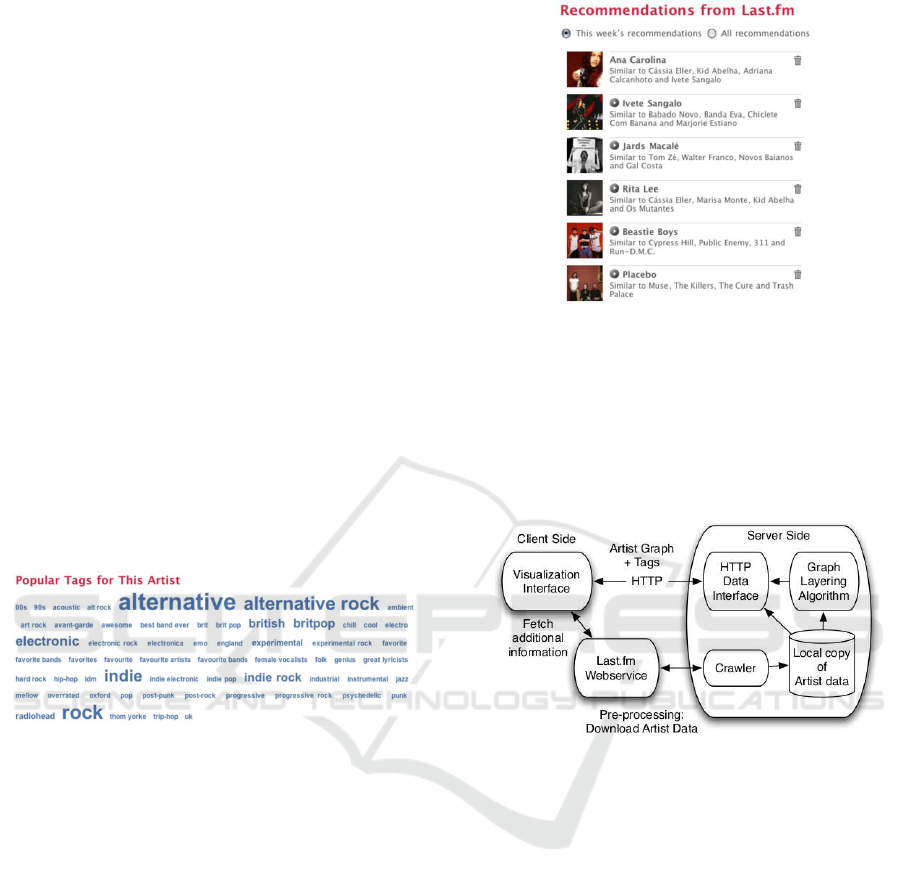
users’ minds (see Figure 1 for examples of tags as-
signed to the band “Radiohead”). Tagging music
helps users to browse Last.fm contents. But the real
power of tags becomes clear when considering that
tags of hundreds of thousands of users are combined,
providing an emerging “bottom-up” categorization of
music.
Figure 1: List of user tags for the band “Radiohead”. Sizes
of the letters correspond to popularity of the tag.
A cornerstone of Last.fm functionalities resides in
links of similarity between artists (which can be seen
on Figure 2 (a simple list), and which is central to au-
tomatic recommendations made to users). The algo-
rithm used for computing similarities between artists
is unknown –to the authors of this paper– but is prob-
ably based on (i) the analysis of user-added tags, (ii)
user listening patterns such as co-occurrence statistics
(users that listen to artist X also listen artist Y), and
(iii) user profiles information (“similar” users should
like “similar” artists).
4 RAMA: RELATIONAL ARTIST
MAPS
RAMA is built on top of a client-server architecture.
The visualization is performed on the client side (the
user application) using information obtained from the
Figure 2: Personal artist recommendations made by Last.fm
to one of the authors of this paper.
server via an HTTP request. The server manages the
data that has been extracted from Last.fm site and per-
forms all the necessary pre-processing operations to
provide the client with the information needed for vi-
sualization.
Figure 3: System overview.
Given an initial query (i.e. an artist name) submit-
ted by the user through a text-box in the client appli-
cation, a request is sent to the server which provides
all the information that the client application requires
to draw the corresponding artist network. The net-
work contains the artists that are found to be more
similar to the queried artists, according to Last.fm’s
artist similarity index. It also contains the artists that
are found by propagating the similarity query to the
previously found ones so that we obtain artists sev-
eral levels away from the initial artist. This allows
the user to see the artist position in wider context (see
e.g. Figure 4). The server provides the client with
a list containing information regarding each node in
the graph (i.e. each artist in the network), namely: (i)
the 2D coordinates of the corresponding node in the
graph, computed by our graph layering algorithm (see
Section 4.2); (ii) the list of user-defined tags for each
artist as taken from Last.fm site; (iii) explicit similar-
ity relationships with other artists in the network (for
WEBIST 2009 - 5th International Conference on Web Information Systems and Technologies
234

drawing the necessary edges) as taken from Last.fm
site. Once the visualization is rendered by the client
application, users can either insert another query in
the text-box, or browse through the network, inter-
actively consulting tag information, and performing
additional queries by clicking on the nodes. Interac-
tion continues in this fashion until the user quits the
application.
4.1 Data Pre-processing
Our system uses data that is freely available through
Last.fm web-services API
8
. Through this web-service
developers can access different data categories related
to Last.fm users and media. Available data includes:
(i) the profile of users of Last.fm, (ii) information
and statistics related to artists, their albums and corre-
sponding music tracks, (iii) tag information for each
of the previous items, (iv) information about user cre-
ated groups (e.g. fan groups), (v) information about
message forums that users can create/participate, and
(vi) geo-aware statistics about users and music pref-
erences (more details can be found in the web service
site). From all the data available, our system uses cur-
rently only data specially concerning artists, namely:
• basic artist data: name, URL of image, “popular-
ity” index within Last.fm community,
• the list of the most similar artists for each artist.
Last.fm assigns each similar artist a weight rang-
ing from 100 (full similarity) to 0 (almost no sim-
ilarity).
• information about the user-defined tags for each
artist. Again, Last.fm assigns weights to quantify
the association level for that tag: 100 means full
association, while 0 indicates loose association.
Because each individualaccess to the Last.fm web
service involves a considerable overhead due to net-
work latency and server load, we created a local
copy of the data we needed by crawling the web-
service systematically. For a period of about a week
(from January 30 to February 4 2008) we consulted
Last.fm’s web-service and obtained the previously de-
scribed data for a total number of 583.000 artists. Lo-
cal access to this data allowed to speed-up experi-
mentation and to improve the global performance of
our system. Although the Last.fm user community
is constantly contributing and changing this informa-
tion, we can assume that the relationships between
artists, which are the focus of our work, are more or
less stable, at least for the reasonably popular artists.
In any case, the crawling procedure can be repeated at
any time in order to update data.
8
http://www.audioscrobbler.net
4.2 Layering the Graph
For layering the graph corresponding network of
artists in a 2D plane, we implemented our own graph
drawing system based on a force-directed placement
strategy (Fruchterman and Reingold, 1991). Our im-
plementation, in Perl, is completely integrated in the
overall server-side framework which was also imple-
mented in Perl. There are several parameters related
to the graph layering operation that need to be set in
order to create an appealing and useful visualization.
The first parameter concerns the number of nodes (i.e.
artists) that should be included in the graph. We wish
to convey as much information as possible but we are
limited to a given frame size. Layering graphs with
many labeled nodes –which may have other attributes
to be drawn– in a regular computer screen may gen-
erate rather confusing visualizations. Therefore we
need to limit the number of nodes to a reasonably low
value, for example between 15-50 nodes.
The second parameter has to do with the size of
the context we wish to convey. Since we are limit-
ing the number of nodes to a given maximum, there is
a balance between (i) choosing more nodes that are
closer to the initial artist, and thus providing more
detail about the close relations of that artist, or (ii)
choosing more nodes that are a few links away from
the artist and thus provide a wider perspective about
the artist and its relations.
Our goal is to combine a good level of local detail
with a wide enough perspective, and achieve a good
balance between readability and richness of data pre-
sented to the user. We have defined 3 parameters to
configure the properties of the network to be drawn
around a given artist:
• Level-1 BranchingFactor: this parameter controls
how many nodes directly connected to the initial
one are to be visualized (the nodes chosen are the
top similar ones).
• Level-n BranchingFactor: this parameter controls
how every node in the graph except the initial one
will branch.
• Maximum Branching Distance: this parameter
imposes a threshold on the maximum branching
distance, i.e. how many links away can nodes be
from the initial artist node.
With these parameters we perform an iterative expan-
sion of the initial artist node, branching each node ac-
cording to the corresponding factor. Increasing level-
1 branching will promote local detail, while increas-
ing level-n-branching and maximum branching dis-
tance will widen the context. In any case the number
VISUALIZING NETWORKS OF MUSIC ARTISTS WITH RAMA
235
of nodes can never exceed a given pre-defined thresh-
old.
4.3 User Interface
The user interface was developed in Processing
9
and
is responsible for generating the visualization and
providing interactivity. Initially, the user can enter a
name of an artist in a text-box. A query is then sent
via HTTP to the server, which replies with the artist
network data. For each artist (i.e. each node) in the
network, the server sends back to the client the fol-
lowing data: (i) the name, (ii) a popularity index, (iii)
the url of the photo of the artist in Last.fm server, (iv)
the top 20 user-defined tags, (v) information about
similarity with other artists (i.e. the node edges and
their weights), and (vi) the coordinates for placing the
corresponding node of the graph in a 2D plane. All
this information is sent to the visualization interface
in text format to allow a simple parsing procedure.
The interface application uses additional data that
is directly fetched from Last.fm site at runtime,
namely artist pictures and a short biographic descrip-
tion. For these media items performance constraints
are not so severe (only two extra accesses for each
artist in the network), so the interface can access that
information directly as needed without requiring any
intervention from the server.
On top of the basic network structure we place in-
formation related to user-defined tags. However, in-
stead of presenting all the tags assigned to each artist
overits correspondingnode, we try and place the most
common tags in the network in a such position that
they will simultaneously describe all artists contained
in a certain part of the network (simple animations of
these tags permit to avoid readability problems). Such
tag information is shown by default, no action be-
ing required from the user, allowing the user to easily
identify the attributes that explain why certain artists
are clustered in a specific part of the network.
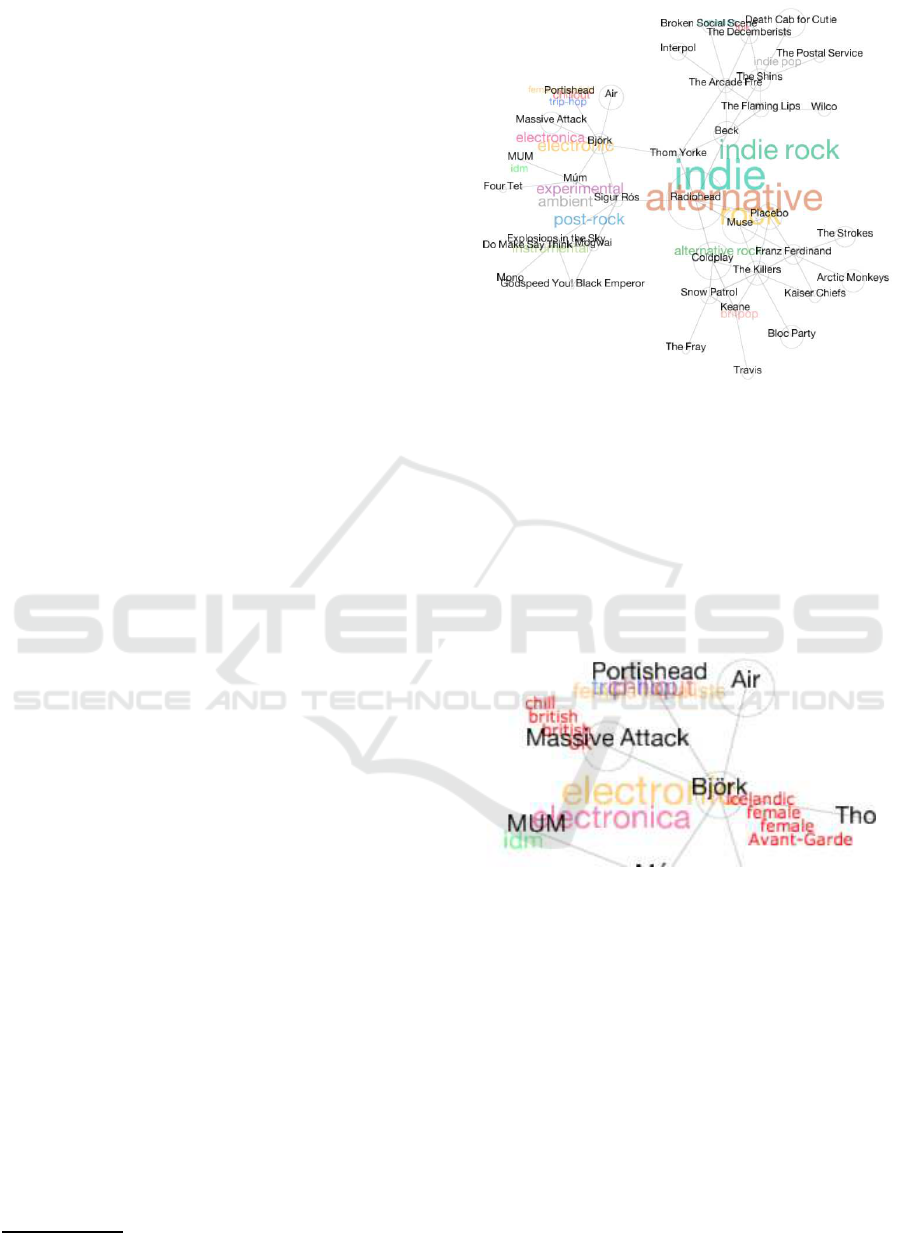
For instance, in the network of “Radiohead” (see
Figure 4), one can identify a region of artists tagged
as “alternative” in the center because such a tag is
common to most artists in the whole network. On the
other hand, the region on the top-left branch is tagged
“electronica”, the common attribute of artists in that
part of the network. Tag sizes are proportional to the
number of artists for which they are relevant.
Moving the mouse cursor on top of a specific artist
node results in the presentation of diverse data: the
artist picture, a short description and bio (gathered
at run-time from the Last.fm site), and a link to its
Last.fm webpage. Left-clicking on any artist name
9
http://www.processing.org
Figure 4: Example graph for artist “Radiohead”.
has the same effect as entering its name in the query
box, i.e. sending a new query and refreshing the map
with this query as seed. This allows simple user nav-
igation through the artist network. To ensure that vi-
sualization always exhibits some degree of novelty, a
new graph layout is computed in real time for each
query, even if the query has been processed before.
Figure 5: Examples of specific tags for artists “Bjork” and
“Massive Attack”, both part of the “Radiohead” network.
An original feature of our user interface resides in
the possibility to visualize tags that are specific to an
artist in relation to another, i.e. those tags that are
relevant to an artist but not to its neighbors. This in-
formation is shown only when the user crosses the
mouse cursor over an edge. This action will result
in the rendering of the tags that are specific to each
of the two artists at their respective sides of the edge.
In Figure 5 one can see an example of such a behav-
ior. “Bjork” and “Massive Attack” are both part of the
“Radiohead” network. Although they are both on a
region characterized by the “electronic” tag, the tags
“icelandic”,“female” and “avant-garde” are only as-
signed to “Bjork”, while the tags “UK”, “british” and
WEBIST 2009 - 5th International Conference on Web Information Systems and Technologies
236
“chill” are assigned only to “Massive Attack”. This
provides a very clear description of the unique fea-
tures of each artist in the network. We believe this
to be a very powerful tool in increasing user under-
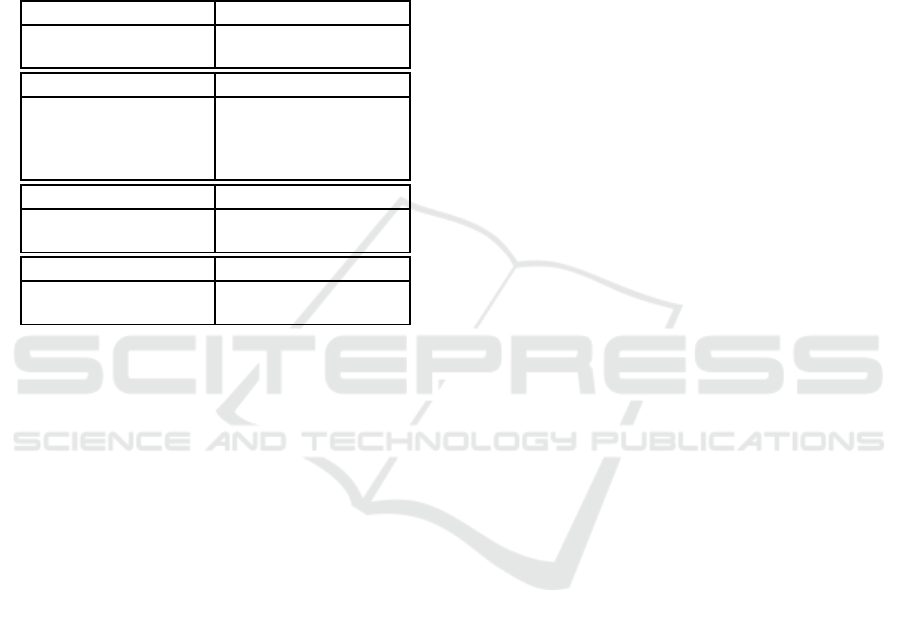
standing about the network data. Table 3 shows a few
more examples of tags that are found to be specific to
a given artist (“Radiohead”) when compared to other
artists in its network.
Table 1: Pairwise discriminative tags between “Radiohead”
and other similar artists.
Radiohead Sigur Ros
UK, pop, britpop, art
rock
shoegaze, chillout, ice-
landic, ethereal
Radiohead Thom Yorke
progressive rock, 90s,
post-rock, experimental
rock
radiohead, trip-hop,
electro, chillout,
singer-songwriter, male
vocalists
Radiohead Placebo
art rock, experimental,
UK
emo, glam rock, metal,
punk
Radiohead Muse
electronica, art rock,
post-rock
progressive, emo, metal
5 CONCLUSIONS AND FUTURE
WORK
RAMA provides a simple yet efficient interface to
navigate through the network of similar artists, allow-
ing users to obtain a wider view about the artists they
know, and toeasily discover newbands and artists that
they might like. It provides two simultaneous layers
of information: (i) a graph built from artists and their
connections, and (ii) overlaid labels containing user-
defined tags that express the classification made by
Last.fm community for each of the artists. From ex-
perimentation we have observed that the system effec-
tively allows to identify clusters of tightly connected
band and artists (such as for example former mem-
bers of a band that pursued a solo career). Addition-
ally, the visualization procedure in RAMA also em-
phasizes the main differences between artists, allow-
ing the user also to visualize which are the most dis-
tinctive attributes of each artist.
Future work includes enhancing user experience
by adding song snippets for each artist, so that the user
can play them on demand while navigating across the
network. Also, we plan to improve interactivity by
allowing the user to optionally navigate though user-
defined tags, and not just artists. We will also focus
on allowing the user to manipulate the graph (zoom-
ing, rotating, etc) and to edit it. Editing capabilities
will enable the user to remove nodes (artists) from the
graph, expand only some, and thus generate a person-
alized graph, which could then be saved e.g. in the
form of a playlist.
ACKNOWLEDGEMENTS
This work was partially supported by grant
SFRH/BD/ 23590/ 2005 from FCT (Portugal),
co-financed by POSI. Thanks to Elias Pampalk from
Last.fm for insightful comments.
REFERENCES
Barab´asi, A. (2002). Linked: The New Science of Networks.
Perseus Publishing.
Cano, P., Celma, O., Koppenberger, M., and Buld´u, J.
(2006). The topology of music recommendation net-
works. Chaos, 16(013107).
Celma, O. (2006). Music recommendation: A multi-faceted
approach. Master’s thesis, Universitat Pompeu Fabra,
Barcelona.
Fruchterman, T. M. J. and Reingold, E. M. (1991). Graph
drawing by force-directed placement. Softw. Pract.
Exper., 21(11):1129–1164.
Pampalk, E. and Goto, M. (2007). MusicSun: A new ap-
proach to artist recommendation. In Proceedings of
the International Conference on Music Information
Retrieval.
Pampalk, E., Rauber, A., and Merkl, D. (2002). Content-
based Organization and Visualization of Music
Archives. In Proceedings of the ACM Multimedia,
pages 570–579, Juan les Pins, France. ACM.
Schedl, M., Knees, P., Widmer, G., Seyerlehner, K., and
Pohle, T. (2007). Browsing the Web Using Stacked
Three-Dimensional Sunbursts to Visualize Term Co-
Occurrences and Multimedia Content. In Proceedings
of the 18th IEEE Visualization Conference.
Shneiderman, B. and Aris, A. (2006). Network visualiza-
tion by semantic substrates. IEEE Transactions on Vi-
sualization and Computer Graphics, 12(5).
Teitelbaum, T., Balenzuela, P., Cano, P., and Buld´u, J.
(2008). Community structures and role detection in
music networks. Chaos, 18(043105).
VISUALIZING NETWORKS OF MUSIC ARTISTS WITH RAMA
237
