
DEVELOPMENT OF A WEB-AVAILABLE EPIDEMIOLOGICAL
SURVEILLANCE SYSTEM INTEGRATING
GEOGRAPHIC INFORMATION
The Public Health Emergencies Support System at
the Portuguese General Directorate for Health
CCCCCCCCCCAndré Oliveira and Pedro Cabral CCCCCCCCCCCC
Instituto Superior de Estatística e Gestão de Informação (ISEGI)
Universidade Nova de Lisboa, 1070-312 Lisboa, Portugal
Keywords: Systems Integration, Internet, Geographic Information Systems, Epidemiological Surveillance.
Abstract: The application of geographic information tools in Public Health management already includes many areas
of study, one of which deals with the integration of Geographic Information Systems (GIS) in
epidemiological surveillance systems, with the objective of aiding Public Health officials in decision-
making. Some of these systems are already operational in several countries, acting in various spatial and
temporal scales, and with different levels of priority. The present article introduces the development of a
Public Health spatial data management infrastructure within the Portuguese General Directorate of Health,
baptized Public Health Emergencies Support System and essentially aimed at performing epidemiological
surveillance tasks. This is a multiplatform environment that brings together relational databases, geographic
information systems and web technology, making it possible to supply daily and weekly updated results to
health officials through the Internet. Satisfactory results were obtained with the implementation of SSESP,
since most of the planned infrastructure and functionalities are already operational. Some of the system’s
present handicaps and evolutionary perspectives are also discussed.
1 INTRODUCTION
There is an increasing conscientiousness about the
importance of detecting and interpreting spatial
distribution patterns of public health-related
phenomena, which is closely associated to an array
of new technologies recently made available to
researchers and professionals operating in this field
of expertise. Amongst these technologies,
Geographic Information Systems (GIS) occupies a
special place, and its contribution is already felt in
several public health application domains. These
applications range from understanding the
importance of environmental factors in the etiology
of certain diseases, to improving the efficiency of
delivering health care services to populations, where
they contribute to optimal location models for health
infrastructures, just to cite the most relevant.
These case studies and applications can be
included in the context of Health Geography, a
recent field of study (formally recognized in 1992).
This scientific area constitutes a methodological
platform, integrating and articulating knowledge
from the Earth, Social and Health Sciences, that
works as a holistic tool to study current problems at
different scales of analysis (Santana, 2005). Since
this is a broad area of studies, it can be further
divided in two main domains: Disease Geography
and Geography of Health Care Systems. According
to Boulos et al. (2001), Disease Geography deals
with the exploration, description and modeling of
the spatiotemporal incidence
1
of diseases and related
environmental phenomena, detection and analysis of
disease patterns and clusters
2
, the analysis of the
causes and the generation of new hypothesis. As for
Geography of Health Care Systems, it deals with the
planning, management and delivery of adequate
health services, providing, amongst other things,
adequate patient access to these services, after
determining the health needs of target communities
in terms of medical care as well as the service areas
238
Oliveira A. and Cabral P.
DEVELOPMENT OF A WEB-AVAILABLE EPIDEMIOLOGICAL SURVEILLANCE SYSTEM INTEGRATING GEOGRAPHIC INFORMATION - The Public Health Emergencies Support System
at the Portuguese General Directorate for Health.
DOI: 10.5220/0001822502380243
In Proceedings of the Fifth International Conference on Web Information Systems and Technologies (WEBIST 2009), page
ISBN: 978-989-8111-81-4
Copyright
c
2009 by SCITEPRESS – Science and Technology Publications, Lda. All rights reserved

of health services, which include health promotion
and disease prevention activities.
Deeply related with these areas is another more
specific investigation and application domain known
as Public Health Surveillance. Lawson (2006)
defines this activity as the systematic and continuous
retrieval of health data for analysis and
interpretation, for planning, implementation and
evaluation of public health practices, as well as the
dissemination of these data to public health
authorities in appropriate time, so that it can
ultimately be used in prevention and control. This
activity is operated through dedicated systems,
currently known as Epidemiological Surveillance
Systems, which main task is to survey the eventual
outburst of epidemics
3
. There are already multiple
systems of this kind in present days, and they act in
multiple spatial and temporal scales, and with
different priority degrees. Amongst several other
examples is the Integrated System for Public Health
Monitoring of the West Nile Virus (Gosselin et al.,
2006) operating in the province of Quebec, Canada
and EpiGIScan (Reinhardt et al., 2008), dedicated to
real-time surveillance of Meningococcal Meningitis
in Germany.
The eminent threat of an influenza pandemic
potentially caused by an eventual mutation of the
H5N1 virus, making it transmissible between
humans, has triggered the development of strategies
and information systems to deal with this situation.
In this context, the development of epidemiological
surveillance systems integrating several types of
technologies such as relational database systems,
geographic information tools and web information
distribution technologies has recently known
increased interest and investment. In fact, bringing
these technologies together makes it possible to
combine the power of massive health data
processing with the ability of detecting spatial
patterns of disease distribution and also
communicate decision-making critical information
to public health officials in due time. These
capabilities are decisive in our days, since
globalization has a controversial effect on world
population health; on one hand, the fast pace of the
global movement of people and goods are the recipe
for rapid spread of diseases and vectors
4
, increasing
pandemic
5
risk; on the other hand, information and
communication technologies are allowing health
authorities to improve analysis methods and tools,
transmit valuable information and, creating networks
that can signal alerts and allow health officials to
coordinate efforts on unprecedented geographic and
temporal scales.
This situation was the driving factor for the
development of an epidemiological surveillance
system and public health data management
infrastructure, physically located within the
Portuguese General Directorate for Health (DGS),
baptized Public Health Emergencies Support System
(SSESP).
This article aims to introduce the system, in its
implementation, architecture, functionalities and
future perspectives. Thus, the second section
introduces SSESP development phases, starting with
planning and moving from conceptual and logical
modeling to physical implementation, including
present system architecture and capabilities. The
third and final section discuss system´s strengths and
limitations, projected but not yet implemented
functionalities and draws on future prospects and
recommendations
.
2 SYSTEM DEVELOPMENT
The initial step in putting the system together was to
perform a state of the art analysis of the
epidemiological surveillance carried on within DGS.
During this phase, public health officials,
epidemiologists and information systems
professionals were consulted, previously existing
systems were identified and observed, and a cost-
benefit analysis was performed, in an effort to
identify the necessary functionalities to be
implemented, which, in turn, would influence the
physical architecture of the system. As the outcome
of this first phase, functional specifications were
listed, which implied essentially to build upon some
of the existing capabilities and also to prepare some
totally new ones.
In fact, prior to the development described here,
a semi-automatic epidemiological surveillance
system, Hospital and Health Centers Emergency
Information System (SIU) was already operating in
DGS. It consisted of an Oracle 9i database, into
which data regarding episodes of emergency
services demand in public hospitals (SONHO
system) and health centers (SINUS system) of the
Portuguese mainland, was automatically transferred
on a daily basis and stored. This database was, in
turn, connected via Open Database Connectivity
(ODBC) to a Microsoft Access 2003 database, were
data processing was performed, manually started on
a daily basis by a person in charge. This person was
also in charge of using Microsoft Excel 2003 to
DEVELOPMENT OF A WEB-AVAILABLE EPIDEMIOLOGICAL SURVEILLANCE SYSTEM INTEGRATING
GEOGRAPHIC INFORMATION - The Public Health Emergencies Support System at the Portuguese General Directorate
for Health
239
produce charts and tables containing surveillance
information and, finally, Microsoft Word 2003 and a
File Transfer protocol (FTP) connection to update a
dedicated website with these products, where they
were displayed and made available to health
officials. This previous system was considered
inadequate to current needs, and it was thus decided
that: (1) the whole apparatus of daily manual
processing of data should be replaced by an entirely
automatic one; (2) the current supporting
infrastructure should combine storage and
simultaneous processing of alphanumeric and
geographic data; (3) all daily alphanumeric data
processing tasks should be executed within a robust
relational database management system; (4) the
existing website should be replaced by a new one
containing all the previous products, plus
geographical display capabilities. It should also bear
more usability (Nielsen and Loranger, 2006) to the
final user and be updated on a daily basis.
After the definition of the system guidelines, the
next stride was to define the specifications of the
information to be produced. It was decided that the
system should produce and display daily demand
numbers, separated per three main groups (hospital
emergency services, health centers emergency
services and both). Each group should be further
separated into: Portuguese mainland and per
District; all ages and also per age groups (0-14, 15-
24, 25-44, 45-64 and more 65 years old). The
information should be presented using line charts,
tables and thematic maps to monitor daily evolution
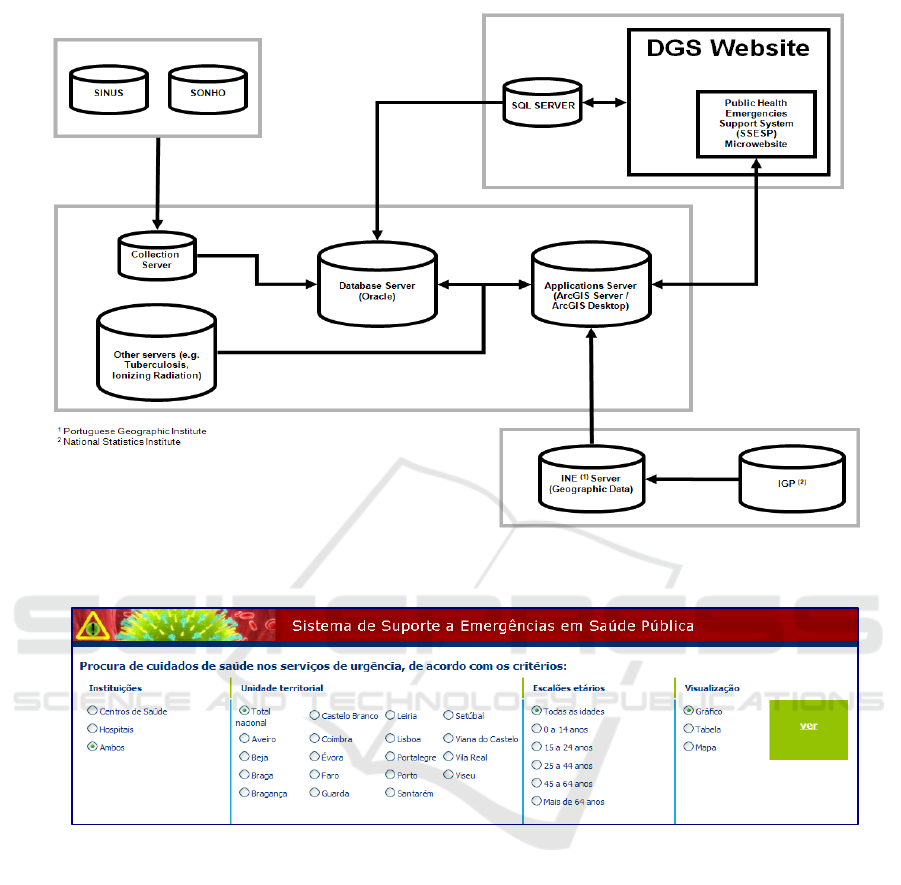
Figure 2: Information filtering options.
Figure 1: System Architecture.
WEBIST 2009 - 5th International Conference on Web Information Systems and Technologies
240
and spatial distribution of the demand. It was further
decided that epidemiological alert levels were to be
analyzed on a daily and weekly basis. Thus, weekly
alert levels should be displayed using line graphs; as
for daily alert levels, the system should be capable
of sending alert messages automatically through
electronic mail, after previously comparing demand
levels with previously established reference
thresholds. From this point on, the system´s
architecture was modeled, as well as each
component separately, and it was also decided which
types of data should be included. As the final result
of this process, an integrated environment was
obtained, as depicted in figure 1. The essential
entrance point to the system is a first server
(collection server) incorporating an Oracle 9i
database that daily accesses the various local servers
at hospitals and health centers automatically and
collects stored demand episodes.
This is a Sun SPARC II server operating on Sun
Solaris 8, were all code and mechanisms regulating
access to hospitals and health centers of the SONHO
e SINUS systems have been programmed. The core
of the architecture consists in two servers, identical
in hardware and operative system (Intel Dual Xeon
processor, 10 Gigabytes RAM memory, 300
Gigabytes hard disk storage capacity, operative
system Microsoft Windows 2003 Server R2 32 bits).
One of these is used as database server, containing
an Oracle 10g (10.2.0.1) database, which does the
massive part of the data processing, since demand
data is automatically transferred here, after being
gathered by the collection server, and then processed
in a daily sequence of scheduled tasks. The second
server (applications server) is the webserver, since it
includes all software applications to generate and
manage the website, and also contains the
geographic information system. The following
software applications are installed in it:
- ESRI ArcGIS Server 9.2: supports the WebGIS
component of SSESP; in other words, supports the
displaying of geographic contents online.
- ESRI ArcGIS 9.2: supports the preparation of
thematic maps and spatial analysis;
- Microsoft Visual Studio Professional 2005:
programming environment for creating the website;
- Microsoft Internet Information Services (IIS) 6.0:
Webserver software.
The website is the front-end of the system, and it
contains all final products except alerts sent via e-
mail. It was programmed in C# language and can be
accessed through DGS website, where there are two
levels of access, public and restricted to public
health officials. Database tables containing
surveillance information are permanently connected
to the website that displays the final products; these
are automatically updated once daily data processing
is complete. All products refer to the events of the
previous day.
After the first page of the website, the second
page contains user-available surveillance
information, and is divided in two functional parts.
The upper part is used to select the desired product,
and the lower part displays the result. As it can be
seen on figure 2, the upper part contains several
options groups that filter the information to be
displayed. From left to right, it is possible to choose
between hospitals, health centers or both; between
district or national results; all ages or age groups;
and finally deciding if the information should be
visualized as line charts, tables containing raw
demand values or a map, which is displayed in both
public and restricted areas. This is a choroplet map
that illustrates demand at the district level, using an
interval scale of 5 classes displayed as graduated
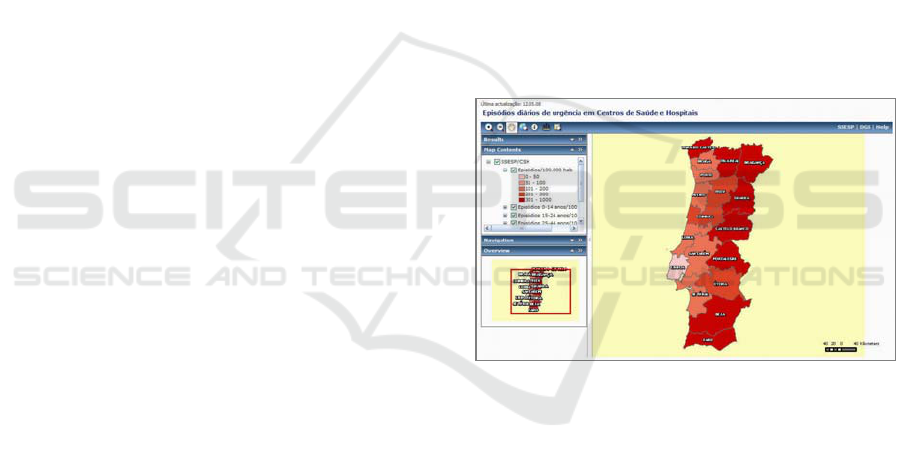
colors (figure 3).
Figure 3: Daily demand map.
Values represented on maps are a ratio, being the
crude demand values divided per 100.000
inhabitants, a common epidemiological measuring
unit (Beaglehole et al., 1993). These authors also
point out that the main factors in epidemiological
analysis are time (regarding the time frame into
which events take place), space (in the geographic
sense) and the affected persons (their number and
characteristics). Therefore, monitoring daily events
is insufficient, if not combined with the analysis of
the temporal evolution of demand, which is assured
in SSESP using line charts. The public part of the
website contains line charts displaying the evolution
of demand on a national scale (hospitals + health
centers) for the current year, as well as lines
representing evolution in the years of 2003 and
2005, which are considered a valid referential. The
DEVELOPMENT OF A WEB-AVAILABLE EPIDEMIOLOGICAL SURVEILLANCE SYSTEM INTEGRATING
GEOGRAPHIC INFORMATION - The Public Health Emergencies Support System at the Portuguese General Directorate
for Health
241
restricted area presents line charts bearing the same
information at district level.
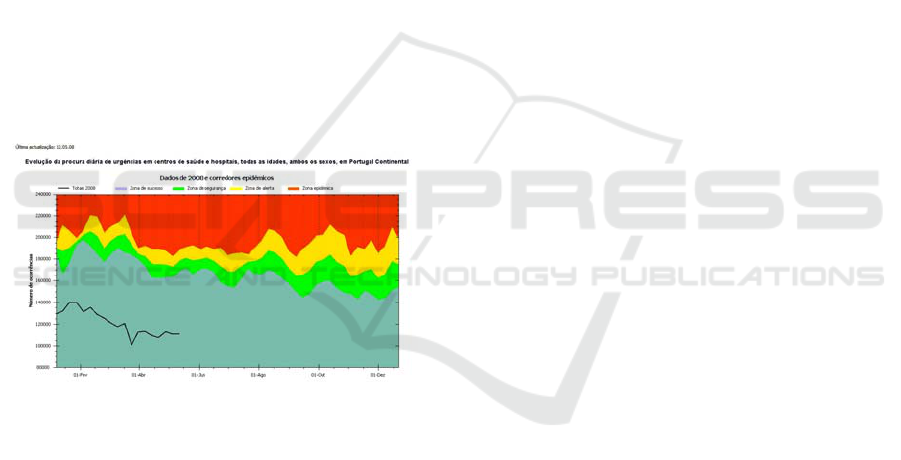
However, to be efficient, epidemiological
surveillance needs to employ mechanisms enabling
it of detecting outbreaks
6
as early as possible, so that
investigation and control actions can be taken
timely. One critical question is the choice of demand
thresholds beyond which an alarm situation should
be triggered. To do this, SSESP uses the endemic
corridors methodology of Bortman (1999), which
plots four areas on a chart. These are classified,
according to the gravity of the situation, as “success
zone”, “security zone”, “alert zone” and “epidemic
zone”. A line, representing weekly demand, is
plotted over these areas. Based upon this method,
SSESP supplies two products: a national weekly
endemic corridor (figure 4), and the automatic
emission of alerts through e-mail, evaluated on a
daily basis with a daily corridor which is not
graphically represented. These two products are
meant to be used together: every time an alert is sent
the evolution of the weekly line in figure 4 should be
continuously observed, since a consistent increase in
its height and angle can be an epidemic.
Figure 4: Weekly endemic corridor.
Finally, the tables including crude demand
values include values regarding current and previous
year. This is a complementary form of analysis,
since sometimes the analysis of the remaining media
is insufficient. Additionally, this tabular data can
also be used to support other types of statistical
studies in a different environment.
3 CONCLUSIONS
This is a system under development that has already
been beneficial to public health decision support in
several occasions. Most of the planned architecture
is completed and operational being the main
implementation objectives attained.
This infrastructure presents several advantages.
The use of a user-friendly website that does not
require any technical knowledge of databases or GIS
applications enables seamless dissemination of vital
information to final users. It also features low cost to
final users, since no application has to be installed
locally and only a computer and Internet connection
are necessary. Although its main use is surveillance,
it is able to support epidemiological background
studies, since it constitutes a Data Warehouse to all
collected surveillance data.
Some additional features are planned. One of
these would be to enable users to remotely introduce
epidemiological data directly into the system, such
as the point location of a disease outbreak,
contaminated well or a new health service. The
systems’ geographical database includes total digital
aerial orthophotographic coverage of the Portuguese
mainland, as well as road network cartography,
administrative divisions, point location of hospitals
and health centers, amongst others. These several
datasets can be combined in a map window that
helps the user locating the desired event, a dialog
box allows him to classify the event and finally a
simple mouse click on the location transfers map
coordinates and associated attributes to a table on
the database for later use. Another planned feature is
to implement automatic alert production at the
district scale, since the present national coverage is
sometimes insufficient. Plus, alert messages should
also be sent via short message service (SMS), in
addition to the present use of e-mail. Another related
feature would be to produce a map depicting the
daily alert level, since no illustration of the daily
alert level is presently produced.
Besides some communication problems and
system architecture details that can easily be solved,
the most crucial limitation lies in the data it receives.
No data is received concerning the diagnosis
associated to each emergency service demand
episode, only the motive (e.g. disease, accident),
which is still too general. This is a critical limitation
to the analysis capabilities, and there are already
several epidemiological surveillance systems
worldwide that make use of this kind of information,
such as GeoMedStat (Li et al., 2006), which uses the
International Classification of Diseases, ninth
revision (ICD-9) to encode each demand episode,
with very interesting results in outbreak surveillance
and detection. Other critical question is the fact that
SSESP does not receive data from all services;
several hospital emergency services are still outside
it. This is a crippling factor, since data from all
emergency services in the country should be
WEBIST 2009 - 5th International Conference on Web Information Systems and Technologies
242

received, in order to provide the full picture of the
daily health situation in Portugal, not a partial one.
The final picture is optimistic, though. Although
a certain array of problems subsist, much was
already achieved, and there is certainly a will to go
forward in system development, which implies a
constant effort to correct present insufficiencies and
adding new functionalities.
ACKNOWLEDGEMENTS
The authors would also kindly like to thank SSESP
project team members Mário Carreira (Coordinator),
Carla Cardoso (Statistician), Tatiana Plantier and
Ricardo Henriques (WebGIS developers).
REFERENCES
Beaglehole, R., Bonita, R. & Kjellström, T. (1993) Basic
Epidemiology, World Health Organization.
Bortman, M. (1999) Elaboracion de corredores o canales
endémicos mediante planillas de cálculo. Revista
Panamericana de Salud Pública, 5, 1-8.
Boulos, M., Roudsari, A. & Carson, E. (2001) Health
Geomatics: an enabling suite of technologies in health
and healthcare. Journal of Biomedical Informatics, 34,
195-219.
Colin, P. (2005) Dictionary of Medical Terms London, A
& C Black.
Cromley, E. & Mclafferty, S. (2002) GIS and Public
Health New York, The Guilford Press.
Epa (2008) Thesaurus of Terms Used in Microbial Risk
Assessment Environmental Protection Agency.
Gosselin, P., Lebel, G., Rivest, S. & Douville.Fradet, M.
(2005) The Integrated System for Public Health
Monitoring of West Nile Virus (ISPHM-WNV): a
real-time GIS for surveillance and decision-making.
International Journal of Health Geographics, 4:21.
Lawson, A. (2006) Statistical methods in spatial
epidemiology, West Sussex, John Wiley & Sons.
Li, H., Faruque, F., Williams, W. & Finley, R. (2006)
Real-Time Syndromic Surveillance. ArcUser
Magazine, 9 (1):17-19.
Nielsen, J. & Loranger, H. (2006) Prioritizing Web
Usability, Berkeley, New Riders.
Reinhardt, M., Elias, J., Albert, J., Frosch, M., Harmsen,
D. & Vogel, U. (2008) EpiScanGIS: an online
geographic surveillance system for meningococcal
disease. International Journal of Health Geographics,
7:33.
Santana, P. (2005) Geografias da saúde e do
desenvolvimento, evolução e tendências em Portugal
Coimbra, Edições Almedina.
1
Incidence corresponds to the number of episodes of a specific
disease happening in a population in a specific time period
(Beaglehole et al. 1993).
2
Atypical concentrations of public health events in time and
space (Cromley and McLafferty, 2002).
3
An Epidemic is the occurrence of an abnormally high number of
cases in a specific area or population, considering the area or the
time frame (Beaglehole et al. 1993).
4
Insect or other animal carrying a disease susceptible of being
transmitted to human beings (Colin, 2005).
5
An epidemic that occurs globally, or over a very wide area,
spreading through international borders, generally affecting a
large number of persons (EPA, 2008).
6
The sudden occurrence of several episodes of a specific disease
(Colin, 2005).
DEVELOPMENT OF A WEB-AVAILABLE EPIDEMIOLOGICAL SURVEILLANCE SYSTEM INTEGRATING
GEOGRAPHIC INFORMATION - The Public Health Emergencies Support System at the Portuguese General Directorate
for Health
243
