
INTERNATIONALISING THE MANAGEMENT INFORMATION
SYSTEMS MODULE
Andreas Gregoriades
*
, Maria Pampaka
†
and Vicky Papadopoulou
*
*
Computer Science and Engineering, European University Cyprus, Cyprus
†
School of Education, The University of Manchester, U.K.
Keywords: Concept Mapping Assessment, Internationalisation of Education, Management Information Systems.
Abstract: The work described here draws on the emergent need to internationalise the curriculum in higher education.
The paper in particular focuses on the internationalisation of the Management Information Systems (MIS)
module and the identification of learning differences among the two dominant cultural groups in higher
education in the UK: Asian and European students. The identification of differences among knowledge
patterns of these cultural groups is achieved through the application of a concept mapping technique. The
research question addressed is: How can we internationalise the MIS module’s content and teaching
methods to provide for students from different cultural backgrounds?
1 INTRODUCTION
The increased diversity of students from different
cultural backgrounds is pushing universities to
internationalise their curriculum to better reflect a
global perspective of students’ experience (UUK,
2005). This process helps students develop the skills
and knowledge to operate effectively in the global
workplace environment. By definition,
internationalisation of the curriculum is the process of
integrating an international dimension into the
teaching, research and service functions of an
institution of higher education, with the aim of
strengthening international education (Teekens,
2002). To that end, the teaching material and methods
in higher education should integrate aspects from a
range of different cultures and ethnic backgrounds to
promote cross-cultural awareness. With regards to the
MIS module at our university, there are two dominant
communities in the student population: European, of
which the majority is of British origin and Asian of
which the majority is of Chinese origin. In particular,
for the academic years 2005 to 2008 the average
percentage of Asian and European students in the
MIS module was 17% and 82%, respectively. Hence,
the need to study the learning styles of the two
cultural groups was of essence.
The focal point of this research aims to evaluate
the level of learning among students of these two
groups and subsequently, infer their causal factors
using domain knowledge. Results from this process
are used in redesigning the MIS module to better
serve the needs of modern university classes.
A factor contributing towards the increasing need
to internationalise curriculum in higher education
stems from the fact that the learning styles among
Asian and European students differ. According to
Marton et al. (1993) Chinese students’ leaning style is
greatly based on memorising concepts which
constitute rote learning. Moreover, Marton et al.
identified two types of memorising in which Chinese
participants engage: mechanical memorising and
memorising with understanding. Moreover, the
passive learning through memorisation in Asian
cultures can be linked to their complex writing
systems, composed of large sets of linguistic units.
These systems require the memorisation of a large
number of symbols and their mapping to natural
language units (William, 2003). Having to memorise
these symbols as part of their language, possibly
affects their learning style. On the other hand,
Western students tend to employ a reflective
approach to learning with less passive memorisation.
Considering the difference in learning styles among
Western and Asian students it is imperative that for
the successful internationalisation of the curriculum,
these issues are addressed adequately. The literature
varies in terms of evidence that supports the
differences/similarities among Asian and European
students (Holsinger, 2003; Nisbett, 2004). Some
21
Gregoriades A., Pampaka M. and Papadopoulou V. (2009).
INTERNATIONALISING THE MANAGEMENT INFORMATION SYSTEMS MODULE.
In Proceedings of the First International Conference on Computer Supported Education, pages 21-26
DOI: 10.5220/0001831200210026
Copyright
c
SciTePress

authors argue that Asian students are less creative
than Western students, while others provide evidence
of no difference (e.g. Kwang, 2004). This study aims
to identify possible differences/similarities among the
two groups with regards to the MIS module and
accordingly tailor the current teaching methods to
best address the needs of both groups.
The paper is organised as follows. Firstly an
overview of the method is provided. A description of
concept mapping as the main research instrument
supporting this study comes next. Subsequently, the
concept map assessment method used is explained
and its application is demonstrated for the evaluation
of the level of learning in the two groups. Results
from the evaluation are presented and explained and
their implications on the MIS module
internationalisation are presented.
2 THE METHOD
The methodology used to assess the level of learning
in the MIS module is composed of four steps. Firstly,
students were introduced during class sessions to the
theory of concept mapping and its practical
applications through several examples. Subsequently
a question-answer session followed to verify that the
technique was understood. Next, the students were
asked to prepare a concept map of their understanding
of MIS module. To assist them with the task, students
were asked to use questions such as: What is a MIS?
Where are they used? How they are developed? Why
are they important? The students were given 30
minutes to construct their models on paper. Along
with their maps students also specified their country
of origin and prior IT experience. The constructed
concept maps were then collected and categorised
according to students’ origin and level of prior IS/IT
experience. The exercise was conducted on the last
lecture of the module and four lectures after the
students completed a multiple choice test on all
aspects of the module. Results from the test were
used as a preliminary record of students’ performance
in the module. The study was performed with Second
Year (i.e. level 2 in British terms) students of similar
academic performance. This was achieved by
analyzing the students’ 1
st
year academic results. The
screening process was performed based on three
criteria: their 1
st
year academic performance, their
score on the multiple choice test, their origin and their
prior knowledge in IT/IS.
2.1 The Research Instrument
Concept mapping is a technique used for representing
knowledge in the form of graphs, composed of nodes
and arcs/links. Nodes represent concepts and arcs
represent the relations between these concepts.
Concepts are labelled depending on the idea/notion
that they represent. Links can be non-directional, uni-
directional or bi-directional. The direction indicates
cause-effect or specialisation -generalisation
relationships. Accordingly, concepts may be
categorical, or simply associative. The concept
mapping technique was developed by Novak (1977)
whose work was based on the theories of David
Ausubel (1968). Ausubel stressed the importance of
prior knowledge in the process of learning new
concepts and stated that "meaningful learning
involves the assimilation of new concepts and
propositions into existing cognitive structures". In
education, concept maps have been used as a way to
represent knowledge of a learner and as a method of
assessing learner progress and understanding (Novak,
1998).
Concept maps are effective tools for making the
structure of knowledge explicit. The usefulness of
concept mapping for assessment is linked to the
complexity of the information they can encapsulate.
This distinguishes them from more conventional
evaluation techniques such as multiple-choice tests
that could be described as linear. Markham et al.
(1994) suggest that these traditional uni-dimensional
assessment measures represent a failure to recognize
that knowledge is based on an understanding of the
interrelationships among concepts. Researchers have
found concept map-based evaluations to yield equally
comprehensive and accurate overviews of knowledge
as compared to well-planned structured personal
interviews (Edwards et al., 1983) and assessment
through writing (Osmundson et al., 1999). However,
concept mapping allows for more efficient data
collection than interviews, and presents an advantage
over writing-based assessments in that it is inherently
non-linear. Even though there are still a number of
important unanswered questions about the role of
concept maps in measuring knowledge, there is
substantial evidence supporting the reliability and
validity of concept maps for assessment (McClure et
al., 1999; Ruiz-Primo, 2001). Therefore, concept
maps are ideal for measuring the growth of students’
learning (Hay, 2007). Plus, they enable students to
reiterate ideas using their own words, and as a result
inaccuracies or misunderstandings can come to the
surface. When it comes to developing concept maps,
there is a range of directedness spanning from highly-
directed to low-directed. In this study low-directed
concept mapping was used and students were free to
CSEDU 2009 - International Conference on Computer Supported Education
22
decide which and how many concepts to include in
their maps. This was necessary in order to identify
differences and similarities among students groups.
2.2 Concept Map Assessment
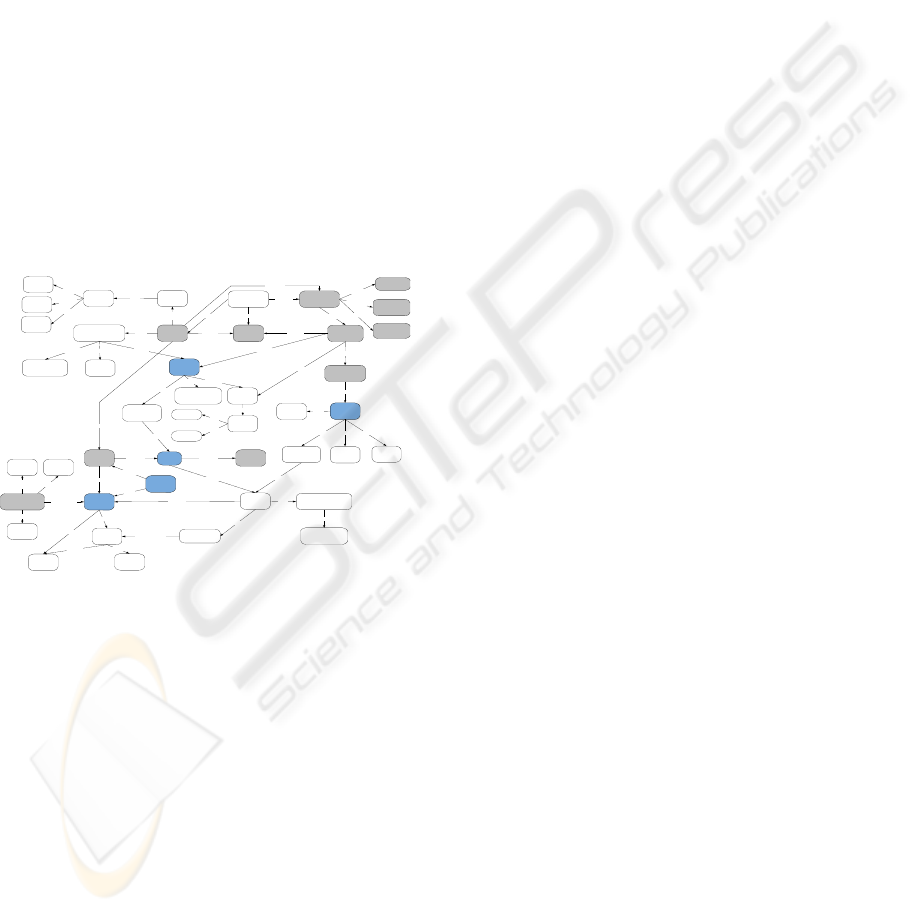
For the assessment of students’ models a master
concept map (Figure 1) was firstly developed to be
used as a point of reference based on which all
students’ concepts maps were compared to.
The master concept map models all the concepts
and their interrelationships as they were covered in
the module. Concepts in the master were categorised
into three groups depending on their level of
importance with regards to the module’s learning
outcomes. Highlighted concepts in the master, as
depicted in Figure 1, indicate strong link to the
learning outcomes of the module and, therefore, are
assigned higher weightings during the assessment.
Each of the 51 concept maps was scored based on
three scoring methods: (a) holistic, (b) relational and
(c) existential with master.
Process
MIS
Database
Organisation
Implementation
Design
Planning/
Analysis
System development
approach
Business
Processes
DFD
ERD
Software
Hardware
SQL
Fields
TablesN orm alisatio n
1NF
2NF
D ata flow s
Datastores
External
Entities
Fea sibility
study
Functional
requirements
Nonfunctional
Requirements
Business
change
Memory
Processor
Hard Disk
use Are composed of
build
using
include
include
include
Process information
with
uses
includes
includes
includes
have
havehave
Relationships
Cardinalities
Are assigned
inc lude
Entities
Attributes
is
modeled
by
perform
have
define
define
map to
become
have
Remove
redundancy
in
Must have
Should
have
has
manipulate
uses
Are translated
have
have
Primary
Key
Foreign key
Can be
Can be
Should have
need
Must
improve
Competitive
advantage
Need to
maintain
support
Business
Process
modeling
One approach is
force
requires
Is based on
Store information in
Costs-
benefits
find
Relational
Data model
Basis for
He lp g ain
Tangible
Intangible
Can
be
Can
be
Referential
Integ rity
enforce
info rm
Product
differentiation
Reduce cost
Improve
process
perfromance
Is achived
Is a chiv ed
Is a chiv ed
Figure 1: Master concept map.
Holistic concept map scoring examined each
model and assessed the students’ overall
understanding of the module. Based on this judgment,
each map was assigned a subjective score on a scale
between 1 and 10. The relational scoring method was
adapted from a technique developed by McClure et
al. (1990) and assesses student maps based on the
quality and number of propositions specified in the
model. A proposition is defined when two concepts
are connected by a labeled arrow indicating the
relationship between the two concepts. Each
proposition was assigned a correctness value between
zero and three. The highest score designates that the
proposition is specified in the exact or very similar
way to the master. Specifically, for each proposition
in each concept map, three properties were evaluated:
the relationship, the link label and the direction of the
link (if specified). The first examines the correctness
of the association among the two linked concepts.
The second examined the description of the link and
the third its direction. For the assessment of the
association, each proposition is assigned a score of 1
if the relationship between the two concepts is valid
and 0 otherwise. Subsequently, if the relationship
between the two concepts is valid, the description of
the link is given the score of 1 if the naming is correct
and 0 otherwise. Finally, if both of the previous
conditions hold and the link’s direction is correct an
additional point is given to the proposition. The
maximum score assigned for each proposition is 3.
However, since some propositions are considered as
more important than others the above scores are
adjusted by a weighting factor. The 3 levels of
importance that were used in the relational
assessment of the maps are: low, medium and high
and each is assigned a value of 1, 2 and 3
respectively. Specifically, the shaded concepts in the
master map (Figure 1) were assigned a higher level of
importance than the non shaded ones. Hence,
propositions are multiplied by their corresponding
weighting factor and subsequently summed before
reaching the final relational score of each map.
Therefore, the relational assessment of each concept
map is calculated using the following formula:
where R=concepts relationship, D= link description,
T=link direction, W=weighting.
Based on this formula, if R=0 then relational
score=0. This means that, if the two concepts that are
linked are irrelevant the proposition gets zero score.
Using the formula, the maximum relational score
for the master concept map is 282. This is calculated
by multiplying the total number of relationships (56)
that exist in the model by the corresponding
correctness and importance factor. Among the total
number of propositions, 12 are assigned a weighting
factor of 3, due to their high importance to the
module’s learning outcome and 14 the weighting
factor of 2 due to medium importance. The rest were
assigned a weighting factor of 1. Therefore, the
maximum score for the relational assessment of the
master model is calculated as follows:
Master Concept Map Relational score
= (56-12-14)*3*1 +12*3*3+14*3*2 = 282.
Finally, the existential concept map assessment
examined the existence of concepts in the map with
regards to the master model. Therefore, the inclusion
of a correct concept in the map was assigned the
score of 1 and zero otherwise. Concept names that
were not specified exactly as in the master model but
were referring to the same notion were given full
marks. For instance, the acronym SDLC that refers to
(1)
[]
1
Re ( )
n
c
lational R D T R W
=
=
++ ⋅ ⋅
∑
INTERNATIONALISING THE MANAGEMENT INFORMATION SYSTEMS MODULE
23
system development life cycle, is highly related to the
“System Development Approach” concept in the
master map and hence received full marks if specified
in either way. In addition, concepts were assigned a
weighting score between 1 to 3 depending on their
level of importance. The formula for the assessment
of the existential score is shown below:
∑
=
⋅=
n
c
WClExistentia
1
where c= a correct concept from the master map, C=
concept importance {High, Med, Low } and W its
corresponding weighting factor =[1-3]. According to
this formula, the maximum score for the existential
assessment is equal to the total number of high
importance concepts*weighting+ total number of
medium importance concepts*weighting +total
number of low importance concepts*weighting. In
the master map of Figure 1, there are 28 concepts of
low importance, 5 of medium and 7 of high
importance. This gives a total score for the existential
assessment of 59 i.e. 28*1+5*2+7*3=59.
The concept map of each student was assessed
based on the above three measures and subsequently
transformed to a score in the rage of 0-10. This was
achieved by dividing the product of each map’s
assessment*10 by the maximum score of that
assessment. A similar procedure was followed for the
relational assessment where the maximum score is
282. The average value from all three assessment
types defined the overall concept map’s score.
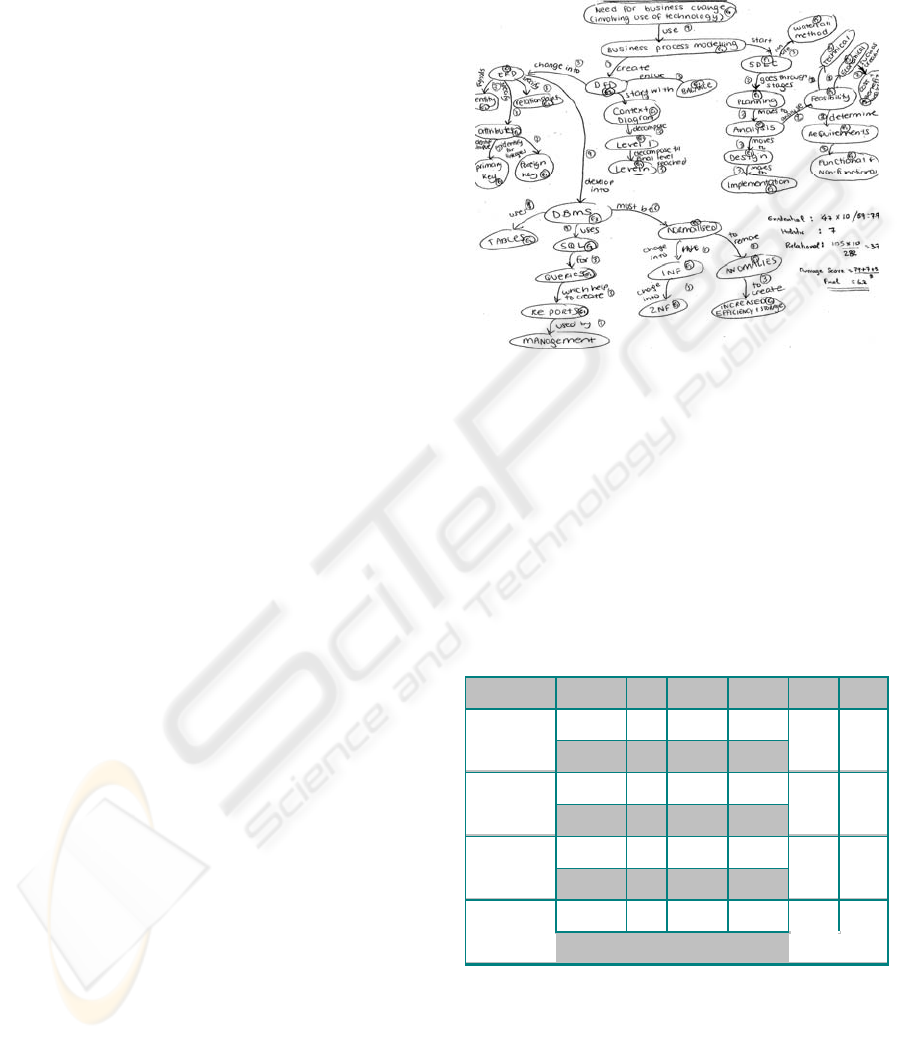
An illustration of the method in assessing a
concept maps is provided in Figure 2. The points
obtained in each scoring technique are provided in
circles on the students’ concept map. Therefore E1
corresponds to existential score that achieved the
value 1. Values next to concept’s links represent
relational scores. The overall score of each model is
assessed by accumulating the existential, relational
and holistic scores.
3 ANALYSIS AND RESULTS
Descriptive analysis of the results of the 43
participants (8 are Asian and 35 are European)
indicates that the students’ overall learning is low.
Particularly, the lowest score corresponds to the
relational aspect of the concept maps. This is
especially evident by the maximum score on this
dimension that is only 4.72 out of a possible
maximum 10. This result is attributed to the quality
and number of propositions in the students’ models.
Low performance is related to the difficulty in
identifying relevant relationships among concepts and
specifying them with correct propositions, which
is a first indication of surface learning (Biggs, 2003).
Moreover, the analysis revealed that scores are
Figure 2: A concept map of a European student.
differentiated among the two groups of students. In
particular, European students scored higher than the
Asian students in the existential, holistic and
aggregate assessments. On the other hand the Asian
students performed slightly better on the relational
dimension. However, the differences between the two
groups’ scores were not found to be statistically
significant, according to the results of independent
sample t-test (Table 1).
Table 1: Collated view of the scores achieve in all
assessment by the two student groups.
Group N Mean
Standard
Deviation
t Sig.(p)
Existential
European 35 3.8111 1.88351
0.726 0.472
Asian 8 3.3051 1.14239
Relational
European 35 1.9696 .89994
0.267 0.791
Asian 8 2.0638 .90468
Holistic
European 35 3.6571 1.66173
0.436 0.665
Asian 8 3.3750 1.59799
Overall
European 35 3.1460 1.41251
0.43 0.669
Asian 8 2.9146 1.15673
Before getting to any conclusions with the above
results a possible limitation should be acknowledged.
That is the consideration of the starting ability of the
students, which was captured in this occasion with a
multiple choice test before the concept mapping
activity. According to the results of this test, the mean
overall score of the European group was higher than
(2)
CSEDU 2009 - International Conference on Computer Supported Education
24

the mean of the Asian students, and the difference
was statistically significant [Mean
European
=16,25,
Mean
Asian
=13,7; t=3.683, p<0.01]. Therefore, for any
comparison between different ‘origin’ groups to be
meaningful we needed to ‘control’ at least this
variable. In order to do so we decided to create an
‘experimental’ condition situation for this sample of
students where each of the Asian student was
matched randomly with a European student who
gained an equal mark on the test before the
activity. A paired samples t-test was then run to
check for the difference between the scores in each
dimension. Results from this test shown no
significant statistical difference between the matched
means in each dimension for the two groups of
students. This may be due to the small sample size (in
this case N=7). However, what should be noticed is
that the pattern of the differences in the means is
consistent. Hence we could claim that in this
experiment/study European students performed better
in the overall, existential and holistic aspects of their
concept maps, and Asian students performed better at
the relational dimension.
It should also be noted that for both groups of
students, the performance in relational analysis was
much poorer compared to the other two aspects. This
result can be attributed to memorisation of the
concepts and the low understanding of their meaning
(Biggs, 2003). This could be due to the low level of
student’s practical experience with the module’s
material because of the sheer number of students that
were registered in this module (around 250).
To categorise students’ learning level we
employed the taxonomy of Bloom (1956). According
to this taxonomy, learning is categorized into six
distinct levels that span from surface to deep learning.
These levels include: (1) Knowledge of facts,
terminology, (2) Comprehension of meaning (3)
Application of previously learned information (4)
Analysis that includes the skill to make inferences (5)
Synthesis that includes creative skills (6) Evaluation
which includes the ability to critique, defend, and
reframe. An updated model of "Bloom's Taxomony",
described by Lorin et al. (2001) organises knowledge
into four levels: factual, conceptual, procedural and
metacognitive. The assessment method employed
here is highly related to this taxonomy. Specifically,
existential assessment aims at factual knowledge,
while relational assessment is linked to conceptual
knowledge. Procedural and metacognitive levels are
approximately assessed by the holistic assessment.
Therefore, depending on the scores obtained from the
assessment, students are classified in one of the four
categories. The classification rules based on which
this categorisation is performed are as follows:
Factual level of knowledge is assigned to students
with concept map score between 1 and 2.5. The
minimum value for this is 1, since the range between
0 and 1 does not provide sufficient evidence of
factual learning. Conceptual level of learning is
assigned to students with concept map score between
2.5 and 5. Similarly, the range between 5 to 7.5 and
7.5 to 10 corresponds to the remaining two categories
of learning, namely, procedural and metacognitive.
Results from this study shown that both groups of
students did not manage to achieve an adequate level
of deep learning. This is attributed to the low level of
hands-on experience in the laboratory caused by the
sheer number of students (250).
4 DISCUSSION AND
CONCLUSIONS
The main contribution of this study is the
identification of learning differences among Asian
and European students with emphasis to Chinese and
British nationalities. The research helped to identify
misconceptions between and within the two groups
and propose appropriate course of action for the
internationalization of the MIS module. The
underlying principle of our approach is concept
mapping and assessment. The literature reached a
consensus regarding the usefulness of concept
mapping for student evaluation (Hay 2007). Other
methods for identifying students’ misconceptions and
understanding exist (e.g. Winer & Vazquez-Abad,
1995), however, these, did not establish the same
validity and utility (Nakhleh 1994). Similar work by
Freeman and Urbaczewski (2001) demonstrated the
use of concept maps for assessing students’
knowledge in an Information Systems module.
However, unlike the research reported here, this study
did not examine differences among cultural groups.
One limitation of our study is that it draws from
dissimilar sample size among the two groups.
Specifically, the number of Asian students (8) was
considerably smaller than the European (35). As a
result, the conclusions that can be made have a
limited (if any) statistical significance. However, the
results identified common problems in both groups
that helped the redesigning of the MIS module and as
such contributed towards improving the level of
learning.
The main implications of our work point to the
need to increase the exposure of the students to the
theory through hands-on sessions. This became
apparent from the analysis of the results that indicated
reduced understanding of the practical aspects of the
module in both groups. As a remedy to this we
propose that MIS students engage in group case-
INTERNATIONALISING THE MANAGEMENT INFORMATION SYSTEMS MODULE
25

studies drawn from the international scene (Lynn,
1999). Hands-on sessions like these will facilitate
students to construct their understanding by
practicing the material, while group work will help
students to learn from each other. Moreover, the
groups must be composed of students with different
cultural background. Both approaches could act as a
catalyst to improve the engagement of international
students in the learning process.
Concluding, since the MIS module necessitates
the use of information modelling, the instructional
methods and consequently the MIS module design
should be based on modality learning styles to help
students with a single dominant learning style
strengthen weaker learning styles. This is a common
characteristic in multicultural classes and an issue
that needs to be addresses effectively for a successful
internationalisation of the curriculum. Moreover,
since the results indicate that the learning level of
both groups is low, teaching approaches, such as:
research-led teaching through injection of research
output in the teaching process, increased reflective
discussion through problem based learning, and
increased student motivation through applied
activities of basic research skills will lead to
improved student learning by supporting their
different learning styles.
Part of our immediate future directions includes
the investigation of possible variations in the pace of
learning among different cultural groups. This in
return, will help us refine the module delivery pace to
further improve the learning experience in
multicultural classes.
REFERENCES
Ausubel, D. P. (1968). Educational Psychology: A
Cognitive View. New York: Holt, Rinehart and
Winston, Inc.
Biggs, J. (2003). Teaching for Quality Learning at
University. Buckingham: Society for Research into
Higher Education & Open University Press.
Bloom, B.S., Engelhart, M. D., Furst, E. J., Hill, W. H., &
Krathwohl, D. R. (1956). Taxonomy of educational
objectives: Handbook I: Cognitive domain. New York:
David McKay.
Edwards, J., & K. Fraser. (1983). Concept maps as
Reflectors of conceptual understanding. Research in
Science Education, 13, 19-26.
Hay, D. (2007). Using concept maps to measure deep,
surface and non-learning outcomes. Studies in
Education, 32(1), 39-57.
Holsinger, D. (2003). Is The Quality of Education in
Vietnam Declining? (BYU)
Kwang, N. (2004). Liberating the Creative Spirit in Asian
Students. Prentice Hall.
Freeman L. & Urbaczewski A. (2001), Using Concept
Maps to Assess Students' Understanding of Information
Systems. Journal of Information Systems Education,
12(1), 3-9.
Lorin, A., & Krathwohl, D. (2001). A Taxonomy for
Learning, Teaching, and Assessing. New York:
Longman.
Lynn, L. (1999). Teaching and Learning with Cases: A
Guidebook. New York: Chatham House Publishers.
Markham, K. M. & Jones, M. G. (1994). The concept map
as a research and evaluation tool: further evidence of
validity. Journal of Research on Science Teaching, 31,
91-101.
Marton, F., Dall’Alba, G., & Tse, L. K. (1993) The Paradox
of the Chinese Learner, Occasional Paper 93.1,
Educational Research and Development Unit, Royal
Melbourne Institute of Technology, Victoria.
McClure, J.R., & Bell, P.E. (1990). Effects of an
environmental education related STS approach
instruction on cognitive structures of pre-service
science teachers. University Park, PA:Pennsylvania
State University. (ERIC Document Reproduction
Services No. ED 341 582).
McClure, J. R., Sonak, B., & Suen, H. K. (1999). Concept
map assessment of classroom learning: Reliability,
validity, and logistical practicality. Journal of Research
in Science Teaching, 36(4), 475-492.
Nakhleh, M. B. (1994). Chemical education research in the
laboratory environment: how can research uncover
what students are learning? Journal of Chemical
Education, 71, 201-205.
Nisbett, R. (2004), The Geography of Thought: How Asians
and Westerners Think Differently...and Why.. Free
Press.
Novak, J. D. (1977). A theory of education. Ithaca, NY:
Cornell University Press
Novak, J.D. (1998). Learning, Creating, and Using
Knowledge: Concept Maps as Facilitative Tools in Schools
and Corporations. Lawrence Erlbaum Associates.
Osmundson, E., Chung, G.K.W.K., Herl, H.E., & Klein,
D.C.D. (1999). Knowledge mapping in the classroom:
A tool for examining the development of students'
conceptual understandings (Centre for the Study of
Evaluation Technical Report 507). Los Angeles:
UCLA, Centre for Research on Evaluation, Standards,
and Student Testing.
Ruiz-Primo, M. A., Schultz, S. E., Li, M., & Shavelson, R.
J. (2001). Comparison of the reliability and validity of
scores from two concept-mapping techniques. Journal
of Research in Science Teaching, 38(2), 260-278.
Teekens, H. (2002), Teaching and Learning in the
International Classroom, Nuffic, The Hague
UUK. (2005). Select committee evidence, Treasury
Committee, Impact of China on the World & UK
Economy.
Winer, L. R., & Vazquez-Abad, J. (1995). The present and
the future of ID practice. Performance Improvement
Quarterly, 8(3), 55-67.
William C. H. (2003). The writing on the wall: How Asian
orthography curbs creativity. Encounters with Asia.
Philadelphia, PA: University of Pennsylvania Press.
CSEDU 2009 - International Conference on Computer Supported Education
26
