
TIMELINESS FOR DYNAMIC SOURCE SELECTION IN
SITUATED PUBLIC DISPLAYS
F. Reinaldo Ribeiro
Departamento de Informática, Escola Superior de Tecnologia, Castelo Branco, Portugal
Rui José
Departamento de Sistemas de Informação, Universidade do Minho, Guimarães, Portugal
Keywords: Dynamic Sources, Information Integration, Timeliness, Public Displays, Situated Displays, Social
Information Systems, Web Information Filtering and Retrieval, Web 2.0.
Abstract: Dynamic sources, which make regularly updated data available for use by other applications, are
increasingly a key enabling feature of the web. They are extensively used in all sorts of social media
applications where they are re-combined in multiple ways to generate new aggregate services. Public
situated displays are an emergent area where dynamic sources can also play a key role in providing situated
and frequently updated content. However, the specificities of public displays raise the need for automated
selection of the most relevant sources to present. This study addresses relevance from the perspective of
timeliness. We propose a timeliness model that supports the most common types of dynamic source. To
validate that model, we set an experiment with a public display exhibiting content from dynamic sources
and receiving from users feedback on its timeliness. The results from this experiment suggest a reasonable
match between our model and the users’ perspectives on timeliness. The results also show that the model is
able to make comparative calculations of timeliness for different types of dynamic source. These results
enable us to conclude that timeliness functions may help to significantly increase the relevance of content
automatically selected from dynamic sources.
1 INTRODUCTION
A key enabling feature of the Web in the social
software era is the integration of multiple data
sources into combined services that exhibit an
aggregate view that is constantly being updated from
the original sources. This model is extensively used
in social media applications and is also at the core of
the mashup concept, in which information from
various sources is recombined to form new
applications. In this paper we will use the term
Dynamic Source to refer to these information
sources that make regularly updated data available
for use by other applications and look in particular at
how they can be leveraged for the generation of
content for digital situated displays.
Public situated displays are an emergent area
where dynamic sources can play a key role in
providing situated and frequently updated content.
However, the common scenario for interaction with
public displays is very different from the traditional
web scenarios and raises specific challenges that
may limit the applicability of dynamic sources as
content generators. The problem with dynamic
sources is that, precisely because they are dynamic,
the relevance of the respective information is likely
to face considerable oscillations. Any particular
source may, at some point, be producing content that
is timely while at some other point may have
nothing to show or its content may be strongly
deprecated. For example, a feed from a blog with
many recent messages on some hot topic may be
very relevant when the new messages are being
posted and then quickly become outdated when the
posting activity stops.
In a traditional web scenario these variations in
the relevance of the sources are not a major concern.
The navigation experience gives people full control
over which information to access and many cues on
which information to select. Multiple data items
from various sources are typically presented in the
form of short summaries with links for further
667
Reinaldo Ribeiro F. and JosÃl’ R.
TIMELINESS FOR DYNAMIC SOURCE SELECTION IN SITUATED PUBLIC DISPLAYS.
DOI: 10.5220/0001841906600665
In Proceedings of the Fifth International Conference on Web Information Systems and Technologies (WEBIST 2009), page
ISBN: 978-989-8111-81-4
Copyright
c
2009 by SCITEPRESS – Science and Technology Publications, Lda. All rights reserved

details, and people can easily evaluate which ones
may be of interest and navigate accordingly. On the
contrary, in a public display, the interaction model is
essentially a push model, in which the system makes
most of the decisions on what is going to be
presented next. People are very limited in their
ability to influence the display decisions, not only
for the technical considerations resulting from the
lack of a mouse and keyboard, but essentially due to
the fact that the display is public and shared.
Furthermore, given that people will not normally
have the possibility to request for further details, all
the content is presented. As a result, there is a high
probability that at any moment the display will be
showing deprecated or otherwise irrelevant
information.
In this work, we explore an alternative model
that basically consists in maintaining a potentially
large pool of possible sources and selecting for
presentation only those that are currently more
relevant. In general, the relevance of a particular
resource is an indication of the pertinence of that
resource to the current needs of the users, but in this
work we are only concerned with the time
dimension, i.e. evaluating how timely the
information is.
This notion of timeliness is of an obvious
importance in setting the relevance for any type of
source, but different sources will handle the effect of
time differently. For most sources, the relevance
measure should guarantee that the information has
not lost its value since publication, but in some
cases, a higher relevance may be associated with a
particular point in time, e.g. the day of an event, and
not necessarily decay as time goes by.
The objective of this work is to develop a set of
methods for optimizing the timeliness of content
from dynamic sources selected for presentation at
public displays. This broad research goal embraces
the following set of research objectives: to
understand the key criteria for evaluating the
timeliness of content across several types of
dynamic source; to propose and validate a model for
timeliness; to uncover any elements that may affect
people’s perception of timeliness.
To pursue these goals, we started by analyzing
time-related meta-data from a large number of real
sources. Based on that analysis, we propose two
timeliness formulas for two common types of
source, those based on a publication date and those
based on a planned event date. To support the
evaluation of that model we created a public display
system where date items were scheduled using those
formulas and asked people to classify the timeliness
of what was being presented. This was
complemented with another experiment designed to
investigate the fairness of the model when
comparing the timeliness of sources with different
time criteria. Results show a clear relation between
timeliness as determined from our formulas and
timeliness as perceived by people.
2 RELATED WORK
Research on situated public displays has received
considerable attention recently, with many projects
addressing the issues of how to enable information
access and share, and enhance collaboration within
organizations or communal spaces (Russell and Sue
2002). The BlueScreen project (Payne, David et al.
2006) selects and displays adverts in response to
users detected in the audience. It utilizes Bluetooth-
enable devices as proxies for identifying users and
utilizes history information of past users’ exposure
to certain sets of adverts. Advertisements are
preferentially shown to those users that have not
seen them yet. Muller (Muller, Kruger et al. 2007)
describes a mechanism to adapt advertisements on
digital signage to the interests of the audience. Here,
each advertisement has a set of keywords and the
system keeps a history of all advertisements a user
was interested in. Groupcast (McCarthy, Costa et al.
2001) is a display that respond to the local audience
within a corporate environment to display media
contents. It explores user identification and their
profiles to identify common areas of interest.
This work also builds on previous work in
recommendation systems and retrieval models for
feed search (Bihun, Goldman et al. 2007; Seo and
Croft 2007; Arguello, Elsas et al. 2008). A key
distinguishing characteristic is the different set of
assumptions of the specific problem domain.
Previous work has address the issue mostly as an
information retrieval problem, where the starting
point is some type of search phrase, user profile, or
interaction history that enables relevance of new
items to be determined by the similarity to the search
query. Our goal is not to achieve a match between
potential sources and any representation of users’
interests, simply because we do not have any such
representation. In this work, we focus on the
evaluation of relevance in a way that is inherent to
the source and independent of the presentation
context. More specifically, we define our problem as
a problem of selecting from a fixed set of sources
the items that are currently more timely to present.
WEBIST 2009 - 5th International Conference on Web Information Systems and Technologies
668

3 DYNAMIC SOURCES AND
TIME
A dynamic source is specified by the indication of
the source that produces it and by a collection of
query parameters, such as search keys or constraints
that determine the dataset to be produced. This
specification, frequently in the form of a URL,
represents a formal statement of a particular
information need. As a result of an access to the
resource, a dataset is produced that is normally
composed by multiple data items. Depending on the
type of source, these data items may be text, images,
videos or any other media type, and they may have
their own individual metadata. The resource is
expected to be regularly updated and regularly
consumed, using methods such as dedicated APIs or
XML feeds. As a result, the set of data items
returned by the source may vary in subsequent
requests for the same resource, and each individual
item may itself be updated.
A key part of this work is a model for the
timeliness of the data items obtained from dynamic
sources. A high level goal for that model is to
achieve a reasonable match with common sense
notions of timeliness. Additionally, such model
should also address the following requirements:
R1: Leverage on the time-related metadata
that is effectively available in the data items
R2: Address the time-related specificities of
the various types of data items, while enabling
their comparison in terms of timeliness.
R3: Be optimized for automated scheduling
in which the timeliest content is cyclically
selected from a pool with potential sources.
3.1 Time Related Meta-data
To identify the possible criteria for calculating
timeliness, and particularly to understand the
implication of the requirement R1, we started this
work with an analysis of time-related meta-data
across a varied and representative sample of
dynamic sources, including news feeds, blogs, event
announcements and queries to social software web
sites. The objective was to study the key
characteristics of a representative set of dynamic
sources in order to identify the main criteria for
calculating timeliness taking into account the data
and metadata produced by the various types of
resource. Through a period of 3 weeks, we have
collected time-related parameters from 117 sources
of various types. We have analyzed the time-related
data that was actually available for those types and
its update frequency. Based on that analysis, we
identified three main groups of sources: information
items with publication date, event-related items with
event date, and content shared on social software
web sites. The first two are clearly distinct in the
semantics of their time-related meta-data, as we will
describe next. The social software web sites were
harder to aggregate because each site has its own
time semantics, which greatly undermines any
attempt of using a common model. We thus chose
not to address the sources from that particular group
and focus our study only on the first two groups.
3.2 A Timeliness Model
The next phase in our work was the definition of a
timeliness model for each of the two groups
identified. We chose to study the timeliness of
individual items rather than the timeliness of
dynamic sources, because the data items on any
particular source will typically exhibit very distinct
time-related parameters that would distort the
selection process.
In the case of information items with publication
date, timeliness is essentially determined by the time
elapsed since the time of publication. However the
decay factor associated may vary considerably
across different types of sources, which leads to
introduce a decay parameter that defines the decay
of the information with time (Equation 1).
i
i
K
PDt
i
eT
−
−
=
(1)
Where:
T
i
: the timeliness of the item i;
PD
i:
the publish date of item i;
t: the actual time;
K
i
: decay level of the source for item i
In the case of event-related items with event
date, timeliness is essentially tied to the date of the
event, steadily growing as the event approaches and
then dropping abruptly as the event comes to an end
(Equation 2).
()
tSTh
ee
T
i
lh
thl
lh
thl
i
ii
ii
ii
ii
−×
⎟
⎟
⎟
⎠
⎞
⎜
⎜
⎜
⎝
⎛
+
+
+
=
−
−+
−
−+
22
22
11
11
22
1
5,0
1
5,0
(2)
Where:
l
1
, h
1
, l
2
and h
2
represent change times for the
timeliness function (defined as amount of time
since this point to event start time);
ST
i
: the event start time;
t ;the actual time;
h(t) :Heaviside step function.
TIMELINESS FOR DYNAMIC SOURCE SELECTION IN SITUATED PUBLIC DISPLAYS
669
4 EXPERIMENT
To validate the previous models and also to uncover
any meaningful user perspectives on timeliness, we
set an experiment with a public display showing
content from dynamic sources and receiving
feedback from users on the timeliness of the content.
For this trial, we developed a display system that
used different scheduling algorithms to select the
next item to display and we then asked users what
they thought about the timeliness of what was being
presented on the display. This was complemented
with an evaluation of the fairness of the algorithms
when choosing between multiple source categories.
4.1 Timely Display System
We have developed a timely display system that
collects data from a pool of predefined dynamic
sources, selects the timeliest items and displays the
respective content on a public display. As
represented in Figure 1, the key input for the system
is the set of dynamic sources considered for our
study. Those sources are organized in categories,
with the items in the same category sharing the same
timeliness formula and respective parameters.
Figure 1: Timely display system.
Two different scheduling queues were created
for each category: a timely queue and a random
queue. The timely queue contains the 15 items, from
all the items in all the sources in the respective
category that ranked higher according to the applied
timeliness formula (see table 1). The random queue
also contains 15 items, but randomly selected from
the same category. The timeliness value is regularly
updated to reflect not only the passage of time, but
also the new items being produced by the sources.
The set of queues from the various categories is
the input for the scheduler, which must select the
next item that is effectively going to be presented.
Each time the scheduler needs to select a new item,
it picks an item from one of the queues. In this
experiment with users, this selection was made at
random, in order to help distribute the number of
schedules between all categories including the
random ones. The selection within each queue
follows a simple round-robin algorithm. Information
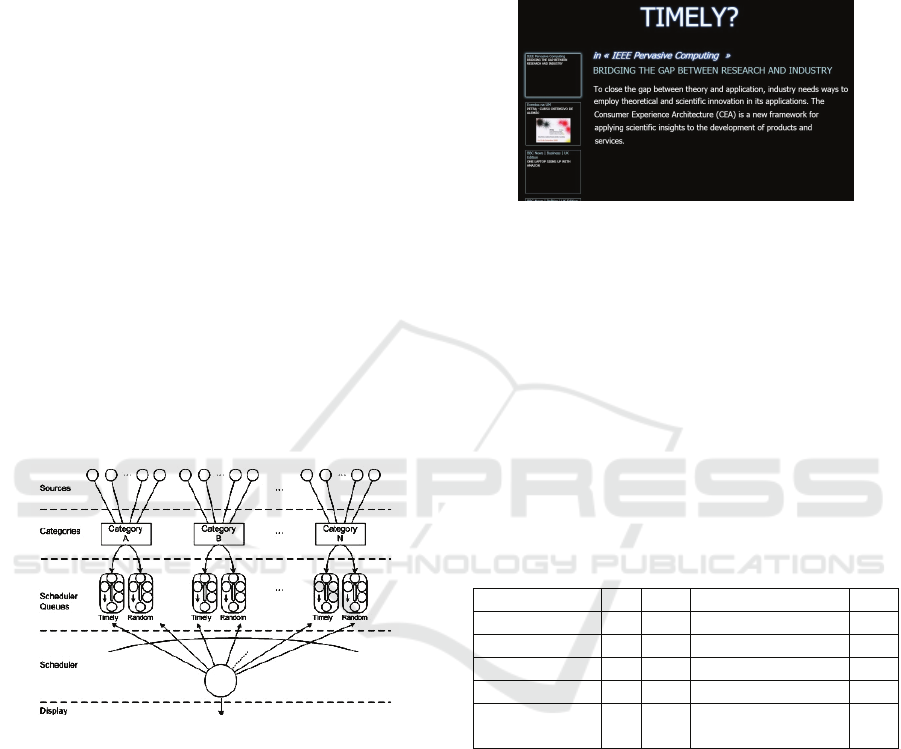
was displayed as represented in Figure 2.
Figure 2: Situated display screenshot.
At the left we have the next items to be
presented. The main display area displays the
information of the currently selected item, but does
not include any reference to time related meta-data.
Every 25 seconds the display information is updated
with a new item being selected for presentation.
For the purpose of this study, we selected a total
of 117 dynamic sources of general interest for our
target community. Those sources were grouped
according to the nature of their source into the five
categories described in Table 1.
Table 1: Categories and parameters (ns:number of sources;
tf: timeliness function; p: parameters; ti: total items).
Category ns tf p ti
News 38 Eq. 1 K=24 ≅900
Magazines W. 46 Eq. 1 K=48 ≅900
Blogs 22 Eq. 1 K=48 ≅400
Announcements 10 Eq. 1 K=48 ≅250
Events 1 Eq. 2 l
1
=120; h
1
=96;
l
2
=36; h
2
=24;
≅10
News and headlines are frequently updated
sources (e.g., from TVs, newspapers). Blogs
includes content from blogs (usually opinions and/or
comments). Magazines and websites represent news
from magazines, websites and similar sources on
specific type of contents. Announcements category
includes contents like classified announcements and
advertisements. Finally, events represents sources
for which timeliness is strictly connected to the
event start date. The total number of items in each
category (column ti) is just an indicative value, as
this number is always changing due to the dynamic
nature of the content sources. Parameters were
defined according the nature of the content and our
WEBIST 2009 - 5th International Conference on Web Information Systems and Technologies
670
own perception of how their timeliness could
evolve.
4.2 The Display Setting
The experiment took place at a reception hall. The
setting is composed by two different displays: the
Information Display and the Feedback Display. The
Information Display shows the items that were
selected for presentation. The Feedback display is a
small touch screen display that is used to collect
users’ opinions about the timeliness of what is being
presented on the Information display. The display
poses to the users the question “What is your
opinion about the timeliness of the content that is
presented on the display?” and users are able to
select between four possible answers (2 if Very
Timely; 1 if Timely; 0 if Not Timely and -1 if No
Opinion). Each user response is associated to the
content that is currently on the situated display and
is stored in a database. To prevent the same user
from voting multiple consecutive times a delay of
five seconds was introduced between feedbacks.
Every time a new item is scheduled, the system
registers the schedule start time; schedule end time;
scheduler queue; item source; item title; item link;
item publication date and event start date (if content
is an event). Every time a user gives feedback, the
system registers the user opinion on content
timeliness and associates it with the displayed item.
5 RESULTS AND DISCUSSION
During the 3-weeks of our experiment the display
made 33823 schedule decisions corresponding to
8577 distinct items belonging to 102 sources (no
items were selected from 15 sources). For the same
period we collected a total of 669 timeliness
classifications. To improve the quality of the data we
eliminated classifications made very close to the
moment of transition between items (for which there
was some ambiguity on the association) and at night
(for which there were very few people). In the end,
our analysis was based on 320 valid classifications
referring to 239 distinct items from 67 distinct
sources.
5.1 Timeliness Perspectives
The first goal of our data analysis was to identify
how the timeliness of the items selected using our
timeliness model had been perceived differently,
when compared with the perception of timeliness in
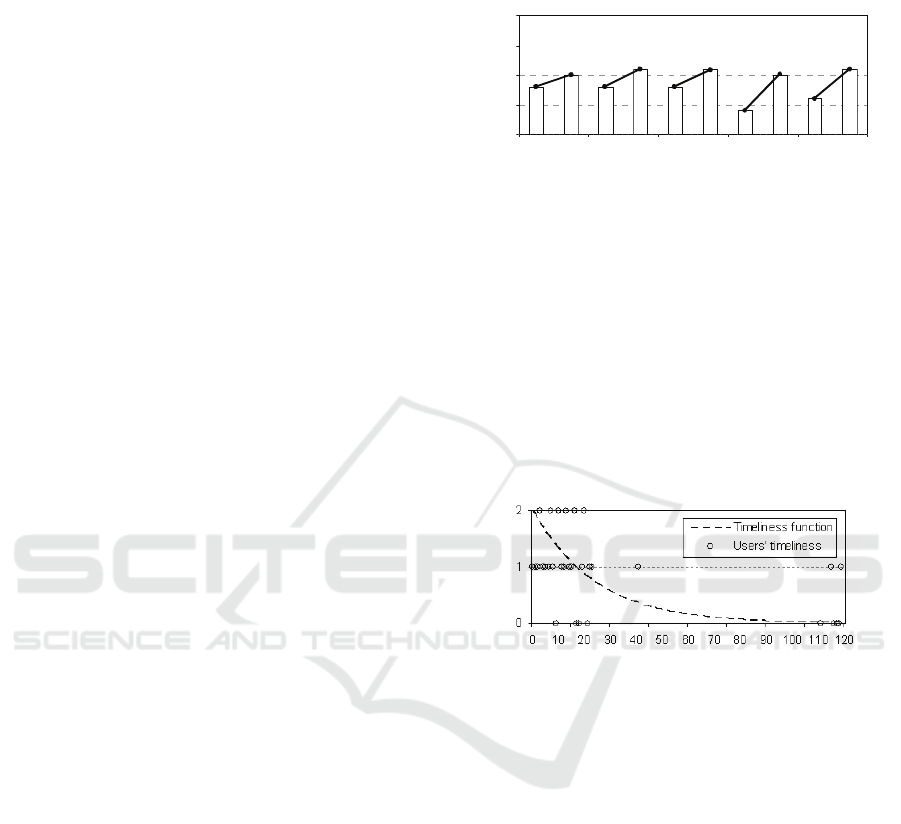
the randomly selected items. Figure 3 shows the
“mean” value of user classifications for timely and
random queue for each category.
0,0
0,5
1,0
1,5
2,0
Random Blogs
Timeliness Blogs
Random
Magazines/Websites
Timeliness
Magazines/Websites
Random
Announcements
Timeliness
Announcements
Random Events
Timeliness Events
Random News
Timeliness News
Figure 3: Comparative statistical analysis.
When comparing the two queues in each
category a considerable improvement can be
observed for all categories. The least successful
category is blogs with a 25% improvement.
The graphs in Figure 4 display the timeliness
function for new along with the respective timeliness
classifications submitted by people. The horizontal
axis represents time in hours since publication or
until the event date.
Figure 4: News:Timeliness functions vs users’ evaluation.
The existence of randomly selected items has
allowed us to obtain classifications for items that
were ranking low in timeliness and despite a relative
scattering on users’ evaluations, there seems to be a
clear match between our formula and the
classifications made by people.
5.2 Fairness between Categories
A complimentary experiment was made to assess
the fairness of the timely algorithm when
competitively selecting items from multiple
categories. We used the same sources and categories
as the basic input, but this time, for each category,
we considered a single queue based on our timely
algorithm. The selection of the data items to be
scheduled was made by selecting from all those
queues the 30 most timely items, regardless of their
category. This forced the data items of all the
categories to compete among each other for
scheduler selection.
TIMELINESS FOR DYNAMIC SOURCE SELECTION IN SITUATED PUBLIC DISPLAYS
671
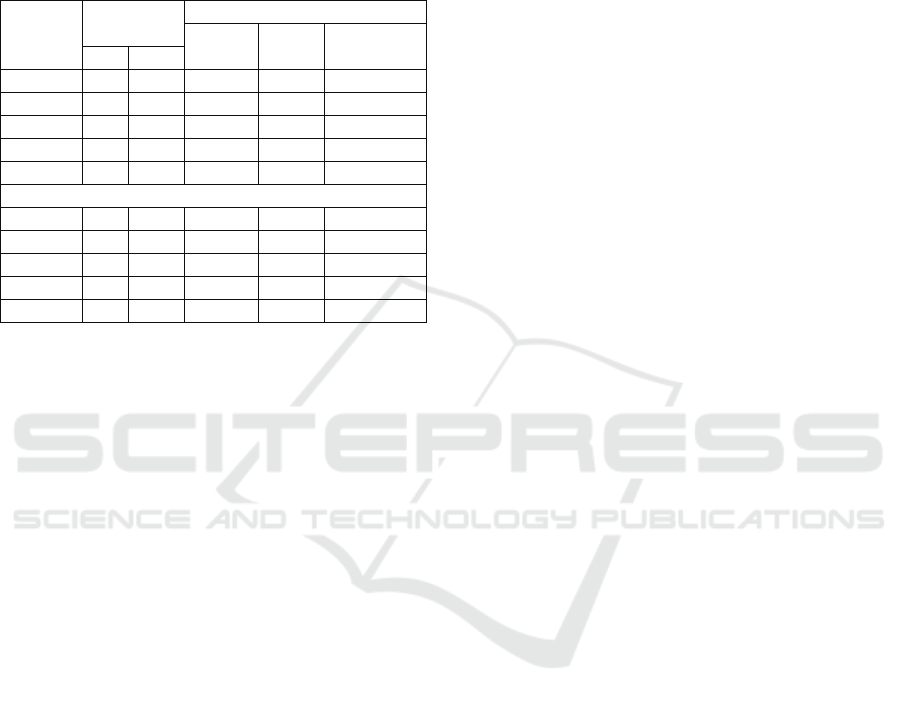
For a period of 6 days, we registered the
schedules made and the number of items available in
each category. The results are presented in Table 2
and are divided into two parts. The first corresponds
to the period between 8 am and 8 pm, and the
second corresponds to the entire day period.
Table 2: Results for fairness between categories.
8am-8pm
Available
items (1)
Display (2)
Total
schedules
% of air
time
% distinct
items
start ∆ new
News 703 3166 4541 53,8% 21,7%
Blogs 290 112 1099 13,0% 22,1%
Announc. 98 13 8 0,1% 1,8%
Mag & W 766 427 2659 31,5% 21,7%
Events 10 7 132 1,6% 17,7%
All Day
News 703 3428 9705 48,4% 26,8%
Blogs 290 112 3221 16,1% 23,1%
Announc. 98 13 40 0,2% 2,7%
Mag & W 766 451 6752 33,7% 29,3%
Events 10 7 320 1,6% 35,3%
(1) Number of items at the start of the experiment and
number of new items published during the experiment.
(2) Total number of schedules, % of the total number of
schedules and % of items that were scheduled.
When comparing the fairness between
categories, we can observe that some categories are
able to gain many more schedules that others. This is
in part due to their natural dynamic, but still it is an
indicator that some of the parameters in the formulas
may have to be fine tuned to increase fairness.
Another interesting effect is the existence of
differences between the daily period and all day
period. This were due to the nature of some sources
(e.g. usually blogs are updated out of the day period)
and also because of their origin (many of the
magazines were from sources with different time
zones from our one). The relatively high number of
schedules on events is justified because there were
four events occurring during this experiment. We
can also observe that only part of the items were
ever displayed, e.g. 21,7% for news during the day
period. This was a natural consequence of the fact
that we had a much higher number of potential data
items than time to present them all.
6 CONCLUSIONS
This study has investigated how the notion of
timeliness can be added to dynamic sources and
contributes to improve the relevance of data items
selected for presentation in public displays. We have
proposed a formula for modeling the timeliness of
various types of dynamic sources that builds on time
related meta-data effectively available on common
sources and is simple to calculate.
The results of the study suggest a reasonable
match between our concept of timeliness and the
concept as perceived by users. Therefore the
introduction of timeliness as a criterion for item
selection is expected to have an impact on the
perceived relevance of the data presented in public
displays. Evaluation of fairness has shown that there
are multiple factors that must be considered to
ensure a balanced selection among multiple
categories or even among the various sources in the
same category, including different time zones and
different dynamics in the generation of new items. A
change in the model suggested by those results is the
introduction in the formula of an initial period with
no decay to attenuate the effect of different time
zones and support a better match with daily rhythms.
A more in-depth study of those effects and how to
handle them is part of future work in this topic.
ACKNOWLEDGEMENTS
The first author was supported by a FCT scholarship
(SFRH/BD/31292/2006).
REFERENCES
Arguello, J., J. L. Elsas, et al., 2008. Document
Representation and Query Expansion Models for Blog
Recommendation. Int. Conf. on Weblogs and Social
Media, Seatle.
Bihun, A., J. Goldman, et al., 2007. Ranking blog
documents. US Patent & Trademark Office.
McCarthy, J. F., T. J. Costa, et al., 2001. UniCast, OutCast
& GroupCast: Three Steps toward Ubiquitous
Peripheral Displays. Int. Conf. on Ubiquitous
Computing, Springer-Verlag.
Muller, J., A. Kruger, et al., 2007. Maximizing the Utility
of Situated Public Displays. Adjunct Proceedings of
User Modeling, Corfu.
Payne, T., E. David, et al., 2006. Auction Mechanisms for
Efficient Advertisement Selection on Public Displays.
European Conference on Artificial Intelligence.
Russell, D. M. and A. Sue, 2002. Using Large Public
Interactive Displays for Collaboration. W. on
Collaboration with Interactive Walls and Tables.
Seo, J. and W. B. Croft, 2007. UMass at TREC 2007 Blog
Distillation Task. Text Retrieval Conference.
WEBIST 2009 - 5th International Conference on Web Information Systems and Technologies
672
