
A WEB-BASED TOOL FOR CREATING GEOREFERENCED
BOUNDARY MAPS
Omar Valenzuela, Néstor J. Rodríguez and José A. Borges
Electrical And Computer Engineering Department, University of Puerto Rico at Mayaguez, Mayaguez, Puerto Rico
Keywords: Web GIS, Boundary maps, Web usability.
Abstract: This work presents a web-based application with the capability of creating, manipulating and editing
georeferenced boundary maps (polygons) of geographical areas using georeferenced images. The
application is platform-independent. It can run on any computer with a browser and an Internet connection.
The application provides the capability of locally storing boundary maps attaching to them spatial
information from the images that facilitates image searching. Boundary maps can be imported from other
sources and they can also be exported to make them available for other GIS applications. A usability test
conducted with the application demonstrated that it is easy to learn and use. Participants were able to
complete 96% of the tasks with a fifteen minutes tutorial. In addition they found all the interaction actions
tested to be easy to use.
1 INTRODUCTION
Geographical Information Systems (GIS)
applications are very powerful information systems.
Most of them are desktop software from commercial
vendors, which are usually very expensive. The fact
that these are stand alone and isolated information
systems limits their usefulness to the very few that
have physical access to them.
Advances in networking technologies and
Internet protocols and applications have made
possible the development of GIS applications that
can be accessible from all over the world at a very
low cost (Athan, 2007). These technological
advances facilitate the development of methods and
environments to visualize, manipulate, and analyze
geospatial data through the Internet with direct
manipulation user interfaces (Sayar, 2005).
The core technologies of an application or its
functionality do not guarantee the success of an
application from the user’s point of view. Usability
plays a major role on the acceptance of an
application. A very good example of this is
presented in (Traynor, 1995). In this research a
group of social scientists were given a tutorial by a
GIS expert on a GIS application used by residents in
inner-city neighborhoods. Despite the tutorial, the
the software resulted very difficult to use.
The tool described in the next section is a GIS
application that was developed using Web
development technologies such as AJAX
(Asynchronous JavaScript and XML) (Ahmet, 2006)
and PHP5, and share wear database technologies
such as MySQL. The tool allows users to create,
edit, manipulate and stores boundary maps
(polygons) through the Internet. The tool manages
high-resolution images that are used as references
without using many system resources and
unnecessary bandwidth. It was developed as a
platform independent tool so that it can run in any
computer with any operating system in any place of
the world.
2 A TOOL FOR CREATING
BOUNDARY MAPS
This section describes the operation of a web-based
application capable of creating boundary maps using
spatial data contained in aerial and/or satellite
images as reference. Boundary maps are useful to
delimit geographical areas of interest. These maps
could be superimposed on satellite images of
different types of atmospheric or terrestrial attributes
to study the effect of them on the delimited area.
439
Valenzuela O., Rodrà guez N. and Borges J.
A WEB-BASED TOOL FOR CREATING GEOREFERENCED BOUNDARY MAPS.
DOI: 10.5220/0001843704390443
In Proceedings of the Fifth International Conference on Web Information Systems and Technologies (WEBIST 2009), page
ISBN: 978-989-8111-81-4
Copyright
c
2009 by SCITEPRESS – Science and Technology Publications, Lda. All rights reserved
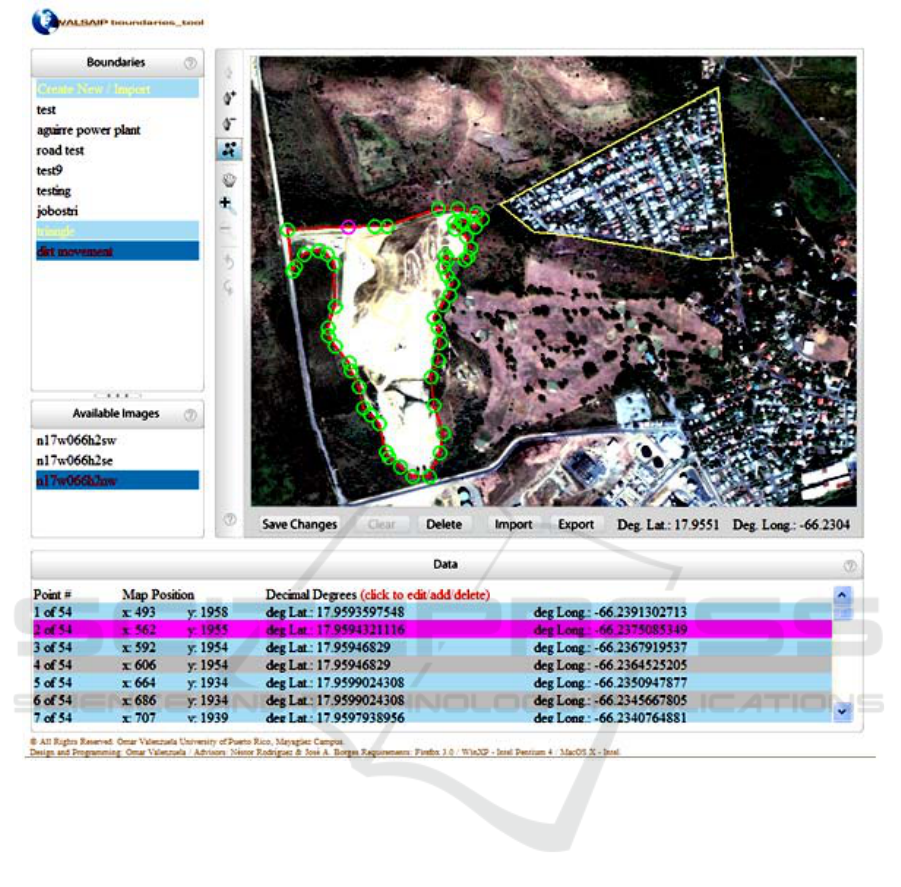
Figure 1: User interface of boundary creation tool.
Since boundary maps are georeferenced they
automatically align with the corresponding
geographical area on the reference image.
The user interface of the tool is shown in figure
1. The main working area is the large image display
window at the top left. The image displayed in this
area serves as reference for the creation of boundary
maps. Boundary maps are displayed as polygons of
lines on top of the image.
Lists of boundary maps and reference images are
displayed at the left side of the interface. Users can
select one image from the image list to be displayed
on the image display window. However, more than
one boundary maps from the boundaries list can be
displayed on top of the reference image as it is
shown in figure 1.
A vertical toolbox at the left of the image display
window provides options for creating, editing and
manipulating boundary maps. The top icon of the
toolbox serves to create a new boundary map. The
following three icons serve to add, remove and move
points of a boundary respectively. When one of
these three editing options is selected the active
boundary is displayed with all its points highlighted
with small circles like the boundary shown at the left
on the image display window of figure 1. The user
can edit any point by pointing and clicking on them.
The icon with a hand shape in the vertical toolbox
serves to drag the background image along with the
boundary. The icons with the plus and minus
symbols serve to zoom in and zoom out the image
respectively. The arrow icons serve to undo and redo
interaction actions. All the actions generated with
the toolbox are constantly georeferenced in real-time
using the images’ World File data.
Below the image display window are a number
of buttons that allow saving, clearing, deleting,
importing and exporting boundary maps. The first
WEBIST 2009 - 5th International Conference on Web Information Systems and Technologies
440

button from left-to-right controls the saving of
boundary maps. This button changes according to
boundary status. If the user is creating a new
boundary or is importing a new boundary to the
database, this button takes the action of saving the
boundary and displays the keyword “Save
Boundary”. If the user is editing an existing
boundary, the button takes the action of saving the
changes made to the boundary and displays the
keyword “Save Changes”.
The second button clears all the changes made to
the active boundary on the image display area. The
third button is use to delete the active boundary,
only if it is actually stored on the database. The
fourth button, the Import button, brings a boundary
map into the image display window. If it is not
already in the database the user has the option to
save it. The fifth button (Export) has the function to
convert the active boundary into a KML file and
provides the user the option to save it locally.
Following the Export button are two fields (Deg. Lat
and Deg. Long) that display the coordinates of the
position of the cursor in decimal degrees.
At the bottom of the user interface there is a
window that displays data about each point of the
active boundary. Each point is identified with a
number. These are organized in ascending order,
following the connection sequence. The relative X-Y
pixel position on the boundary display window as
well as the georeferenced position in decimal
degrees (Latitude-Longitude) is displayed for each
point. By clicking on a point entry the point is
selected. The user can edit the coordinates of the
selected point, delete the point or add a new point.
This feature allows for the development of very
precise georeferenced boundary maps.
3 IMPLEMENTATION DETAILS
The main tool used in the development of the
boundary maps tool was AJAX. This technology
made possible to merge the dynamic content
obtained from dynamic HTML and CSS, with the
coding support of PHP 5 and manage the user
interface’s dynamic information display with the use
of JavaScript. SAJAX (Simple AJAX Toolkit) was
used as the AJAX tool to handle the
communications between the JavaScript and PHP 5.
JSON (JavaScript Object Notation) was used to
handle the variable data to/from JavaScript that is
sent over to PHP 5 to be displayed in the user
interface. These technologies allowed the creation of
dynamic content on a web browser in a similar way
as it can be accomplished in a desktop application
(Paulson, 2005).
The boundary maps tool application was
developed for Mozilla Firefox version 3 because of
its stability, standard compliance, and performance
of JavaScript at the time of the development.
Programming for only one browser makes the
process of developing a web application a lot faster.
However, the application performs correctly with
Safari’s, Apple’s Internet browser.
Boundary maps are stored on a local database
and made accessible through a local website to avoid
the use of proprietary APIs that could limit future
development of the tool. The tool’s database server
was implemented with Apache, MySQL and PHP 5.
The latter was used to manage queries, image files,
and store information inside the database. Since the
information generated from the user’s work needed
to be stored in an open format available to anyone,
KML was used as the storage format. The
availability of these database server development
tools on the Internet facilitated the implementation
of the application in a very inexpensive way.
4 USABILITY STUDY
4.1 Methodology
A usability study (Nielsen, 1993) was performed to
determine the ease or difficulty of use of the
boundaries tool application by potential real users as
well as their satisfaction with the application. The
study was performed using a local web server to
prevent any network related variability in the results
of the study. The computer used to run the test was a
PC with an Intel Core 2 Duo @ 2.16 GHz processor,
2 GB RAM and 7200 RPM HardDisk. The software
used to run the application was Apache 2.2, PHP
5.2.6, MySQL Server 5.0. The browser used for the
test was FireFox version 3.0.1.
The users selected for the usability test were ten
civil engineering and surveying students with
experience in the creation of polygons and/or
boundaries with GIS tools. Prior to the test they
were given a short tutorial on how to use the
application. After the tutorial the users were asked to
perform 20 tasks using the boundary tool. The tasks
involved handling, creating, editing, saving,
importing, exporting, and deleting boundary maps.
A WEB-BASED TOOL FOR CREATING GEOREFERENCED BOUNDARY MAPS
441
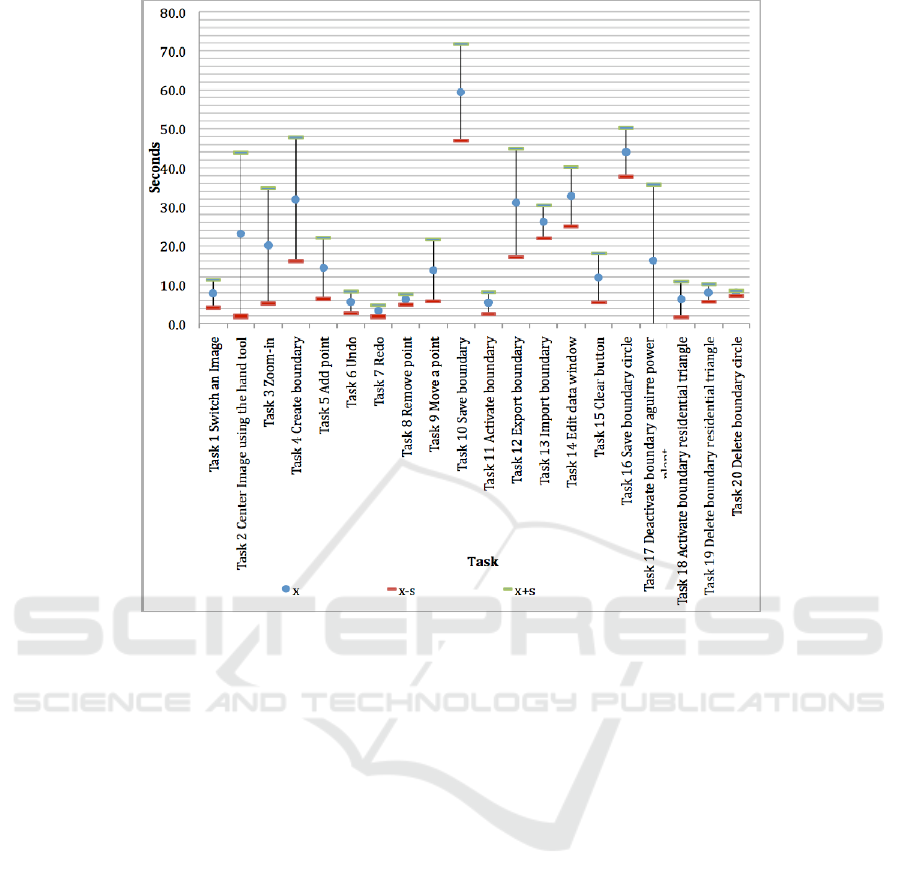
Figure 2: Task completion times.
After performing the tasks the users were asked
to rate fourteen interaction aspects dealing with
handling and editing boundary maps. They were
asked to rate each aspect using a 1-5 (difficult-easy)
scale. They were also asked to rate the overall
performance of the application and how useful it
seems for them. The dependent variables of the
study were the time to complete the tasks, the
number of tasks completed and the user subjective
satisfaction.
4.2 Results
Figure 2 shows the mean (X) and the standard
deviation (S) of the tasks completion times. Overall
it took the users and average of 378.3 seconds to
complete all the tasks with a standard deviation of
63.4 seconds. Saving a boundary was the most time
consuming task. The least time consuming tasks
were: switching an image (Task 2), undo (Task 6),
redo (task 7), remove point (Task 8), activate
boundary (Task 11 and Task 18), and delete a
boundary (Task 19 and Task 20).
Overall, the participants executed 200 tasks
combined of which only eight were not completed.
This constitutes a 96% task completion rate. Only
one of the users was not able to complete three tasks,
another was not able to complete two, while three
were not able to complete one task.
A summary of the average rating given to each of
the interaction aspects rated is presented in Figure 3.
The results indicate a very high rating for all the
items of the post test questionnaire. All the average
ratings were on or above 4.6.
5 CONCLUSIONS
The results of the study support the conclusion that
the boundary tool is very easy to learn and use. With
only a fifteen-minutes tutorial the users were able to
complete 96% of the tasks. The users perceive the
application as one that is very easy to use in general.
They found all individual interaction actions tested
as very easy to execute.
The most important contribution of this study is
the creation of a very easy to use and learn tool for
creating georeferenced boundary maps that could be
used from anywhere in the world.
WEBIST 2009 - 5th International Conference on Web Information Systems and Technologies
442
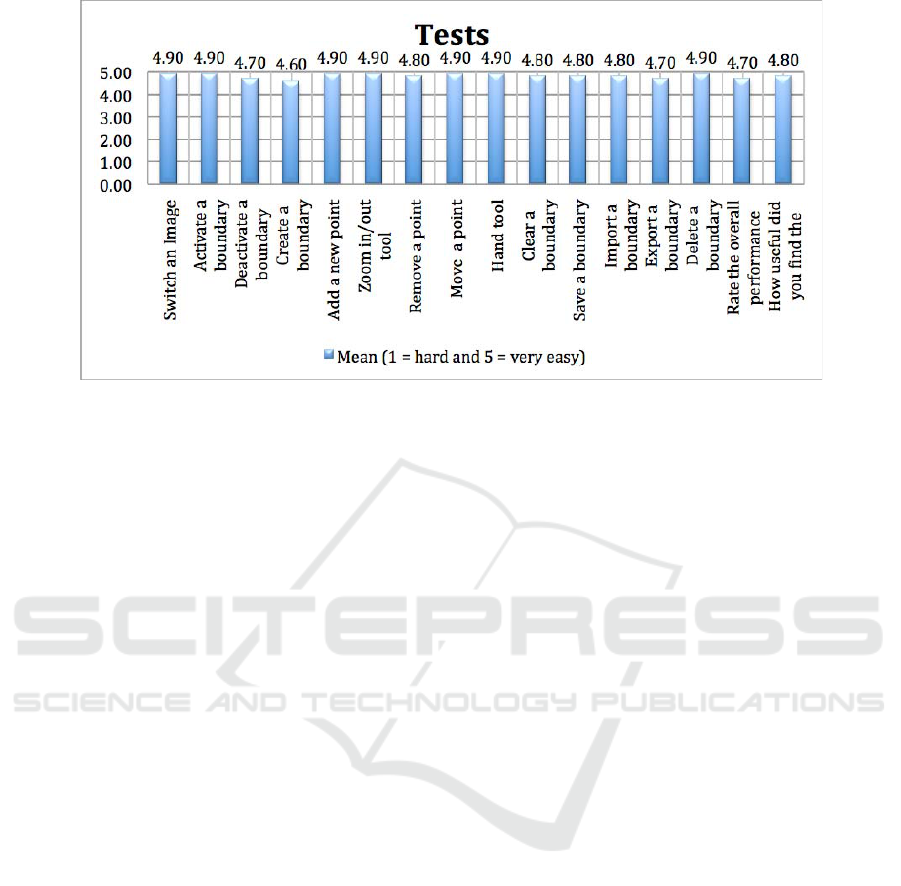
Figure 3: Average Ratings of Interaction Actions.
ACKNOWLEDGEMENTS
This research was made possible in part by the
support of the WLASAIP project at the University
of Puerto Rico at Mayaguez (NSF grant CNS -
0424546).
REFERENCES
Athan, T.: Introduction to Web-based GIS, In alt2is.com.
Retrieved October 16, 2008, from www.alt2is.com
(2007).
Nielsen, J.: Usability Engineering, Academic Press,
(1993).
Paulson, L. D.: Building Rich Web Applications with
AJAX. IEEE Computer Society, 38, (0) (2005) 14-17.
Sayar, A., Pierce, M., Fox, G. C.: Developing GIS
Visualization Web Services for Geophysical
Applications ISPRS: International Society for
Photogrametry and Remote Sensing Workshop
Commission II WG/2 METU, Ankara, Turkey (2005)
24-25.
Ahmet S., Pierce M., and Fox G.: Integrating AJAX
Approach into GIS Visualization Web Services.
Proceedings of IEEE International Conference on
Internet and Web Applications and Services ICIW'06,
Guadeloupe, French Caribbean (2006) 23-25.
Traynor, C. and Williams, M. G.: Why are Geographic
Information Systems Hard to Use? CHI95 Conference
Companion on Human Factors in Computing Systems.
Denver, Colorado, United States (1995) 288-289.
A WEB-BASED TOOL FOR CREATING GEOREFERENCED BOUNDARY MAPS
443
