
EVALUATING GENERALIZED ASSOCIATION RULES COMBINING
OBJECTIVE AND SUBJECTIVE MEASURES AND VISUALIZATION
Magaly Lika Fujimoto
1
, Veronica Oliveira de Carvalho
2
and Solange Oliveira Rezende
1
1
Computer and Mathematics Science Institute, S
˜
ao Paulo University, S
˜
ao Carlos, SP, Brazil
2
Informatics Faculty, Oeste Paulista University, Presidente Prudente, SP, Brazil
Keywords:
Generalized association rules, Objective measures, Subjective measures, Visualization, Knowledge evaluation.
Abstract:
Considering the user view, many problems can be found during the post-processing of association rules, since
a large number of patterns can be obtained, which complicates the comprehension and identification of inter-
esting knowledge. Thereby, this paper proposes an approach to improve the knowledge comprehensibility and
to facilitate the identification of interesting generalized association rules during evaluation. This aid is real-
ized combining objective and subjective measures with information visualization techniques, implemented on
a system called RulEE-GARVis.
1 INTRODUCTION
One of the data mining problems is that many algo-
rithms generate a large number of patterns, especially
when the association mining technique is used. To
overcome this problem, in relation to the association
rules, a specialized knowledge can be transformed
into a more general concept. This can be realized if an
application domain knowledge exists. The knowledge
can be represented in different manners, for exam-
ple, by taxonomies. Thus, the generalized association
rules, composed by items contained in any level of a
given taxonomy, introduced in (Srikant and Agrawal,
1995), can be obtained in the different steps of the
data mining process, given a general view of the do-
main.
There are many other post-processing techniques
that are used to facilitate the pattern comprehension
and the identification of interesting knowledge as
query evaluation, evaluation measures and informa-
tion visualization. The knowledge evaluation mea-
sures are usually classified as objective or subjec-
tive. The objective measures depend exclusively on
the pattern structure and the data used in the process
of knowledge extraction, while the subjective mea-
sures depend fundamentally on the final user’s interest
and/or needs. Therefore, the objective measures are
more general and independent of the domain in which
the data mining process is carried out. These mea-
sures can be insufficient to identify interesting rules,
because the objectives and the specialists’ knowledge
are not considered. Thereby, the combined use of
objective and subjective measures exploits the advan-
tages of each type, improving the identification of in-
teresting knowledge (Sinoara and Rezende, 2006).
As well as the knowledge evaluation measures, the
information visualization techniques can also aid the
rules evaluation. The visualization techniques usu-
ally use the human capability of visual interpretation
and assist in knowledge comprehension. According
to (Card et al., 1999), the information visualization is
the use of visual representation, interactive and com-
puter supported, of abstract data to broader cognition.
There are many works found in literature, related
to association rules visualization, as (Hofmann et al.,
2000), (Ong et al., 2002), (Yang, 2005), (Bruzzese
and Buono, 2004), (Techapichetvanich and Datta,
2005), (Chakravarthy and Zhang, 2003), (Ertek and
Demiriz, 2006), (Blanchard et al., 2003). However,
these works do not visualize generalized association
rules (with exception to (Yang, 2005)) and only use
the support and confidence objective measures values.
(Melanda and Rezende, 2003) work does not visual-
ize generalized association rules either, but uses other
objective measures, while other works utilize subjec-
tive measures, as (Liu et al., 2000). (Sinoara and
Rezende, 2006) present an approach that combines
the (Melanda and Rezende, 2003) objective measures
approach with the (Liu et al., 2000) subjective mea-
sures approach, verifying that the combined use of
objective and subjective measures can be interesting
to the user.
285
Fujimoto M., de Carvalho V. and Rezende S. (2009).
EVALUATING GENERALIZED ASSOCIATION RULES COMBINING OBJECTIVE AND SUBJECTIVE MEASURES AND VISUALIZATION.
In Proceedings of the 11th International Conference on Enterprise Information Systems - Artificial Intelligence and Decision Support Systems, pages
285-288
DOI: 10.5220/0001852802850288
Copyright
c
SciTePress

Despite the fact that the generalized association
rules enable the knowledge exploration in different
levels of abstraction, there still is the need to find
a way to explore the potential of this kind of rules.
Thus, the main objective of this work is to aid the user
in the comprehension and identification of interesting
generalized association rules. Therefore an approach
is proposed to improve the advantages of combining
objective and subjective measures with information
visualization techniques.
2 GARVis: AN APPROACH TO
EVALUATE GENERALIZED
ASSOCIATION RULES
The GARVis approach allows the user to analyze,
through objective measures, a generalized association
rule set using SQL queries and graphic analysis, se-
lecting a subset of rules to be explored by a domain
expert. From the selected rules, subjective measures
can be computed and a subjective measure explo-
ration can be done. That way, the user can analyze a
set of rules observing different aspects. The approach
is divided in four steps, described as follows.
Objective Analysis (1): it is considered, in this step,
that the user already has a generalized association rule
set obtained by the approach proposed by (Carvalho
et al., 2007). Initially, SQL queries are carried out
aiming to select some features and/or objective mea-
sure values that are of application interest in order to
obtain a focus set (the objective measures considered
are the ones described in (Tan et al., 2004)). If the
user is not interested in specific items, the focus set
is formed by the whole rule set. Applying graphic
analysis on the focus set using objective measures,
the focus set is filtered, conducing to the identifica-
tion of a subset of potentially interesting rules (PIR).
The graphic analysis of this step is realized in an in-
teractive way in a X-Y graphic, enabling the user to
directly interact with the graphic, facilitating his/her
comprehension and usability.
PIR Subset Evaluation (2): has as input the PIR sub-
set obtained from Step 1 and has as objective the eval-
uation of these rules by a domain expert. The knowl-
edge expressed in each one of the rules is classified
as irrelevant, obvious, previous, unexpected or use-
ful (one or more classification can be selected). Dur-
ing evaluation, the rules considered as irrelevant, by
a domain expert, are eliminated from the focus set,
as all the other similar rules (rules that contain irrel-
evant items in the same position (same side) of the
rule classified as irrelevant). In cases where there
is a rule with the same items, but in different posi-
tions, the user is asked to check if the rule has also
to be considered irrelevant. During this process, the
user can, in parallel, visualize the rules in a textual
form and make a graphic analysis. In this step, X-Y
graphics and bar charts are available for rule visual-
ization. The user can also visualize redundant, com-
plements and exceptions rules, which can be added
in the PIR subset in order to be evaluated. The de-
finitions of redundancy and exception described in
the (Zaki, 2004) and (Gonalves et al., 2005) works,
are considered respectively. The complement defini-
tion is proposed in this work as follows. Consider
R = {r
1
, ..., r
l
} a set of rules and X = {x
1
, ..., x
k
} a
taxonomy set. Given that r
i
,r
j
∈ R, r
i
is a comple-
ment of r
j
if ((r
i
.LHS = r
j
.LHS ∧ r
i
.RHS\r
j
.RHS =
w ∧ r
j
.RHS \ r
i
.RHS = w
0
) ∨ (r
i
.RHS = r
j
.RHS ∧
r
i
.LHS \ r
j
.LHS = w ∧ r
j
.LHS \ r
i
.LHS = w
0
)) and
w, w
0
have the same ancestral in taxonomy x
h
. The
complement is symmetric, so r
i
is a complement of r
j
and r
j
is a complement of r
i
.
Subjective Processing (3): in this step, for each of
the rules that are not eliminated from the focus set,
the subjective measures conforming, unexpected an-
tecedent, unexpected consequent, and both-side un-
expected, defined by (Liu et al., 2000), are computed.
To compute these measures, the classifications made
in Step 2, for the rules contained in the PIR subset, are
used as domain knowledge. That way, it is possible to
carry out an analysis with the subjective measures to
aid the identification of possible interesting rules not
previously found only by the objective measures anal-
ysis.
Subjective Measures Analysis (4): during the ex-
ploration of the rules contained in the resultant focus
set, using the subjective measures computed in Step
3, the user has the support of graphic analysis using
X-Y graphics and bar charts. The aim, with these vi-
sualizations, is to increase the rule comprehensibil-
ity and to facilitate the identification of interesting
knowledge, since the user has a visual and interactive
exploration option. It is important to mention that the
exploration in the resultant focus set should be car-
ried out according to the goals of the user during the
analysis. For example, if the user wishes to confirm
his/her previous knowledge, he/she can use the con-
forming measure and list the rules that conform to
the rules that had been evaluated as obvious or pre-
vious knowledge in Step 2. During this evaluation the
user can find some rules, not previously found, that
are also interesting for him/her.
After applying the four steps, the approach gener-
ICEIS 2009 - International Conference on Enterprise Information Systems
286
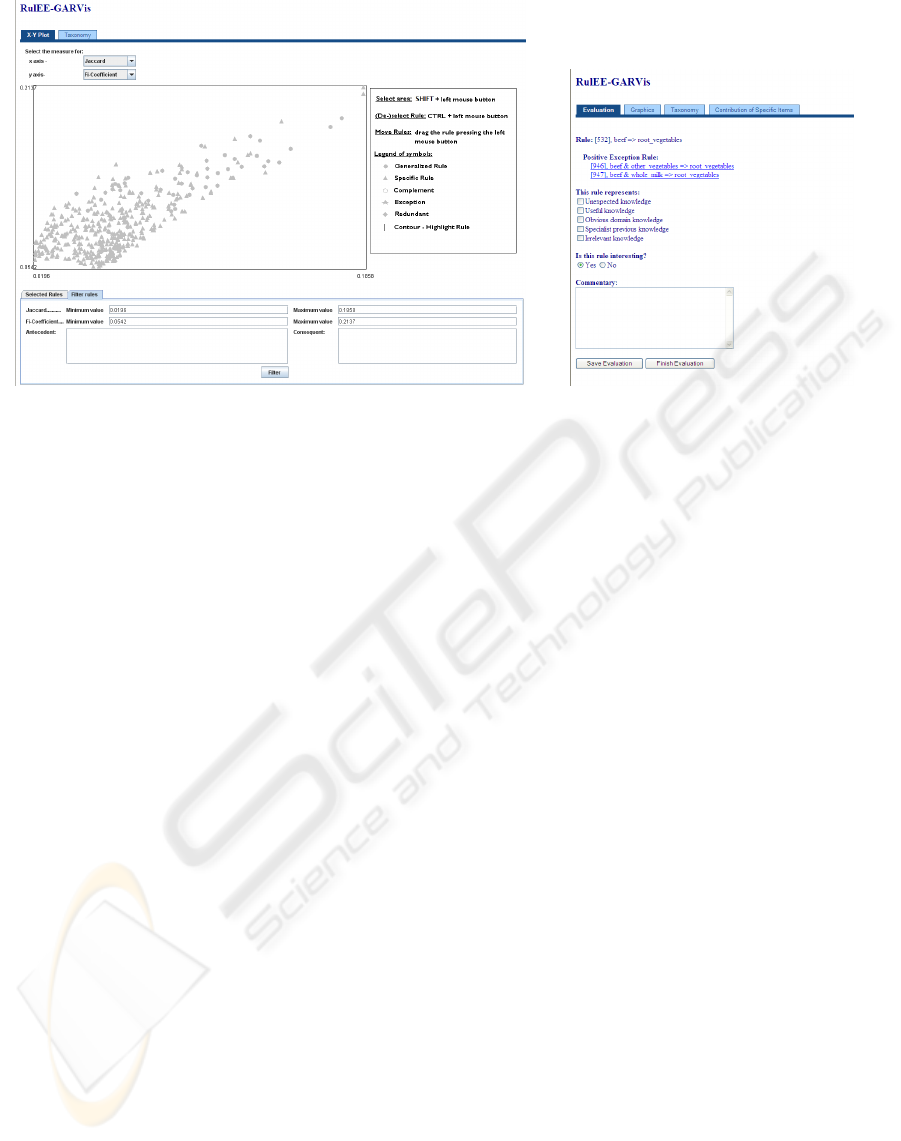
(a) PIR subset selection. (b) PIR subset evaluation.
Figure 1: Examples of PIR subset selection and evaluation process.
ates as output a subset containing the interesting rules
identified during the process, subset composed by the
rules found in the PIR subset plus the rules found in
the focus set that were considered interesting accord-
ing to the subjective analysis.
3 EXPERIMENT AND SCREEN
SNAPSHOTS
Experiments were carried out in order to demonstrate
the viability and usefulness of the GARVis approach,
using a system, called RulEE-GARVis, that imple-
ments the proposed approach. This section presents
one of the experiments realized with the groceries
data set (available for download at http://www.r-
project.org/) that contains one month of real-world
point-of-sale from a typical grocery outlet. A set com-
posed by 1680 generalized association rules, used in
this experiment, was obtained by the approach pro-
posed by (Carvalho et al., 2007).
In the objective analysis (Step 1) a focus set was
selected composed by 459 rules with Interest Factor
values greater than 2. Analyzing these rules (Fig-
ure 1(a)) with the IS/Cosine, Jaccard, φ-coefficient,
Piatetsky-Shapiro’s and Kappa objective measures
(according to (Carvalho et al., 2007), the more ap-
propriate measures to be used in the evaluation of
rules containing generalized items in the antecedent)
12 rules were selected to compose the subset of po-
tentially interesting rules (PIR).
Analyzing the PIR subset (Step 2), the domain ex-
pert classified the knowledge expressed in each one of
the 12 rules as unexpected, useful, obvious, previous
and/or irrelevant (Figure 1(b)). During this evalua-
tion, the user could visualize the positive and negative
exceptions, complements and redundancies, in cases
of existence. Using X-Y graphics, similar to Fig-
ure 1(a), and bar charts combined with some objec-
tive measures, of the 12 PIR, 9 were evaluated as in-
teresting and 3 as not interesting since they presented
a previous knowledge.
After the step referring to the subjective mea-
sures computation (Step 3), the subjective analysis
was made (Step 4). In this step, the user could list
in a textual form the evaluated rules, separated ac-
cording to its classification made in Step 2. The user
could also visualize in a X-Y graphic the evaluated
rules using different colors, where each color indi-
cated its classification made in Step 2. After selecting
one of the rules in the graphic, the user chose some
subjective measures, defining its minimum and maxi-
mal values, in order to search in the resultant focus
set the rules that corresponded to the knowledge ex-
pressed by the selected rule (defined in Step 2). From
the obtained set, the user visualized the rules in a tex-
tual form and defined some of them as interesting.
Thus, after the selection and analysis of some rules,
3 interesting rules were selected in this step.
In the end, the user visualized the rules considered
interesting in a textual form and through bar and pie
charts. In this experiment, 12 interesting rules were
found. It is important to mention that 9 of these rules
were found using objective measures and 3 using sub-
jective measures, demonstrating the importance of
combining both measures supported by visualization.
It could be observed, through this experiment, that
EVALUATING GENERALIZED ASSOCIATION RULES COMBINING OBJECTIVE AND SUBJECTIVE MEASURES
AND VISUALIZATION
287

the approach is viable, since it aids the user in the
comprehension and identification of interesting gen-
eralized association rules, allowing the user to explore
and evaluate the rules using many resources. Besides,
the interactive graphic analysis facilitates the rule set
exploration, since this analysis is made with different
measures and filters.
4 CONCLUSIONS
This paper presented an approach that aids the post-
processing of generalized association rules and facili-
tates the comprehension and the identification of the
interesting ones using objective and subjective mea-
sures combined with information visualization tech-
niques, features that distinguish the approach with the
ones cited in Section 1. This combination provides
the user with different evaluation mechanisms, facili-
tating his/her participation in the discovery process of
interesting knowledge.
The experiment presented in Section 3 shows that
the application of the proposed approach using the
RulEE-GARVis system is viable and useful. As future
work, other experiments using the GARVis approach
with different real data sets and specialists in other
domains will be carried out.
REFERENCES
Blanchard, J., Guillet, F., and Briand, H. (2003). Ex-
ploratory visualization for association rule rumma-
ging. In Proceedings of the KDD’03 Workshop on
Multimedia Data Mining (MDM), pages 107–114.
Bruzzese, D. and Buono, P. (2004). Combining visual tech-
niques for association rules exploration. In Proceed-
ings of the Working Conference on Advanced Visual
Interfaces (AVI), pages 381–384. ACM Press.
Card, S. K., Mackinlay, J. D., and Shneiderman, B. (1999).
Readings in information visualization: Using vision
to think. Morgan Kaufmann Publishers Inc.
Carvalho, V. O., Rezende, S. O., and Castro, M. (2007). Ob-
taining and evaluating generalized association rules.
In Proceedings of the International Conference on
Enterprise Information Systems (ICEIS), volume 2,
pages 310–315.
Chakravarthy, S. and Zhang, H. (2003). Visualization of
association rules over relational DBMSs. In Proceed-
ings of the 2003 ACM Symposium on Applied Com-
puting (SAC), pages 922–926.
Ertek, G. and Demiriz, A. (2006). A framework for visuali-
zing association mining results. Computer and Infor-
mation Sciences, 4263/2006:593–602.
Gonalves, E. C., Mendes, I. M. B., and Plastino, A. (2005).
Mining exceptions in databases. In Advances in Arti-
ficial Intelligence, pages 1076–1081. Springer-Verlag.
Hofmann, H., Siebes, A. P. J. M., and Wilhelm, A. F. X.
(2000). Visualizing association rules with interactive
mosaic plots. In Proceedings of the 6th ACM SIGKDD
International Conference on Knowledge Discovery
and Data Mining.
Liu, B., Hsu, W., Chen, S., and Ma, Y. (2000). An-
alyzing the subjective interestingness of association
rules. Intelligent Systems and Their Applications,
IEEE, 15(5):47–55.
Melanda, E. A. and Rezende, S. O. (2003). Uso combinado
de medidas objetivas como filtro de regras de associao.
In Proceedings of the 4th Congress of Logic Applied to
Technology Conference (LAPTEC), volume 2, pages
170–178.
Ong, K.-H., Ong, K.-L., Ng, W.-K., and Lim, E.-P.
(2002). CrystalClear: Active visualization of asso-
ciation rules. In ICDM’02 International Workshop on
Active Mining (AM). Press.
Sinoara, R. A. and Rezende, S. O. (2006). A methodology
for identifying interesting association rules by com-
bining objective and subjective measures. Inteligncia
Artificial, Revista Iberoamericana de IA, 10(32):19–
27.
Srikant, R. and Agrawal, R. (1995). Mining generalized
association rules. In Proceedings of the 21th Interna-
tional Conference on Very Large Data Bases (VLDB),
pages 407–419.
Tan, P.-N., Kumar, V., and Srivastava, J. (2004). Selecting
the right objective measure for association analysis.
Information Systems, 29(4):293–313.
Techapichetvanich, K. and Datta, A. (2005). Visar: A new
technique for visualizing mined association rules. In
Advanced Data Mining and Applications, pages 88–
95. Springer-Verlag.
Yang, L. (2005). Pruning and visualizing generalized as-
sociation rules in parallel coordinates. IEEE Transac-
tions on Knowledge and Data Engineering, 17(1):60–
70.
Zaki, M. J. (2004). Mining non-redundant association rules.
Data Mining and Knowledge Discovery, 9(3):223–
248.
ICEIS 2009 - International Conference on Enterprise Information Systems
288
