
MODELING AND SIMULATION FOR DECISION SUPPORT
IN SOFTWARE PROJECT WORKFORCE MANAGEMENT
Bernardo Giori Ambrósio
1
, José Luis Braga
2
, Moisés A. Resende-Filho
3
and Jugurta Lisboa Filho
2
1
Departamento de Ciências Exatas e Aplicadas, Universidade Federal de Ouro Preto, João Monlevade, Brazil
2
Departamento de Informática, Universidade Federal de Viçosa, Viçosa, Brazil
3
Departamento de Economia, Universidade Federal de Juiz de Fora, Juiz de Fora, Brazil
Keywords: Software Engineering, Software Process, Requirements, Risk Evaluation.
Abstract: This paper presents and discusses the construction of a system dynamics model, focusing on key managerial
decision variables related to workforce management during requirements extraction in software
development projects. Our model establishes the relationships among those variables, making it possible to
analyze and to better understand their mutual influences. Simulations conducted with the model made it
possible to verify and foresee the consequences of risk factors (e.g. people turnover and high requirements
volatility) on quality and cost of work. Three scenarios (e.g. optimistic, baseline and pessimistic) are set
using data from previous studies and data collected in a software development company.
1 INTRODUCTION
The decision making process in software
development projects has become more complex
over time as a result of the increased number of
interrelated variables to be considered. It is common
to observe low quality software, cost overruns and
schedule delays in software development projects,
indicating that managerial aspects of software
development processes are not fully understood by
many software project managers (Kappelman,
Mckeeman & Zhang, 2006).
Adequately analyzing alternative decisions and
their dynamic impacts on software development
projects is often beyond the human capacity. This
fact creates the need for using tools like system
dynamics to support decisions. Indeed, system
dynamics provides a modeling technique that makes
it possible to understand and simulate decision
problems with dynamic behavior (Sterman, 2000).
Previous studies to be presented in section 2 of
this paper have employed system dynamics models
in order to describe the mutual influence of variables
in software project management process. Some of
these studies addressed the requirements workflow
that is often taken as of secondary importance for
many software development companies
(Kappelman, Mckeeman & Zhang, 2006).
This paper introduces a system dynamics model
relating some key decision variables taken from the
requirements workflow in software processes. We
use the model to create three scenarios (e.g. baseline,
optimistic and pessimistic). These scenarios are set
by changing parameters associated with risk factors
and alternative managerial interventions. In so
doing, we used data collected from previous works
and from a software development company.
This paper is developed as follows. Section 2
presents an overview of system dynamics. Section 3
describes our system dynamics model. Section 4
presents an analysis of scenarios’ simulations.
Finally, section 5 presents the main conclusions.
2 CONTEXT
A system dynamics model (Sterman, 2000) has three
main components: stocks that accumulate system’s
resources, flows that change the level of stocks, and
converters or variables that influence the values of
flows. In Figure 1 we show an example of a stock
named Specified Requirements, an example of a
305
Ambrósio B., Braga J., Resende-Filho M. and Lisboa Filho J. (2009).
MODELING AND SIMULATION FOR DECISION SUPPORT IN SOFTWARE PROJECT WORKFORCE MANAGEMENT.
In Proceedings of the 11th International Conference on Enterprise Information Systems - Artificial Intelligence and Decision Support Systems, pages
305-308
DOI: 10.5220/0001857203050308
Copyright
c
SciTePress
flow named Rate of Change Request, and an
example of a variable named work remaining in
function points.
Senge (Senge, 1990) suggests that influence
diagrams should be constructed in early stages of a
modeling process in order to better understand
relations between variables. In an influence diagram,
a "+" on a link means that linked variables vary in
the same direction (when a variable
increases/decreases the other variable
increases/decreases). On the other hand, a "-" on a
link indicates that linked variables vary in opposite
directions.
Examples of studies that have addressed the use
of system dynamics for modeling aspects of
software project management are (Abdel-Hamid &
Madnick, 1991), (Abdel-Hamid, 1996), (Lin, Abdel-
Hamid & Sherif, 1997), (Collofello et al., 1998),
(Abdel-Hamid, Sengupta, & Swett, 1999),
(Sengupta, Abdel-Hamid & Bosley, 1999) and
(Madachy, 2008). (Pfahl & Lebsanft, 2000) is an
example of study that addresses the requirements
extraction and specification but that is limited in its
scope once it focus only on the impacts of
requirements volatility.
3 A DYNAMIC MODEL FOR
WORKFORCE MANAGEMENT
The system dynamics model discussed in this paper
addresses key variables related to workforce
management while extracting requirements. In
following, we will explain the relationships between
variables on the basis of information taken from
previous works. We used a free academic version of
Vensim (http://www.vensim.com) that is the
software used to construct and run our system
dynamics simulations. Due to space constraint, this
paper presents parts of our model and looks only at
requirements volatility and workforce turnover
issues.
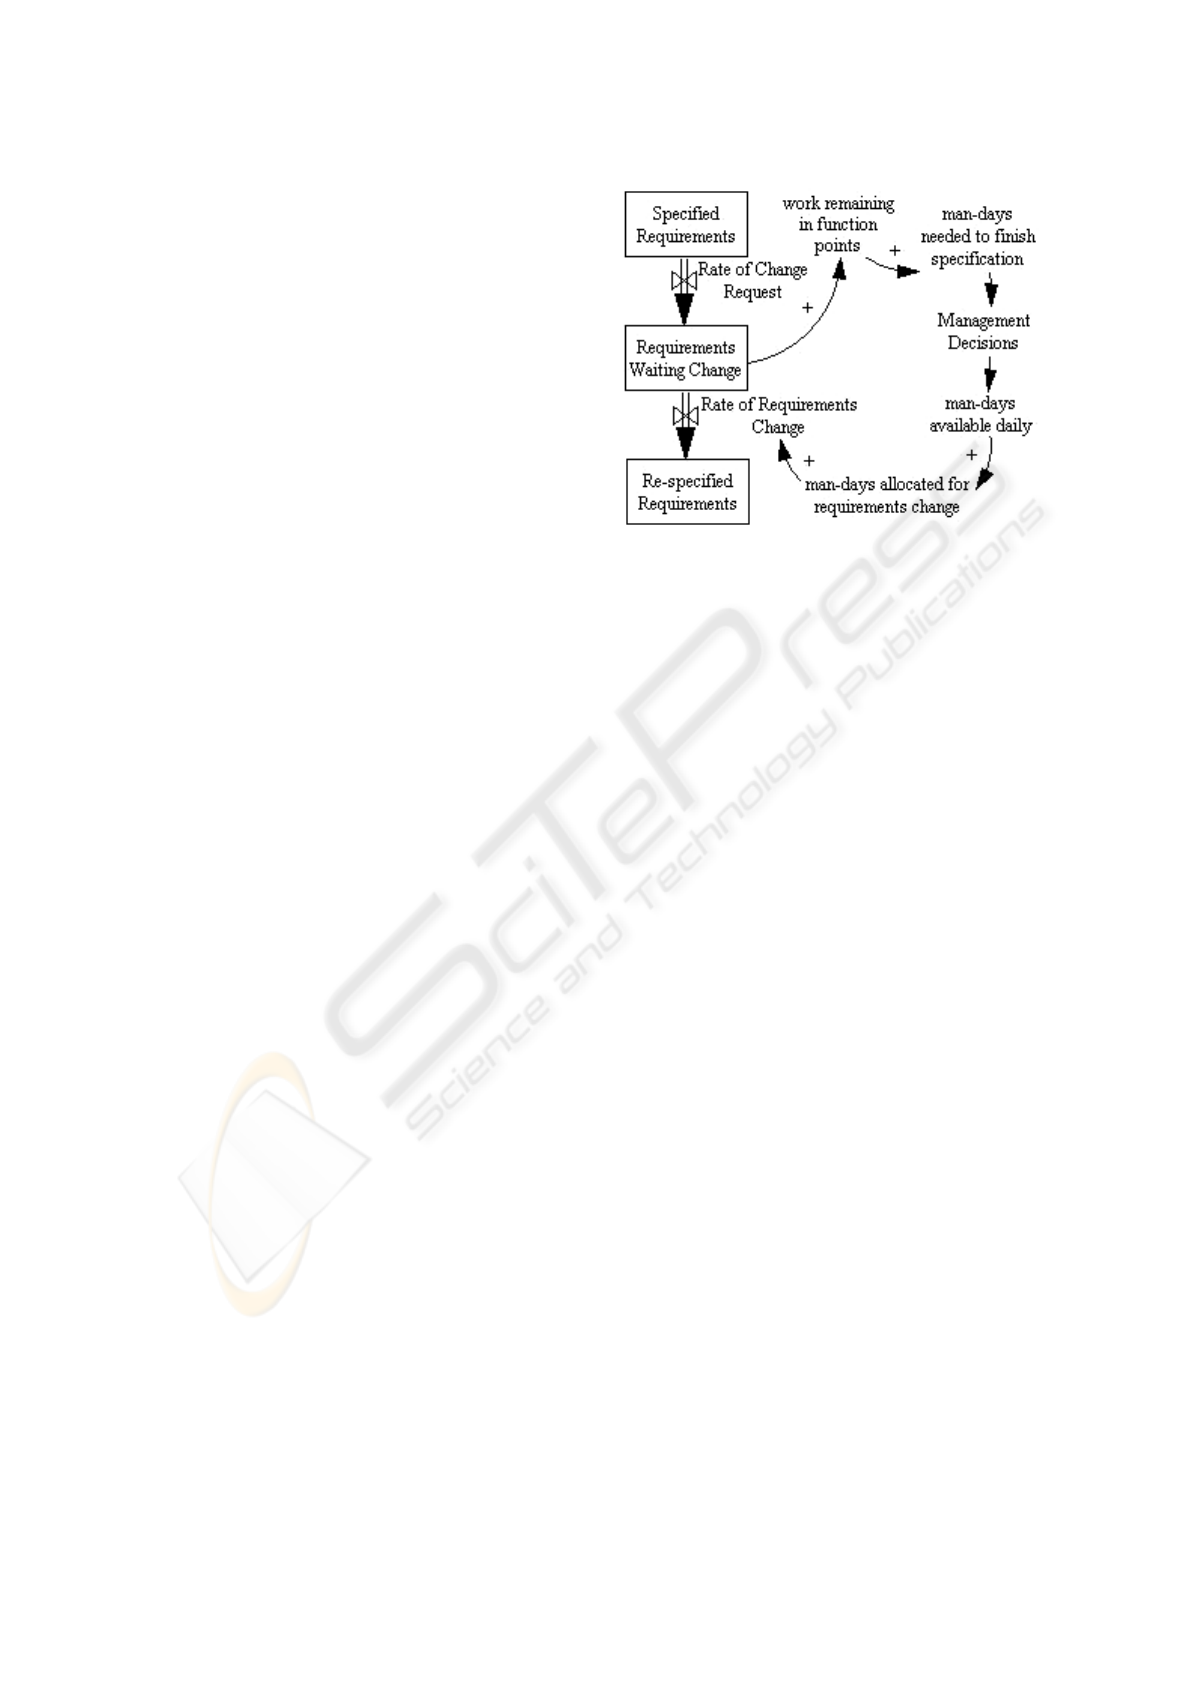
In Figure 1, the flow Rate of Change Request
denotes the rate at which requirements changes are
requested and conveys information about the
requirements stored in the stock Specified
Requirements to the stock Requirements Waiting
Change. It causes an increase in the variables work
remaining in function points and man-days needed
to finish specification (Madachy, 2008).
Figure 1: The impact of high requirements volatility on the
amount of effort needed to achieve changes.
Managerial decisions determine the total amount
of effort allocated to work (variables man-days
available daily and man-days allocated for
requirements change). This effort determines the
value of flow Rate of Requirements Change.
In order to handle an increase in the amount of
effort needed, avoiding delays in schedule plan, it
may be necessary: (i) to increase team size and/or
(ii) to contract extra effort from workers by
encouraging them to work harder and for more hours
(Abdel-Hamid, 1996). Both alternatives contribute
to an increase in the rate of specification errors.
Team workers are classified into beginners and
experienced, as shown in Figure 2. Beginners are
less productive and cause more errors than
experienced workers (Lin, Abdel-Hamid & Sherif,
1997). The need for increased team size increases
the amount of beginners in the team. This fact
contributes to increase the number of specification
errors (Lin, Abdel-Hamid & Sherif, 1997).
When there is risk of schedule overrun, team
members are encouraged to work harder (Abdel-
Hamid, 1996) to provide extra effort. It may cause
team stress and exhaustion, increasing the number of
errors made (Collofello et al., 1998). Increased
schedule pressure also implies a reduction in effort
allocated to quality assurance activities (Abdel-
Hamid, Sengupta & Swett, 1999).
The model uses a stock called Man-days Spent to
measure the cost of finishing requirements
specification. The increase in the amount of effort
needed due to higher requirements volatility leads to
cost increases.
ICEIS 2009 - International Conference on Enterprise Information Systems
306
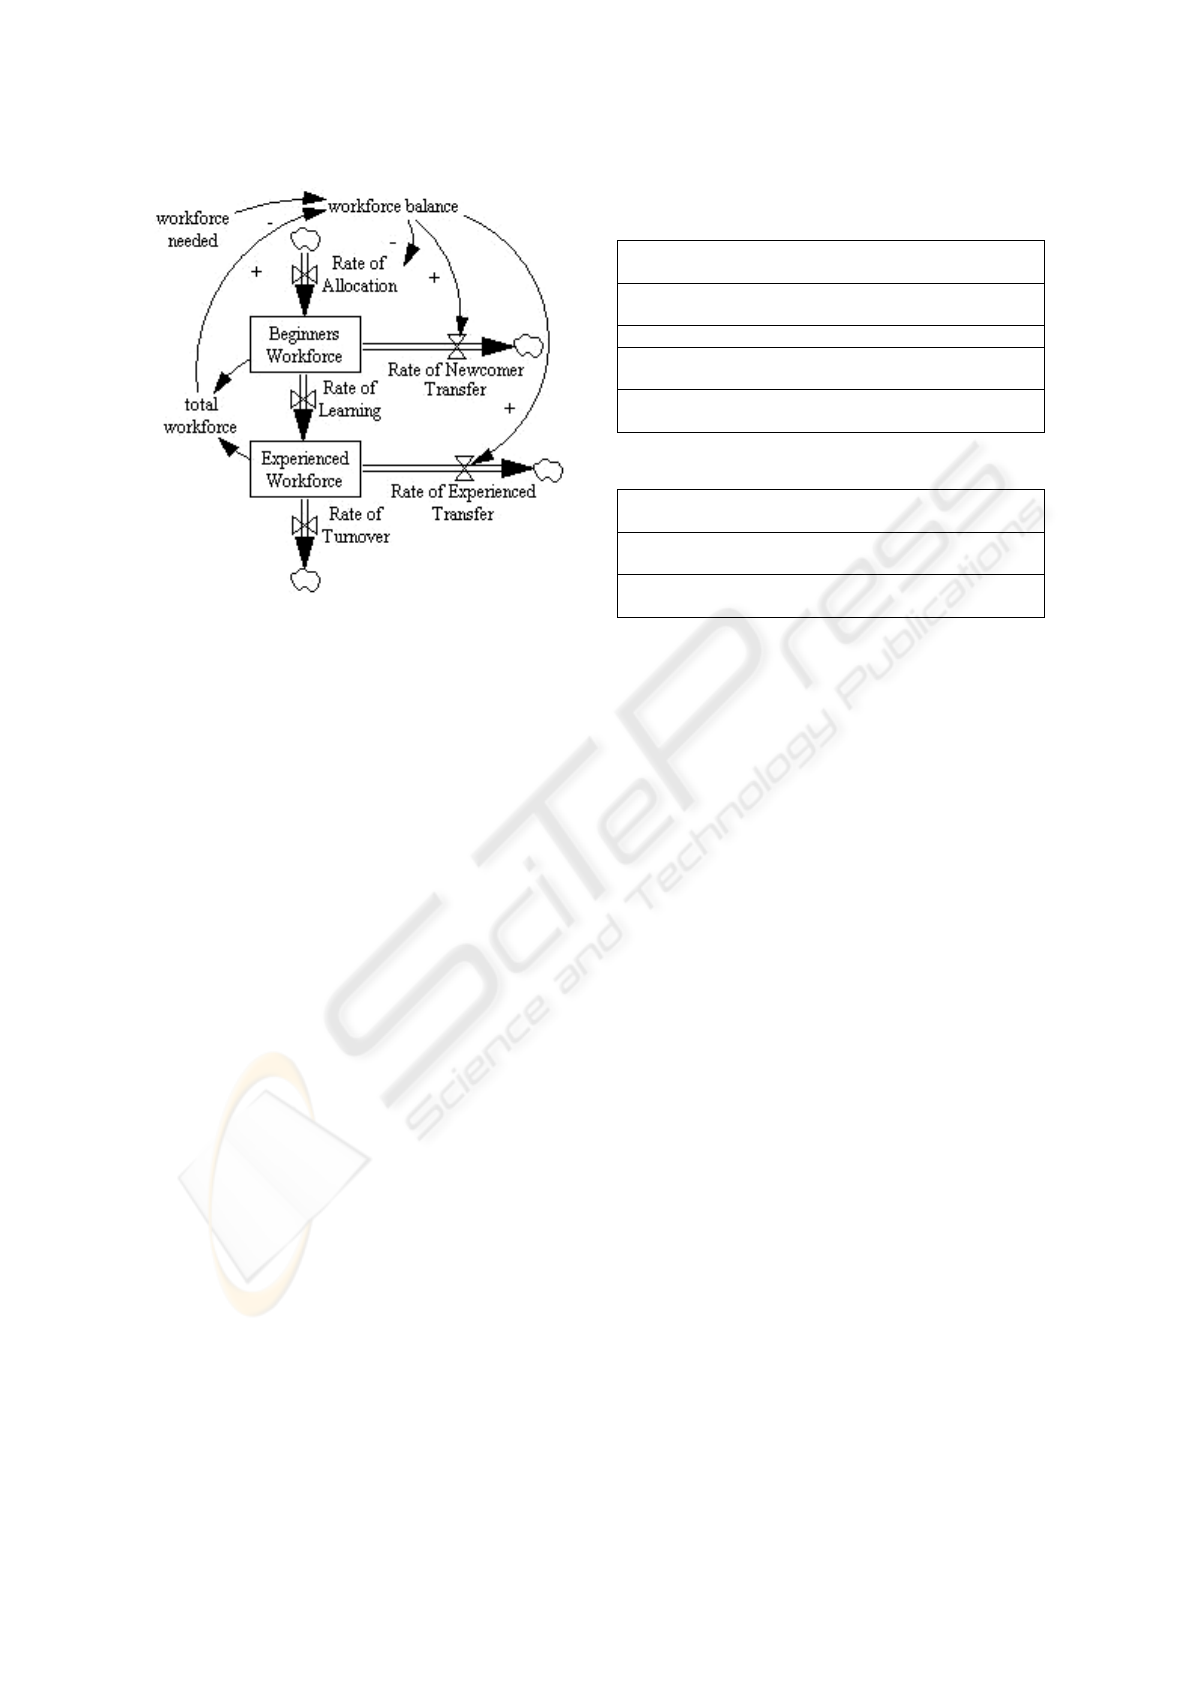
Figure 2: The loop originated from the effects of
workforce turnover on the allocation of beginners in team.
The flow Rate of Turnover in Figure 2 unleashes
an increase in the value of the flow Rate of
Allocation. Therefore, beginners are allocated to
team in order to balance the effects of increased
turnover, which contributes to increase the amount
of specification errors made.
The increase in the amount of errors can trigger
an increase in the amount of effort needed to finish
requirements specification. Team members are then
encouraged to make extra effort (Abdel-Hamid,
1996), which also may increase the number of errors
made. The workforce turnover may cause an
increase in cost of work due to: (i) the use of extra
effort; (ii) an increase in the amount of effort needed
to fix errors while they are detected.
4 SIMULATIONS
Values of variables in the model can be adjusted in
order to set scenarios. We use some variable values
obtained from a company that develops software, to
set and carry out our simulations. These values are
estimated according to the experience of a software
company’s director and a project manager,
considering a medium size software project that
demands a schedule from 12 to 18 months.
Table 1 presents the values baseline (more
likely) informed for some variables in the model.
The values in Table 1 were used in setting the three
scenarios. Other variables that have received specific
values for the optimistic, baseline and pessimistic
scenarios are presented in Table 2.
Table 1: Values obtained from a software development
company.
1- Requirements specified and delivered in a software
release: 120 requirements = 120 function points.
2- Average productivity of workers in team: 2 function
points per man-day.
3- Initial team size: 2.
4- Percentage of team effort that is allocated to quality
assurance: 10%.
5- Increase in effort by team members when there are
risks of schedule overrun: up to 15%.
Table 2: Values used to set the scenarios.
1- Probability of error made in requirements workflow
Optimistic: 5% Baseline: 15% Pessimistic: 20%
2- Probability of requirements change
Optimistic: 10% Baseline: 20% Pessimistic: 30%
3- Turnover
Optimistic: No Baseline: No Pessimistic: Yes
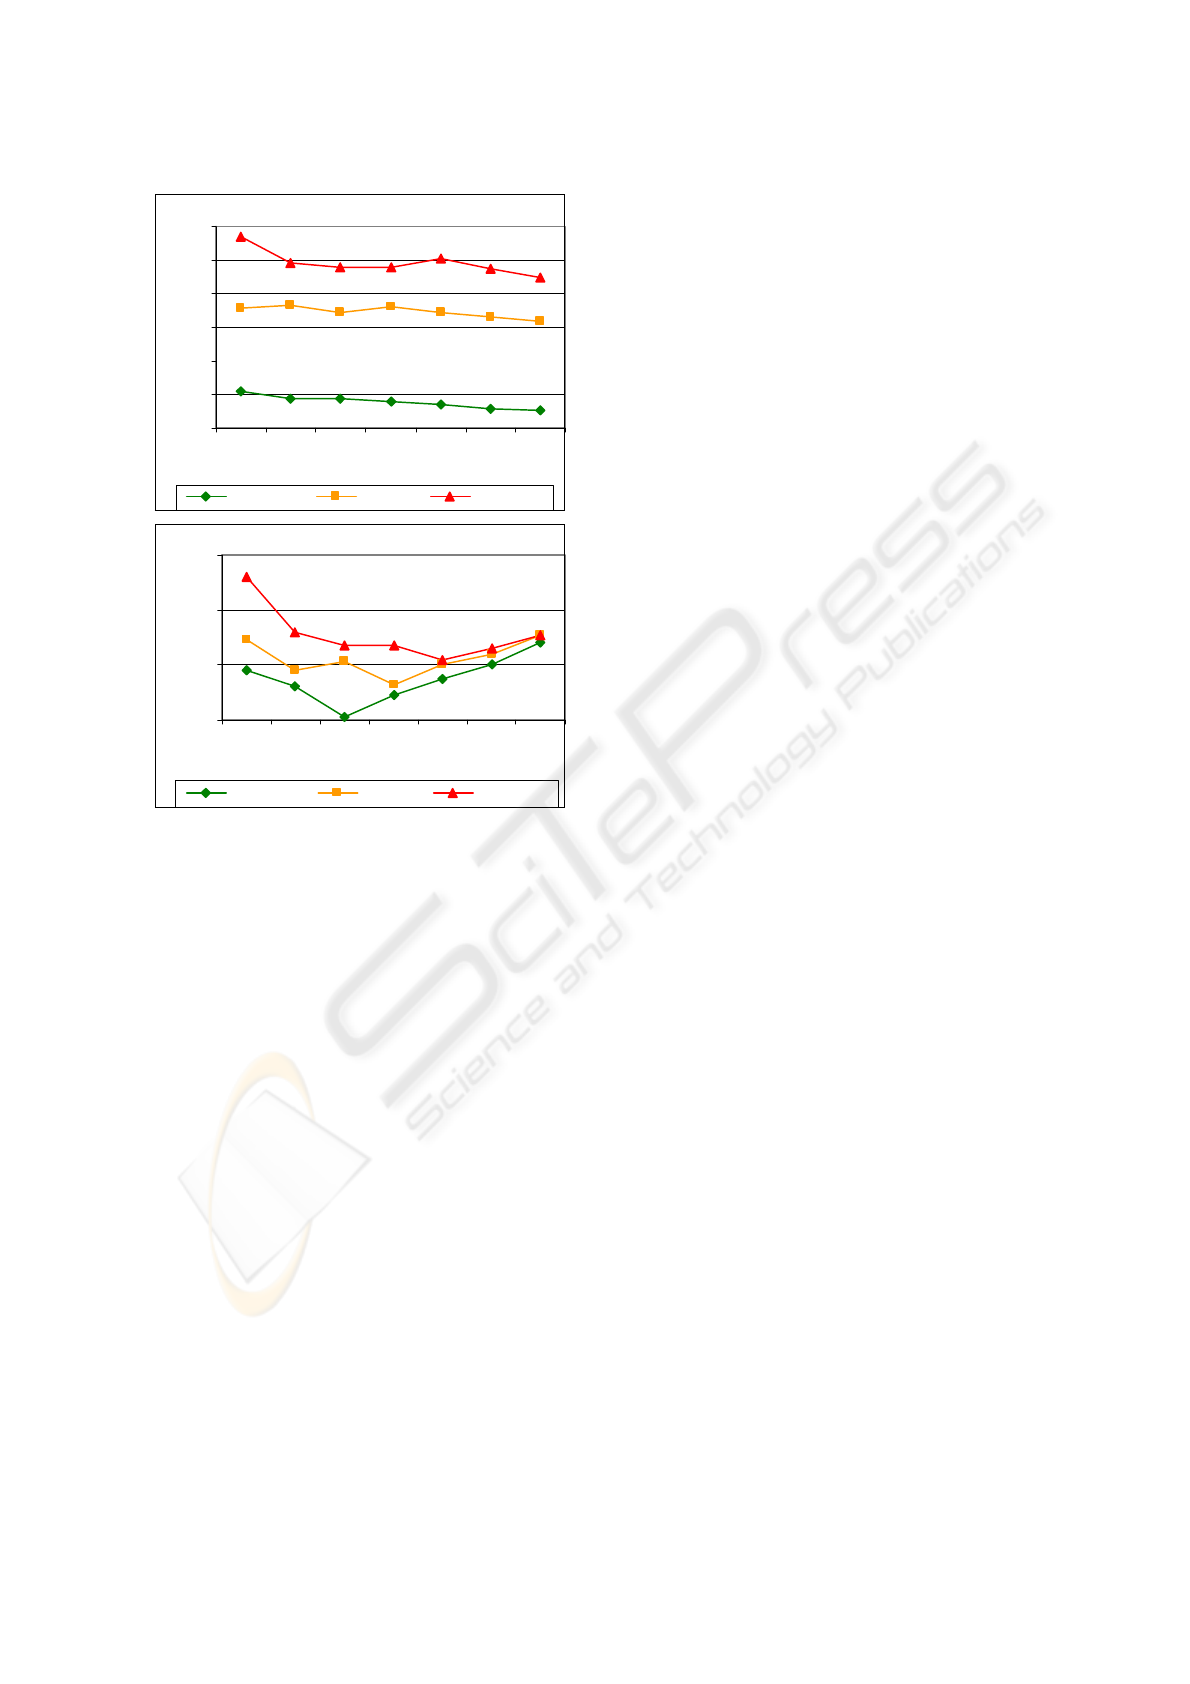
The graphs presented in Figure 3 can be used to
compare the results of the three scenarios. Shorter
schedule tends to increase the amount of
specification errors. This is because in order to finish
specification faster, it may be necessary to increase
the size of the work team and/or to promote
overtime (Abdel-Hamid, 1996), what contributes to
increase the amount of errors made (Lin, Abdel-
Hamid & Sherif, 1997) (Collofello et al., 1998).
Cost curves show that there is a project schedule
plan that generates the minimum cost for each
scenario. While encouraging the conclusion of
software specification in a shorter time span, it may
be necessary to increase the size of the team and/or
to contract team’s extra effort (Abdel-Hamid, 1996)
that will increase costs. However, when software
specification schedule is overestimated, team works
with lower productivity (Abdel-Hamid & Madnick,
1991), which also increases cost.
Notice though that cost curves get closer to each
other when schedule is overestimated. This is
because great part of effort used to handle rework in
the pessimistic scenario comes from idle time of
team that would exist in other scenarios. Notice that
in the optimistic scenario, the amount of effort
necessary to finish the specification is lower than in
any other scenario. As a result, idle time increases
causing a reduction in team productivity, what
increases cost.
MODELING AND SIMULATION FOR DECISION SUPPORT IN SOFTWARE PROJECT WORKFORCE
MANAGEMENT
307
Quality
4,64,7
5,1
5,35,65,6
6,2
12,5
12,9
13,8
13,313,3
13,913,7
17,3
16,5
17,2
18,1
17,4
17,8
20,1
3
6
9
12
15
18
21
15 20 25 30 35 40 45
schedule (days)
Requirements Errors (%)
optimistic baseline pessimistic
Cost
78
72
61
69
75
80
88
89
78
81 73
80
84
91
86
82
87
87
92
112
60
80
100
120
15 20 25 30 35 40 45
schedule (days)
Man-days Spent
optimistic baseline pessimistic
Figure 3: Results of simulations.
5 CONCLUSIONS
Simulation results show that the behavior of our
model is consistent with the literature in the area of
Software Engineering. Our model is capable of
dealing with other managerial issues such as the
effects of allocating resources to quality assurance
and the effects of change in schedule plan, team size
and extra work use.
It is usually impossible to reproduce a software
development project in order to study the
consequences of changes in factors that affect it.
Therefore, models emerge as an alternative for the
creation of "learning laboratories" (Sterman, 2000)
in companies. This is because models can enable
managers to learn from simulations, without
incurring the risks and costs of a real project.
It is necessary to verify the validity of the model
by analyzing the results of simulations carried out
using real data from various software development
companies. Thus, it will be possible to determine
more precisely the right context for using the model.
Finally, our model can be used as a basis for the
implementation of a simulator to be used in training
software project managers.
ACKNOWLEDGEMENTS
This research was partially financed by Fapemig and
CNPq.
REFERENCES
Abdel-Hamid, T. K., & Madnick, S. E. (1991). Software
Project Dynamics: an Integrated Approach.
Englewood Cliffs, NJ: Prentice Hall.
Abdel-Hamid, T. K. (1996). The Slippery Path to
Productivity Improvement. IEEE Software, 13, 4, 43-
52.
Abdel-Hamid, T. K., Sengupta, K., & Swett, C. (1999).
The Impact of Goals on Software Project
Management: An Experimental Investigation. MIS
Quarterly, 23, 4, 531-555.
Collofello, J. et al. (1998). A System Dynamics Software
Process Simulator for Staffing Policies Decision
Support. Proceedings of the Thirty-First Hawaii
International Conference on System Sciences, pp. 103-
111.
Kappelman, L. A., Mckeeman, R., & Zhang, L. (2006).
Early Warning Signs of it Project Failure: The
Dominant Dozen. Information Systems Management,
23, 4, 31-36.
Lin, C. Y., Abdel-Hamid, T., & Sherif, J. S. (1997).
Software-Engineering Process Simulation Model.
Journal of Systems and Software, 38, 3, 263-277.
Madachy, R. J. (2008). Software Process Dynamics.
Piscataway, NJ: John Wiley & Sons, Inc.
Pfahl, D., & Lebsanft, K. (2000). Using Simulation to
Analyse the Impact of Software Requirement
Volatility on Project Performance. Information and
Software Technology, 42, 14, 1001-1008.
Senge, P. (1990). The Fifth Discipline: The Art and
Practice of the Learning Company. New York, NY:
Currency Doubleday.
Sengupta, K., Abdel-Hamid, T. K., & Bosley, M. (1999).
Coping with Staffing Delays in Software Project
Management: an Experimental Investigation. IEEE
Transactions on Systems, Man, and Cybernetics – Part
A: Systems and Humans, 29, 1, 77-91.
Sterman, J. D. (2000). Business dynamics: systems
thinking and modeling for a complex world. Boston,
MA: Irwin McGraw-Hill.
ICEIS 2009 - International Conference on Enterprise Information Systems
308
