
BRAIN PHYSIOLOGICAL CHARACTERISTIC ANALYSIS FOR
SOFTWARE ANALYSIS SUPPORT ENVIRONMENTS
Mikio Ohki and Haruki Murase
Nippon Institute of Technology, 4-1 Gakuendai, Miyashiro, Saitama, Japan
Keywords: Information System Analysis, Analysis support environment, Brain Physiological Approach.
Abstract: In the field of Industrial Engineering, a number of studies on the production process have been conducted to
achieve higher quality and productivity through the ages. On the other hand, as for software development,
no study has been conducted on the environment optimized for brain work from the viewpoints of
personality, motivation, and procedures to improve quality and productivity, since brain work is not visible.
However, recently, devices that can measure the activation state of brain in a practical work environment
are available. This paper analyzes software analysis tasks from the viewpoint of brain physiology based on
the measurement results attained from the experiments using such a device and discusses the fundamental
issues and challenges to implement an ideal software analysis support environment.
1 INTRODUCTION
Simply imitating the work processes of experts does
not ensure that an analyst can get advanced
analytical capabilities since the representation forms,
types, or application methods of decision rules are
not revealed yet. As a result, reuse approaches have
been adopted, in which analysis results of expert
analysts are structured and stored as a set of patterns
and retrieved according to a specific situation for
reuse, as seen in the Analysis Pattern approaches
(Martin Fowler et al., 1997).
These approaches might be adequate when the
brain activities could not be directly observed during
analysis tasks and should be handled as black boxes.
However, in the recent years, emergence of devices
that can directly measure brain activities (e.g.,
Optical Topography devices) makes it possible to
measure "the activation level, activated locations,
and activation transition of cerebral cortex" in real
time while an analyst is performing software
analysis tasks under an actual operation
environment. The authors therefore decided to use
an Optical Topography device(Hitachi Medical
Co.,Ltd) to measure the activated state of cerebral
cortex during software analysis tasks, and performed
measurement experiments and analyzed the results
to provide an answer to the following questions.
This paper provides the analysis results of the
measurement experiments and describes the authors'
insights on the results, which may contribute to the
answers. This paper also describes the future
direction of our research and points out new issues
detected during the experiments.
●How can the optimal brain work be defined?
In the field of Industrial Engineering, to achieve
higher performance and reliability, physical energy
consumption, working hours, and satisfactory levels
of working environment factors (motivation,
willingness, etc.) have been used as measurement
scales in optimization researches. As for brain work,
what kind of measurement scales should be used and
optimization criteria should be defined to attain
higher performance and reliability?
●What kind of basic brain activities are comprised
in typical software analysis tasks?
The researches on the generic tasks (B.Chandra-
sekaran et al., 1993) in the artificial intelligence area
pointed out that the intellectual activities of human
beings can be divided into several typical patterns
that are used in different conditions accordingly.
Then, what kind of basic brain activities are used in
software analysis tasks, how are they combined, and
how frequently are they used? As a more
fundamental question, can the basic brain activities
under software analysis tasks be divided into or
broken down to more elemental brain activities?
●Are there any differences in the activated brain
parts or activity patterns according to the level of
analysts’ software analytical capabilities.
329
Ohki M. and Murase H. (2009).
BRAIN PHYSIOLOGICAL CHARACTERISTIC ANALYSIS FOR SOFTWARE ANALYSIS SUPPORT ENVIRONMENTS.
In Proceedings of the 11th International Conference on Enterprise Information Systems - Information Systems Analysis and Specification, pages
329-337
DOI: 10.5220/0001864503290337
Copyright
c
SciTePress
As for physical work, it is commonly recognized
that the same task is quite differently performed by
an expert and a novice and typical differences are
observed in the effort distribution for a task, task
arrangement, and procedures. Then, what kind of
difference is observed for the activated regions in
the brain and the activation patterns between the
brain activities of an expert and a novice? In
addition, is there any difference in the activation
timing or order of basic brain activities? If specific
brain activities are observed frequently during
analysis tasks, the capability of an analyst can be
enhanced by providing a working environment that
provides support for those brain activities.
●What kind of characteristics do the support
environment or the educations or training methods
that enhances analysis capability have?
It is known that the standard process
recommended by a specific methodology varies for
each analysis domain. Then, what kind of the
components and in which order should the analysis
methodology be provided with regard to the
analytical capability and the characteristics of a
specific analyst, and a specific analysis domain?
2 PURPOSE OF MEASUREMENT
The Optical Topography device used to measure the
activation state of brain is a device that measures the
activation level by measuring the volume of
hemoglobin contained in the blood flow within the
cerebral cortex. According to the following basic
concepts, only the activated state of the cerebral
cortex is measured when the activation state is
measured for an analyst while performing analysis
tasks.
2.1 Basic Perspective of Brain
Activation
In the area of brain physiology, advanced devices
including fMRI (functional Magnetic Resonance
Imaging) and PET (Positron Emission Tomography)
have been increasingly used to analyze and identify
the functionality of each brain part and a number of
achievements have been reported in recent years.
However, identifying the brain part that is activated
corresponding to each functional type of task is not
very important for the research of high level brain
functions such as software analysis because brain is
structured in complex hierarchies of cerebral nerve
networks organized through evolution of brain and a
high level brain function is achieved through close
interactions among these networks. Therefore,
activation patterns as well as principles in the
transition of activated states have to be investigated
by focusing on the entire function networks related
to a specific brain area. This study aims to clarify the
principles that reside behind the activation states of
cerebral cortex by measuring them with the Optical
Topography device.
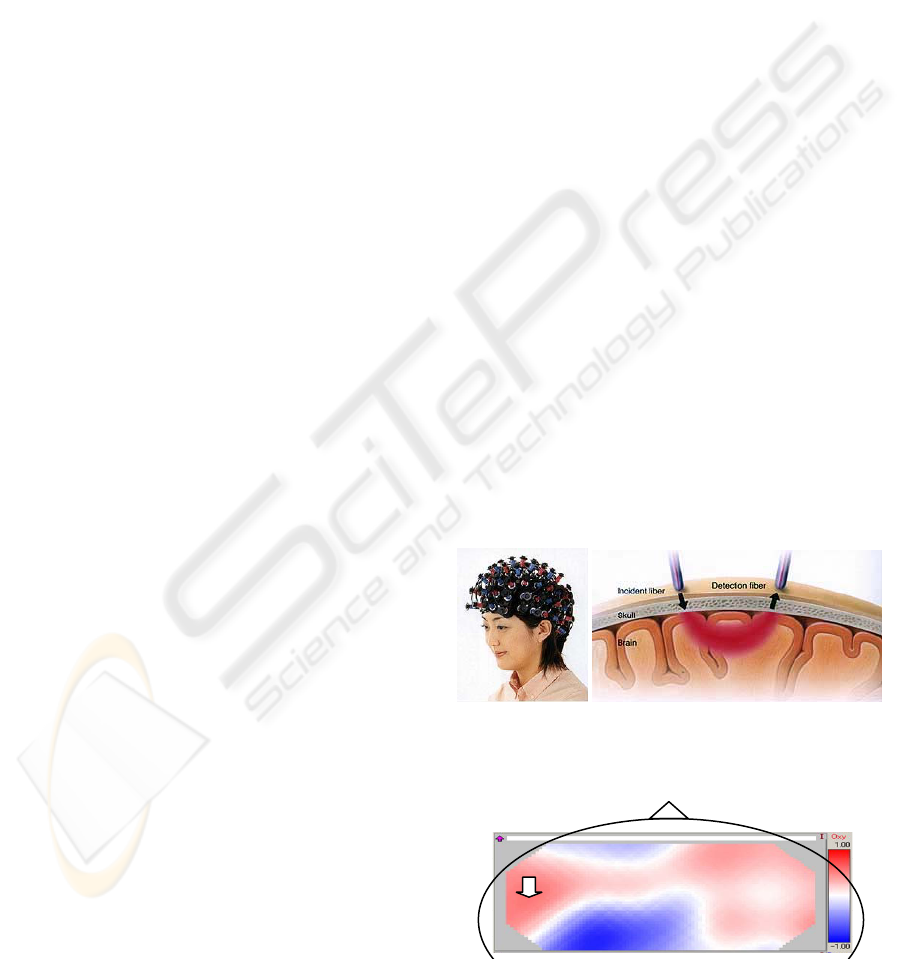
2.2 Outline of Optical Topography
Device
The basic principle of the Optical Topography
device is based on the measurement of blood flow
that supplies oxygen to the brain, which is increased
when the energetic metabolism of brain is activated
by the person's will or a stimulus from outside. It
measures the density of oxygenated hemoglobin in
the blood flow to determine the activity level of the
brain. Specifically, as shown in Figures 1 and 2, NIR
(Near-Infrared) laser is irradiated to the cerebral
cortex through the skull and the density variation of
the laser reflected by the Oxy(Oxygenated
hemoglobin) and the De-Oxy(De-Oxygenated
hemoglobin) is measured to determine the activated
part and the activation level. The incident fibers that
irradiate NIR laser and the detection fibers are
located alternatively with the interval of 30 mm in
the square grid pattern. A single optical fiber
measurement device is called as a channel. The
values for the locations between the channels are
calculated by interpolating the measurement values
of the channels.
A
ctivatedstateofthecerebralcorte
x
Figure 3: A measurement example by Optimal
Topography device.
Figure 1: Image of
Optimal Topogra-
phy device.
Figure 2: The principle of Optimal
Topography device.
ICEIS 2009 - International Conference on Enterprise Information Systems
330

Figure 3 shows the measurement data of Oxy in
the prefrontal area as a topography image. The red
areas, which correspond to the areas with higher
Oxy density, represent highly activated regions.
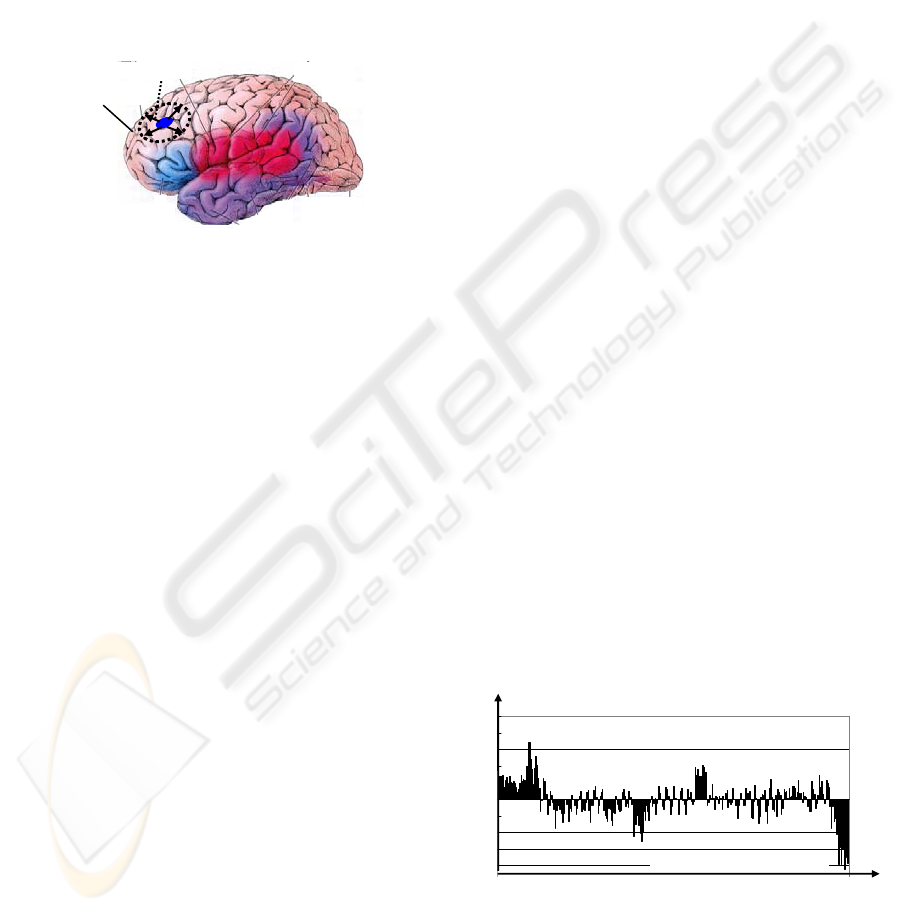
2.3 Target Region of Measurement
We selected a limited measurement area because the
Optical Topography device used in this
measurement experiment was equipped with only 24
measurement channels. According to the results of
brain physiology studies, the prefrontal cortex is
defined as "the region that orders the information
from outside, extracts the information required for
action plans, composes complex action plans, and
decides actions to be performed with the person's
will and motivation." The authors selected the
prefrontal cortex as the target area to be measured
for the activation state of brain during the software
analysis and design tasks.
3 ASSUMPTIONS AND
DEFINITIONS
3.1 Basic Volume of Brain Work
The volume of oxygenated hemoglobin (Oxy)
increases to supply oxygen to the brain cells when
the cerebral cortex is activated. The volume of Oxy
can be used as an indicator that represents the
activation level of cerebral cortex since the more
volume of Oxy is required when the more flood
volume is detected around the area. On the other
hand, the volume of De-Oxy that has released
oxygen in the blood flow can also be used as an
indicator of the activation level of cerebral cortex
since it indicates that the oxygen has been consumed
around the region. The authors decided to adopt the
difference between B.F.V (Blood Flow Volumes) of
Oxy and De-Oxy, which indicates the oxygen
consumption volume, as the measure for the
activation level although there are discussions about
which should be selected as the measure for
activation level, Oxy or De-Oxy. Then, we defined
the oxygen consumption volume φ
i
as follows, as the
"activation level" of the brain cells at the location of
Channel "i", provided that both the volumes of Oxy
and De-Oxy are the normalized values of those
actually measured within a measurement period.
φ
i
= Normalized (B.F.V Oxy – B.F.V De-Oxy)
3.2 Defining Optimal Brain Work
We adopted the following principles to define the
optimal brain work.
(1) The load of brain work is proportional to the
variation quantity of the activation level.
Unlike physical work, how can we define the
level of heavily loaded state for brain work?
According to our introspection, activation of a
specific region of our brain does not make us feel
tired. In fact, the examinee (a senior student) did not
report that he recognized specific load from the
brain work after he played a trump game for a long
time while he was equipped with the Optical
Topography device, although his entire prefrontal
area was observed to be highly activated by the
trump game. On the other hand, he reported that he
felt tired from the brain work after he performed
more than one task simultaneously that requires
frequent switching of thinking, such as a trump
game and reading, while his entire prefrontal cortex
observed to be highly activated.
To the contrary, the activation level went down
within a short time when the task was simple and
innocuous and did not require switching of thinking.
That is, when the frequency of changes in the
activation level is constant, the flexibility of brain
allows the person to be adjusted to the situation and
the load on the person is alleviated. To the contrary,
when the activation level of brain work changes
randomly, the person is more tired if the change
frequency varies in a higher rate. Based on the above
introspection and the results of hearing, the authors
have acquired an insight that "the load of brain work
depends on the magnitude of changes in the
activation level (i.e. the volume of oxygen
consumption)."
(2) Defining brain work volume in analogy with the
laws of physics.
The load of physical work can be defined by the
work volume required for a specific task. That is, as
shown bellow, the work volume E is commonly
defined as the integration of Fdx produced by
multiplying the Force F applied to a mass point by
the moved differential distance dx.
E =
∫
F dx
On the other hand, no "commonly recognized
work volume definition" is established for brain
work, and in that sense we are in the era of Galileo
Galilei for physical work. However, the law of
gravity found by him, which formed the foundation
of the Newton's laws of motion later (i.e., the
BRAIN PHYSIOLOGICAL CHARACTERISTIC ANALYSIS FOR SOFTWARE ANALYSIS SUPPORT
ENVIRONMENTS
331
movement distance of a falling object is proportional
to the square of the time elapsed), gives us an
important suggestion.
Assume that a region of the brain is being
activated according to an external impact. Then, as
shown in Figure 4, the impact is propagated through
the cerebral cortex at a steady speed κΔt (where κ
represents the transfer coefficient and Δt represents
the differential unit time), and the extent of the
impact continues to extend while affecting the
oxygen consumption volume of the region within the
propagated cortex.
Frontalcortex
κ
Δ
t
Figure 4: Propagation of oxygen consumption volume
variation triggered by an impact.
This phenomenon can be expressed by the next
equation that represents the variation of oxygen
consumption volume Δ(Σφ
i
) for the whole affected
regions. Where, "i" represents the number of regions
within the affected area and α is a constant value that
represents the impact level to other regions.
Δ(Σφ
i
) = α(κΔt)
2
In addition, introducing the concept of the Force
of Impact F
imp
by differentiating above equation two
times results in next equation representing that the
Force of Impact, which expresses the acceleration of
the oxygen consumption volume, is a constant value.
F
imp
=Δ
2
(Σφ
i
)/Δt
2
= 2ακ
2
This equation represents the observation stated in
(1) as an equation, which means that a person feels
more tired when the change frequency of the
activation level or the oxygen consumption volume
varies in a higher rate. The Force of Impact is
assumed to represent different magnitude of load for
each brain activity and vary according to the
person's motivation or willingness to the given brain
work.
In analogy with the laws of physics, we defines
the total work amount E
brain
(p) as the next equation,
focusing on the cerebral cortex during a specific
brain activity p.
E
brain
(p) = F
imp
(p, t, s) dt ds
∫∫
Where, F
imp
(p, t, s) represents the Force of
Impact produced in the specific brain region s at the
time t when a brain activity p is executed, provided
that the integration operation of the differential time
dt is performed for the whole work time period and
the integration operations of ds, which represents a
differential area of cerebral cortex, is performed for
the whole target area.
(3) How to measure work volume for brain work.
To actually measure F
imp
(p, t, s) shown in the
above equation, it is necessary to replace the double
integration part related to F
imp
(p, t, s) with the total
value from channels. For this purpose, we modified
above equation to define the "total work volume" for
the brain work as shown by next equations, named
"Equations of Brain Work Energy ".
[Equations of Brain Work Energy]
E
brain
(p) =
∑
i
w
i
(p) F
imp
i
(p)
F
imp
i
(p) =
∑
i
(Δ
2
φ
i
(p, t)
/Δt
2
)
2
F
imp
i
(p) indicates the Force of Impact of channel
i when the brain activity p is performed, w
i
(p)
represents its weight, φ
i
(p, t) represents the oxygen
consumption volume of channel i at time t when the
brain activity p is performed. ∑ indicates the total
value of all measurable channels and ∑ indicates the
total value within the measurement time period. The
acceleration rate of change of oxygen consumption
volume Δ
2
φ
i
(p, t)
/Δt
2
is multiplied by itself to get a
positive value for the total work volume (we tried to
propose other formalization for defining Brain Work
Energy, but no suitable equations could be obtained
for distinct brain work units. See 3.3.)
Figure 5 shows F
imp
(p, t, s) that is calculated
from the actually measured data using "Equations of
Brain Work Energy." Figure 5 uses the measurement
time period as the horizontal axis to plots the oxygen
consumption volume calculated form the measured
data of a single channel after the data is smoothed to
eliminate noises.
-0.08
-0.06
-0.04
-0.02
0
0.02
0.04
0.06
0.08
0.1
0 50 100 150 200 250
Measurementtimet
AccelerationrateofchangeΔ
2
φ
i
(p,t)
/Δt
2
Figure 5: Acceleration rate of change of oxygen
consumption volume on a channel.
In the measurement experiment described in this
paper, all of the weights w
i
(p) applied to channels
for measurement are set to a constant value of 1 in
ICEIS 2009 - International Conference on Enterprise Information Systems
332

order to focus on the proof of the assumption of
"Equations of Brain Work Energy," although it is
possible to calculate the exact values based on the
contribution rates to the principal component axis,
which is calculated from the Principal Component
Analysis based on F
imp
i
(p) for all channels.
(4) What is the optimal brain work process?
In the world of physics, it is recognized that there
is the Principle of minimum action, shown in the
following equation, behind the law of motion ruling
the natural environment.
δI = δ L(q, q’) dt = 0
∫
That is, according to this principle, there is some
functional L (Lagrangean) behind any motion of a
mass point defined by time, location q , and velocity
q’, and its movement in the natural environment is
determined to minimize the variation of integral L.
The Principle of minimum action leads to the
conclusion that "the natural motion of an object is
subject to the law that achieves the minimum energy
under a given condition." This conclusion can be
used as the criterion to derive the optimal process for
physical work. That is, it can be used as the criteria
of the optimal work process that is defined as "the
combination or order of work processes that result in
the minimum energy for the whole physical work."
Then, is it possible to use this principle as the
criteria for building the optimal brain work process
and order the steps. That is, when performing a
specific type of brain work, is it possible to define
the optimal brain work process as "the combination
or order of steps that can attain the minimized
E
brain
(p) under a given condition?" Unfortunately, we
have no information about the criteria that should be
applied to the brain work process that is possibly
controlling the optimal brain work.
As the first step, we have to verify whether the
optimal brain work process exists or not.
Specifically, it is necessary to check to see if
there is any difference between the total work
volume E
brain
(p) of an expert analyst and that of a
novice analyst when they perform the same brain
work p.
3.3 Assumption of Brain Work Unit
Before quantitatively analyzing the brain work based
on the total work volume described in the previous
section, we have to answer the following questions:
i) Are there any independent fundamental brain
work elements (hereinafter called as a brain work
unit) for brain work?
ii) If there are some brain work units, what kind of
tasks (hereinafter called as work unit) do they
correspond to?
iii) Is it possible to break down various software
analysis task (hereinafter called as analysis task)
into a set of brain work units?
That is, when the activation state of cerebral
cortex during software analysis task is represented
with ψ, is it possible to express ψ as a superposition
of activation states of cortex φ
i
each of which
corresponds to a brain work unit "i"?
As the prerequisites to answer these questions,
we make the following hypotheses.
(1) There are brain work units.
According to the Generic Task concept of the
artificial intelligence study, it is assumed that the
human intellectual activities are composed of the
following fundamental intellectual activities. They
are appropriate from the introspective viewpoint and
can be adopted as candidates of brain work units.
●Classification
●Classification + Intelligent Database
●Abduction
●Hypothesis Assessment by Hierarchical
Matching
●Routine Design as Plan Selection and
Refinement
However, in addition to these activities, there are
many fundamental brain work units. For example,
operations related to memory, searching, and
calculation can also be treated as fundamental brain
work units. In addition, the process of trial and error
can be recognized as a single brain work unit. Thus,
as the first step of our study, we selected five
activities as the candidates of brain work unit,
including trial and error, memory, searching,
calculation, and hypothesis generation. Now, as of
November 08, we are planning the second step study
for the measurement experiment including the above
intellectual activities.
(2) A specific brain work unit corresponds to one of
the following work unit.
The following tasks are selected in the
measurement experiment as typical work units that
contain brain work units.
1)Work unit based on trial and error.
●Disentanglement puzzles (four types)
●Three dimensional puzzle (one type)
2)Work units centering around memory and
reproduction.
●Concentration trump game (one type)
●Memorizing digits (three types)
●Memorizing figures (three types)
BRAIN PHYSIOLOGICAL CHARACTERISTIC ANALYSIS FOR SOFTWARE ANALYSIS SUPPORT
ENVIRONMENTS
333
3)Work units of simple calculation
●Computational problem
4)Work units centering around plan generation
and refinement
●Building Lego blocks
(3)Analysis tasks can be represented by a
superposition of work units.
This hypothesis is an issue that should be
verified through the analysis in the measurement
experiment. We investigated the relationship with
work units through the following analysis tasks. The
result is described in Chapter 5.
1) Data flow analysis (Use data flow diagrams to
illustrate a simple ongoing work analysis)
2) ER analysis (Describe a simple ER model)
However, the judgment rules used in the ER
modeling were provided to all of the examinee in
advance.)
3) Class analysis (Describe a simple class
structure)
3.4 Definition of Proficiency Level of
Analyst
It is necessary to define the proficiency level to
verify that there is an optimal brain work process
described in Section 3.2(4) and compare the total
work volume of an expert analyst with that of a
novice analyst from the viewpoint of proficiency
level. In the experiment, we randomly selected four
students from junior or senior students of Nippon
Institute of Technology, who had learned software
analysis and design methodologies and the ER
analysis methodology. Since those students had
almost the same years of experience and proficiency
levels, we defined the business ability level shown in
the next equation instead of the proficiency level and
used it in the variation analysis(see 4.1) of the total
work volume.
Business ability=Grade × Experience of
analysis in an experiment class
Where, "Grade" indicates the grade they got in
the software engineering class or the database theory
class. "Experience of analysis in an experiment
class" indicates if they have an experience of
analysis and design in the development experiment
class that was aimed to give the students business
experiences. The development experiment class is a
one year course targeted to the junior students and
designed to give the students actual business
experiences from analysis to development. It was
accepted from a Non-Profit Organization social
welfare organization located near our university.)
Figure 6 shows the grade and business experience of
the four students.
The fact that the examinees with analysis experi-
ence got higher grade than those without analysis
experience indicates that a person's business ability
is corresponding to his/her grade amplified by
his/her analysis experience.
0
1
2
3
4
5
6
7
8
9
系列1
系列
2
系列
3
DFD
ER
Class
Grade
With
higher
business
ability
Withlower
Figure 6: Business ability of examinees.
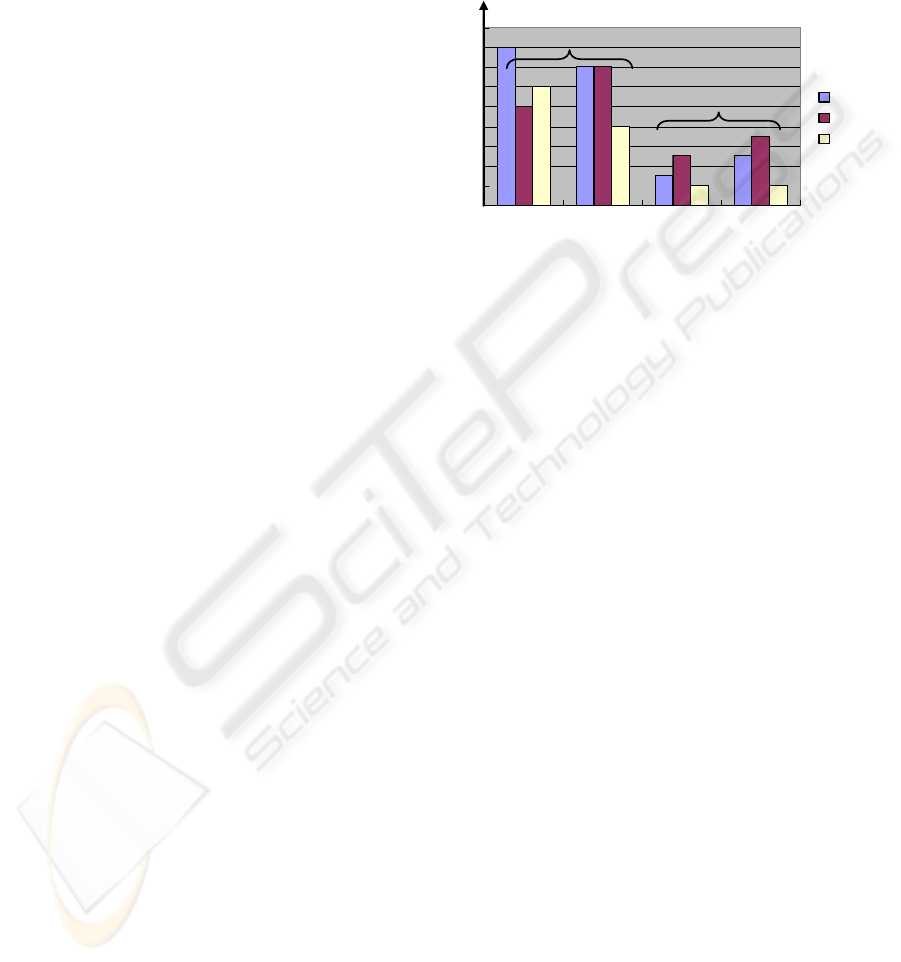
4 RESULTS OF EXPERIMENT
4.1 Distribution of Total Work Volume
for Each Work Unit
Based on the total work volume defined in
"Equations of Brain Work Energy" Figure 7 shows a
sample of total work volume calculated for each
work unit per examinee. Figure 8 shows the average
of total work volume for each task since the total
work volume for analysis task or work unit varies
depending on the examinee' ability. However, each
work unit is consolidated for each task category.
From the analysis results, clear differences have
been found between the categories of trial-and-errors
and calculation and those of plan generation and
refinement, analysis, and memory reproduction. This
is a natural result since the target region of
measurement was the prefrontal area that controls a
person's will, motivation, and planning.
4.2 Correlation Analysis of Work Unit
and Analysis Tasks
To study the correlation between each software
analysis task and each work unit, we analyzed the
correlation between work units and analysis tasks
using the work volume calculated for each channel.
As a result, a number of significant correlations were
found for each combination of work unit and analy-
ICEIS 2009 - International Conference on Enterprise Information Systems
334
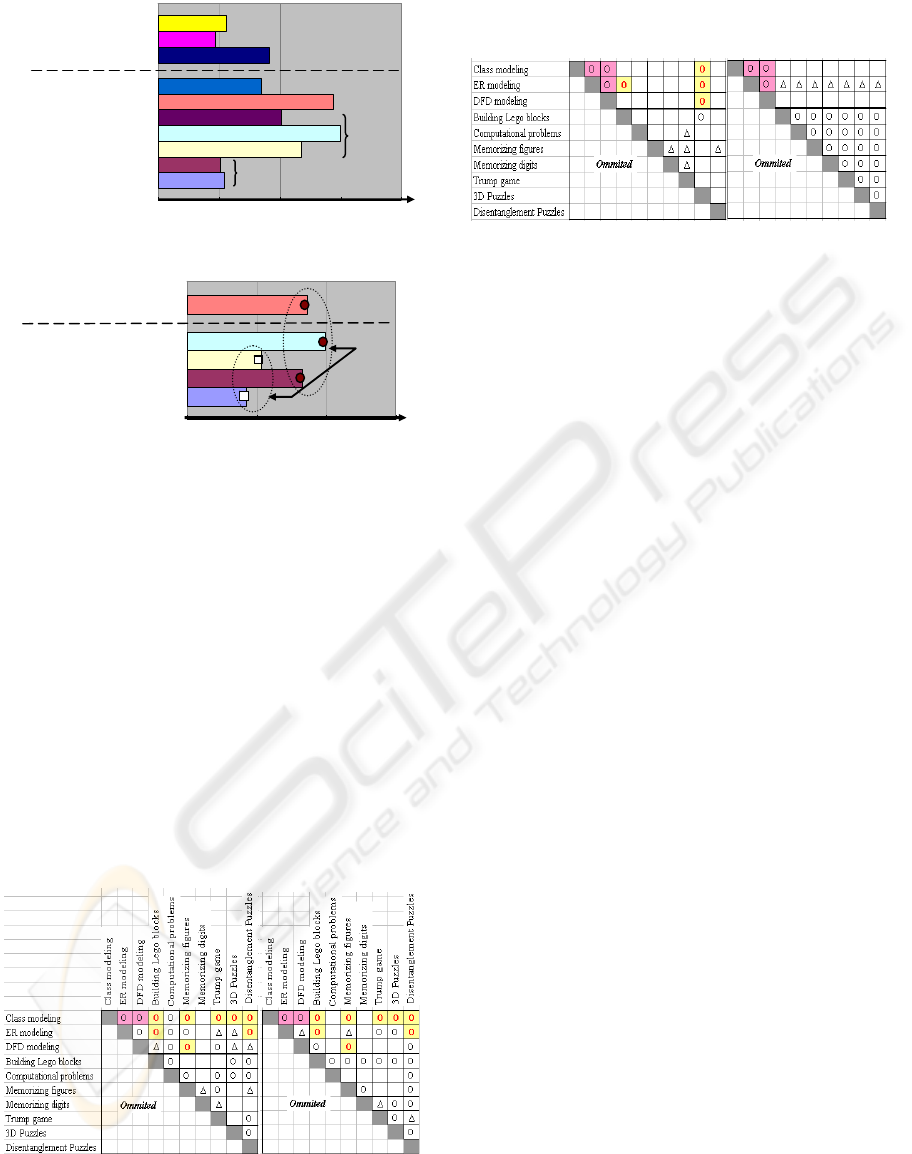
0 5 10 15 20×10-3
Classmodeling
ERmodeling
DFDmodeling
BuildingLegoblocks
Com
p
utational
p
roblems
Memorizingfigures
Memorizingdigits
Trumpgame
3DPuzzles
DisentanglementPuzzles
Totalworkvolume
Figure 7: Total work volume of Examiee1 per task.
0
0.5 1 1.5
SoftwareAnalysis
Plangeneration&refinement
SimpleCalculation
Memorizing
Trialanderror
Totalworkvolume
Significan
t
difference
Figure 8: Total work volume per task category.
sis tasks (the significance level is 0.5 % or less). In
order to enhance the visibility of correlation for each
combination of all actual tasks, Tables from 1 to 4
summarize the frequency in which a significant
correlation is found for each examinee (hereinafter
referred to as "correlation state table"). For the
correlation between a work unit and an analysis task,
a cell with ○ indicates that the frequency in which a
significant correlation is found with a risk rate of
0.5 % is 75 % or more and a cell with Δ indicates
that a correlation is found but its frequency is 75 %
or less. A cell with no symbol indicates that no
correlation is found.
bl f i
With higher business ability
tbl f
i 3
With lower business ability
5 ANALYSIS AND
CONSIDERATION
The analysis results described in the previous
chapter lead to the following conclusion.
(1) Definition of the total work volume.
Comparing with brain physiology studies that
show that the prefrontal cortex is the region to
control planning, it is a natural result that several
differences are observed between the tasks for
building or analyzing Lego blocks that correspond to
"plan generation and refinement", memory and
reproduction and the other tasks, such as trial-and-
errors, calculation, etc., since the target area of
measurement is the prefrontal area. We can conclude
that the definitions of "Equations of Brain Work
Energy" are indirectly proved, because the same
result has been acquired from our approach in which
the work volume is defined based on the
acceleration rate of change in oxygen consumption
volume, as the study results in the brain physiology
area(Akio Nakai et al., 2003).
(2) About the state of correlation between work
units.
With regard to the correlation between work
units, no regularity is found both for the examinees
with higher business ability and those with lower
business ability. The fact that no correlation is found
between the work units results in the conclusion that
each work unit is not corresponding to a single brain
work unit or brain work units are not mutually
independent. However, we don't dismiss the
hypothesis that a specific brain work unit
corresponds to a work unit and will continue to
verify it in our future measurement experiment.
(3) Relationship between business ability and total
work volume.
No significant statistical correlation is found
either between the business ability of analysis task
shown in Figure 6 and the total work volume or
between the business ability of each examinee
Table 1: Correlation state
table of examinee 1.
Table 2: Correlation state
table of examinee 2.
Table 3: Correlation state
table of examinee 3.
Table 4: Correlation state
table of examinee 4
BRAIN PHYSIOLOGICAL CHARACTERISTIC ANALYSIS FOR SOFTWARE ANALYSIS SUPPORT
ENVIRONMENTS
335

shown in Figure 8 and the total work volume. That
is, an examinee with higher business ability does not
necessarily perform a large total work volume. An
examinee performing a large total work volume does
not necessarily have high business ability. As
described in (1), an examinee who frequently
switches between concentration and relaxation in
his/her brain work shows a larger total work volume,
since the work volume is defined based on the
acceleration rate of change of oxygen consumption
volume. Therefore, it is a natural that the total has no
direct correlation with business ability.
(4) Correlation between analysis task and work unit.
One of the important perceptions we got during
this study is the fact that brain work varies
depending on individuals beyond our expectation.
As shown in Figures 1 to 4, which show the
correlation between the work units and tasks such as
data flow analysis, ER analysis, class analysis and
design, actual correlations greatly vary depending on
the examinees. The following describes the
comparison results of correlations between analysis
tasks and work units.
●Characteristics of examinee group with higher
business ability
1) For all analysis tasks, strong correlations are
found for the work units corresponding to "memory
of figures" and "plan generation and refinement."
This fact gave us an understanding that all analysis
tasks are deeply related to the brain work for
"memory and reproduction of analyzed figures" and
"plan generation and refinement."
2) Data flow analysis has a low correlation with
the work unit of trial and error. Since data flow
analysis mainly includes descriptions of business
flow, there are only few trial-and-error factors unlike
ER analysis or class analysis.
●Characteristics of examinee group with lower
business ability
The following two characteristics were observed
although it was difficult to derive a significant
conclusion since the measurement data of this group
has lower reliability.
1) All analysis tasks have a higher correlation
with three dimensional puzzles. That is, they
performed analysis tasks through the brain work of
trial-and-error type similar to the brain work of three
dimensional puzzles.
2)
Only the ER modeling task has a weak
correlation with all work units, or a strong
correlation with the "plan generation and
refinement." This fact can be understood that the
advantage of training in the class in which the
judgment rules of analysis were clearly specified
appeared only in the ER modeling task. That is, it
can be understood that giving judgment rules
converted the ER modeling task to the brain work of
"plan generation and refinement" similar to the Logo
block building task.
6 NEW CHALLENGES
In this measurement experiment and analysis, the
correlation between analysis tasks and work units is
clarified to certain extend, whereas the correlation
among work units is not found. From the statistical
viewpoint, our analysis results are not sufficient to
form a conclusion. However, our study shows the
possibility to represent an analysis task as a
superposition of unit works. On the other hand, the
fact that no correlation is found among work units
indicates that a new model is to be developed for
brain work. For example, there is a possibility that a
work unit is composed of several fundamental brain
work elements.
On the other hand, clarifying the composition of
an analysis task with regard to work units as its
components may have an impact to the functionality
of the future analysis support environment. The
following lists the functions that are to be supported
by the environment:
●When the ratio of the work units based on trail-
and-error is high:
Preparing a wizard or a help function will be
effective to support refinement of an analysis pattern
as a plan.
●When the ratio of the work units centering around
memory and reproduction is high:
It will be effective to prepare a search function
for an analysis pattern that matches with the
specification to be analyzed and designed.
●When the ratio of the work units centering around
plan generation and refinement is high:
Several effective functions may be prepared,
including selection of applicable analysis patterns,
identifying the backtrack point used when a defect is
found during application, or offering a specific
countermeasure in the case of backtracking.
●When the ratio of the work units for simple
calculation is high:
Although required functions vary depending on
the analysis target, the advice function for the
connectivity of relationship may be effective for ER
modeling and the integrity validation function for
input/output data between layers may be effective
for data flow analysis.
ICEIS 2009 - International Conference on Enterprise Information Systems
336

7 CONCLUSIONS
The research on developing the analysis task support
environments based on the brain physiology studies
has just begun and a lot of subjects are left for
investigation. In the future, various studies will be
performed on the high level work model by
researchers in various fields and the results will have
impacts on the design of software analysis support
environment.
REFERENCES
Martin Fowler., (1997),Analysis Patterns Reusable Object
Models., Addison-Wesley
Hitachi Medical Co.,Ltd, Principle of Optical Topography
System,
http://www.hitachi-medical.co.jp/info/opt/index.html
Chandrasekaran, B & Johnson, T. R. (1993), Generic tasks
and task structures: History, critique and new
directions, Second Generation Expert Systems
(pp.232-272). Berlin,Springer-Verlag.
Atsushi Maki, Marcela Pena, Ghislaine Dehaene-
Lambertz, Jacques Mehler, Hideaki Koizumi(2004),
Brain-function measurement using near-infrared
topography on neonates, Human Brain Mapping 2004
BRAIN PHYSIOLOGICAL CHARACTERISTIC ANALYSIS FOR SOFTWARE ANALYSIS SUPPORT
ENVIRONMENTS
337
