
A MINING FRAMEWORK TO DETECT NON-TECHNICAL LOSSES
IN POWER UTILITIES
F
´
elix Biscarri, I
˜
nigo Monedero, Carlos Le
´
on, Juan I. Guerrero
Department of Electronic Technology, University of Seville, C/ Virgen de Africa, 7, 41011 Sevilla, Spain
Jes
´
us Biscarri, Roc
´
ıo Mill
´
an
ENDESA Distribuci
´
on, Avda. de la Borbolla, S/N, 41092 Sevilla, Spain
Keywords:
Data mining, Power utilities, Fraud detection, Non-technical losses.
Abstract:
This paper deals with the characterization of customers in power companies in order to detect consumption
Non-Technical Losses (NTL). A new framework is presented, to find relevant knowledge about the particular
characteristics of the electric power customers. The authors uses two innovative statistical estimators to weigh
variability and trend of the customer consumption. The final classification model is presented by a rule set,
based on discovering association rules in the data. The work is illustrated by a case study considering a real
data base.
1 INTRODUCTION
In the electricity sector, non-technical losses (NTL)
of the utility are all of losses except the technical
losses (result of the effect of the power dissipation
in the electrical network components such as trans-
mission lines, power transformers, measurements sys-
tems, etc.). For the electrical distribution business,
minimizing NTL is a very important activity because
it has a high impact in the company profits. Normally,
we will refer in this paper as fraud detection but we
could strictly talk about NTL. In Spain, the percent
of fraud in terms of energy with respect to the total
NTLs round about 35%-45%.
Not too many authors offer an estimation about
these losses. Yap et al (K.S.Yap et al., 2007) estimate
distribution losses as 15%, in Sabah State, Malaysia.
J.R. Filho et al, (Filho and als, 2004) expose a fraud
identification per number of in-situ inspection per-
centage as low as 5%, in Brasil. This rate varies about
5%-10%, according J.E. Cabral et al (Cabral et al.,
2004) (Cabral et al., 2006).
The goal of this reseach is to significativaly im-
prove the inspection success and the profitability
rate, highly dependent of the cluster of customers
researched, i.e, of the set of features that made the
cluster and the class of customers researched (do-
mestic customers, medium or high consumption cus-
tomers,. . . ). The main difficulty is the low rate of
NTL’s in the Power Companies (Cabral et al., 2006).
Besides, in the companies and/or areas with very low
percentages of losses, from 1% to %2, it is inefficient
policy to reduce these losses if the companies do not
identify them by some way. The enormous cost of in-
specting in-situ many customers does not compensate
the return of the energy recovered in a few of them.
That’s why Endesa is investing in this research, ex-
ploiting its databases to identify customers with non
invoiced energy in a profitable way. So the number of
inspections is reduced only to a small group of cus-
tomers identified as anomalous, with an energy con-
sumption suspicious of being different of the amount
invoiced, because some company error or customer
fraud. As seen below, potential anomalous high con-
sumption customers can be identified by: abrust and
negative changes in their historical consumption pat-
tern (a 30% drop, for example, as see in (Cabral et al.,
2008)), changes in the consumption pattern compared
with changes to the other consumers from the same
cluster at the same time (changes detected in the vari-
ability on electric consumption (Biscarri et al., 2008))
and others non-obvious features, as previous fraudu-
lent activities or anomalous and unstable power factor
(Sforna, 2000).
Many researches have been published, from the
90s to the present day, about our main research topic:
96
Biscarri F., Monedero I., León C., Guerrero J., Biscarri J. and Millán R. (2009).
A MINING FRAMEWORK TO DETECT NON-TECHNICAL LOSSES IN POWER UTILITIES.
In Proceedings of the 11th International Conference on Enterprise Information Systems - Artificial Intelligence and Decision Support Systems, pages
97-102
DOI: 10.5220/0001953300970102
Copyright
c
SciTePress

”NTL detection in electricity consumers”, and specif-
ically ”fraud detection in electricity consumers”.
In 1998, J.R. Galv
´
an et al (Galv
´
an et al., 1998)
presented a methodology to guide inspection cam-
paigns by the characterisation of the temporal evolu-
tion of consumption features of the customers. They
used a non supervised classification method: the
study of a probability density function (pdf) estimator
on some electrical features. Not result of real inspec-
tions after the study are done.
In 2000, M. Sforna (Sforna, 2000) reported a data
mining system based on the application of statistics to
aggregate values, calculate new meaningful variables
and the application of a self-organizing Kohonen map
of customers behavior patterns. Results are summa-
rized in terms of automatic identification of anoma-
lous consumption values, according the hours of us-
age of the contracted active demand, reactive demand
or monthly power factor.
In 2002, R. Jiang et al (Jiang et al., 2002) pro-
posed an analysis to identify fraud in Australian elec-
tricity distribution networks using wavelet techniques
and combining multiple classifiers. They exposed that
the classification accuracy reached 70% on the testing
data set, with a high number of data profiles (about
1200) and using a relative small amount of data.
In 2004, J. Reis et al (Filho and als, 2004) used a
decision tree and a database composed by 5 monthly
features, with customers that had undergone inspec-
tion in the last year, classified into normal, fraud or
faulty equipment. They expounded a 40% right fraud
classification rate.
In 2004 and 2006, Jos
´
e E. Cabral et al (Cabral
et al., 2004) (Cabral et al., 2006) proposed an ap-
plication that used rough sets to classify categorical
attributes values in order to detect fraud of electrical
energy consumers. The system reached a fraud right-
ness rate of around 20%.
In 2008, Jos
´
e E. Cabral and Joao P. Pinto (Cabral
et al., 2008) have studied high voltage consumers us-
ing Self-Organizing Maps (SOM) and a 15 minutes
consumption period sample. They are still waiting
confirmation of suspicions effectively confirmed as
fraud for the real inspection in-situ.
And at last, authors of this paper have presented
a work highlighting the importance of the variabil-
ity of the customer consumption in NTLs detection
in power utility companies (Biscarri et al., 2008). A
lodging sector customers example are shown, with
35 customers proposed to be inspected ’in-situ’ by
the automatic detection system, 15 of them inspected
by the Endesa staff and 8 of these 15 classified
as ’anomalous’, fraudulent or with faulty measuring
equipment.
2 CUSTOMER
CHARACTERIZATION
The propossed study process structure is fragmented
into different steps with different degrees of complex-
ity and different periods of time.
2.1 Data Selection
The customers selected for the mining process have
been choosen based on the following feature charac-
terization:
• Period of time of recorded invoices: We use
monthly and bimonthly invoices belonging to the
sample of customers. Hourly or daily data are not
available.
• Geographical localization: All customers are lo-
cated in a Spanish region.
• Contractual power: All customers belong to price
code 4.0 and price code 3.0.2. These codes mean
these customers consume more than 15 KW dur-
ing more than 8 hours per day.
• Economic Activity Classification (CNAE). Some
economic sectors historically present a high rate
of NTLs. The research is centered in these sectors.
• Consumption range. At first, the target of research
is to cover the greater range of electrical consump-
tion as possible. But customers can only be com-
pared, or studied together, if they have a similar
range of consumption. The solution of the prob-
lem is to divide the full consumption range into
subsets, obtaining subsamples of customers with
similar characteristics. Each of these subsamples
will be studied independently. For the purpose of
this work, the continuous value of the customer
consumption is sectioned in 10 bins.
• History of customer inspection. Methods used
in NTLs detection can be mainly classified into
supervised and unsupervised methods. Unsuper-
vised approach allows the discovery of natural
patterns in data, detected or not detected before.
For this reason, initially of our research, we have
used an unsupervised approach, based on Koho-
nen Maps and the statistical outlier detection as
a classification methods. But the verification of
the results have been really expensive and time
consuming. In order to obtain a statistic of the
NTLs right classified rate, all the suspected cus-
tomers should be inspected ’in situ’ by the En-
desa staff. The results can be interpreted in a
very biased way, because often it is not possible
to check all the clusters discovered several times.
A MINING FRAMEWORK TO DETECT NON-TECHNICAL LOSSES IN POWER UTILITIES
97

The improvement of the methodology was highly
depending of the success of this inspections.
The supervised approach is an interesting work-
ing method if we have a very large database to
cover many of the NTL cases. The results can be
quickly and systematically checked. And, as we
have said, we can concentrate our efforts toward
cluster of customers with a high rate of historical
NTLs.
2.2 Data Preprocessing
With respect to data cleaning, the authors avoid reject-
ing any data from a set. However, customers with less
than 6 monthly register per year were eliminated and
also customers who had negative values on consump-
tion attributes. On the other hand, reflection exercise
about lecture consumption data and billed consump-
tion data are necessary. Normally, the consumption
billed is the result of consumption read, but it is not
always true. If the company has no access to read
the data, and there is no doubt of a consumption has
been made, company experts estimate the actual con-
sumption, based on the recent historical consumption.
Several and continuous differences between read data
and billed data show abnormal behavior. The study
and the use of statistical estimator based on read data
is a new contribution of this paper regarding works
cited in the bibliographical review. In this sense, a
filling up of missing values has been performed.
2.3 Data Mining Techniques.
Descriptive Data Mining
We describe three descriptive techniques: one based
on the variability of customer consumption, another
based on the consumption trend and a third one that
summarizes other feature contributions to NTL detec-
tion.
2.3.1 The Variability Analysis
We propose in this section an algorithm that empha-
sizes customers with a high variability of monthly
consumption respect to other customers of similar
characteristics.
The classic approach to the study of the variability
classifies data in ’normal data’ and outliers. Outliers,
with regard to consumption feature, can be caused by
measurement error or by fraud in customer consump-
tion. But, alternatively, outliers may be the result of
inherent data variability. Thus, outliers detection and
analysis is an interesting data mining task. The main
objective is the estimation of the variance data (or the
standard deviation estimation, STD), from a sample.
The research presented in this paper present three
main differences regarding the classic approach:
1. The estimation of the STD, main task of the vari-
ability analysis, is performed in a non classical
way. We use a preprocessed sample in which
there are no interactions present between time and
space. The temporary component and the local
geographical location component have been fil-
tered.
2. Consumptions for a group of customers are com-
pared against their group signature to determine if
the behavior of an individual customer is anoma-
lous. In classic research, new consumption for
a customer is compared against their individual
signature to determine if the user’s behavior has
changed.
3. The classic approach classifies data into ’normal
data’ and outliers. In order to classify data, a cen-
ter line (CL), the average of the STDs, is esti-
mated. Also an upper control limit (UCL) and a
lower control limit (LCL) are estimated. In clas-
sical way, thresholds of STD (LCL and UCL) are
estimated by the mean of STD multiplied by a
constant (usually, 1.96 is used, corresponding to a
level of significance σ = 0.05). Data outside con-
trol limits are classified as outliers. We don’t use
the estimated STD to obtain outliers and directly
propose them to be inspected by the Endesa staff.
We do not establish any control limits. We sim-
ply add to each customer a new feature, referred
to the estimated ST D, that will be used as an input
for a supervised detection method, showed in the
Predictive Data Mining Section.
The sample is previously divided in 10 bins ac-
cording the yearly consumption feature. Each bin will
be studied independently. Once the ST D
∆
l
is esti-
mated (the standard deviation associate with each cus-
tomer with regard to the rest of customers and without
inherent variability), the following variability estima-
tor is defined:
ES variability
l
=
ST D
∆
l
−CL
i
CL
i
Where ES variability is a new customer estimated
feature, dependent of the customer, l, and also depent
of his the yearly consumption bin, i. CL
i
is the center
line refering to bin i.
To maintain the shape of the variability diagrams
and compare the diagrams among them, in consump-
tion pattern terms, each diagram can be normalized.
ICEIS 2009 - International Conference on Enterprise Information Systems
98
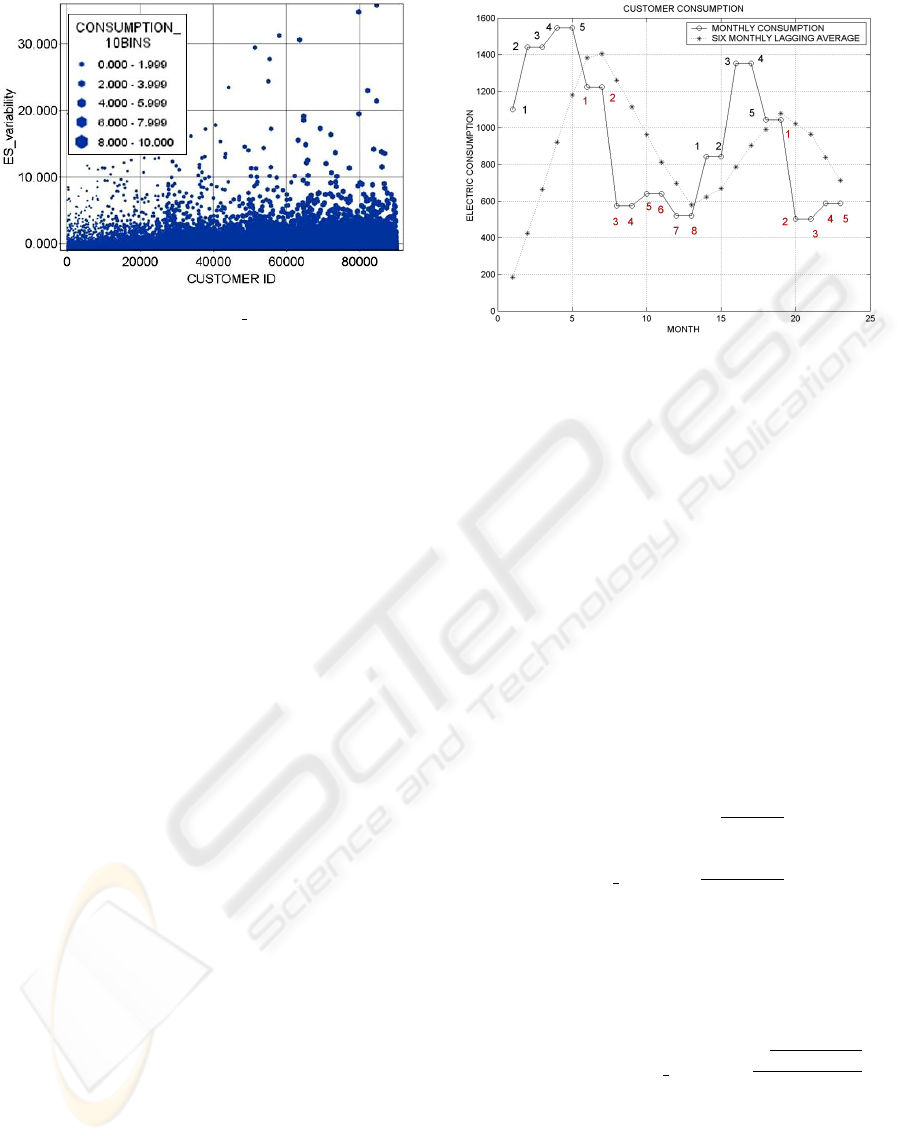
Figure 1: 10-BINS ES variability.
We use the CL of each bin (CL
i
) to normalize the sam-
ple. Figure 1 shows the evolution of this estimator
through the whole sample studied, through all bins.
The advantages of the proposed algorithm with re-
spect to recent studies are:
• The elimination (or, at least, reduction) of the tem-
porary component and the local geographical lo-
cation component of the customer consumption.
• The study of the comparative consumption among
clients of similar characteristics.
• The use of the ST D
∆
l
estimated as an input to a
classification model.
2.3.2 The Consumption Trend. A Streak based
Algorithm
Streaks of past outcomes (or measurements), for ex-
ample of gains or losses in the stocks market, are one
source of information for a decision maker trying to
predict the next outcome (or measurement) in the se-
ries. The discovery of the theoretical consumption
model is not the target of this paper. This model is
strongly dependent of the cluster of customers con-
sidered and highly changeable amongst different clus-
ters. But it is very interesting the study of the in-
dividual trend consumption and also the comparative
among trends of customer with similar characteristics.
There are several ways to measure this feature. We
show a simple and useful algorithm, based on the six-
month lagging moving average of customer consump-
tion, described subsequently:
1. The input data are, for each customer from each
cluster, 24 monthly consumptions, billed data.
The cluster characterization is described in the
Data Selection Section of this paper.
2. We calculated the six-month simple moving aver-
age, for each customer consumption.
Figure 2: Consumption Trend. Customer with long and few
streaks.
3. We counted how many times the consumption line
is over the mean line (positive streaks, po
s
) and
how many times the consumption line was below
the mean line (negative streaks, ne
s
). The whole
number of streaks is
Ns = po
s
+ ne
s
.
The proposed algorithm does not distinguish pos-
itive from negative streaks. It simply count
its. Also the number of measurements in each
streak (n
j
) is registered. The number of streaks
for each customer offers interesting information
about their consumption behavior but it is also in-
teresting to know the weight of each streak.
4. Finally, we sum up all the information in one
cuadratic estimator:
ES streak
l
=
s
Ns
∑
t=1
(n
t
)
2
Ns
Where l is the customer identifier, Ns is the num-
ber of streaks of this customer and n
t
is the num-
ber of measurements of the streak t.
Figure 2 shows the consumption behavior of a par-
ticular customer (Ns = 4). The number of measure-
ments in each streak are also counted (n
1
= 5, n
2
= 8,
n
3
= 5 and n
4
= 5). ES streak
l
=
√
5
2
+8
2
+5
2
+5
2
4
=
0.90. The estimator summarizes and models the trend
behavior.
2.3.3 Other Features
There are some feature levels or some feature rela-
tions quite serious with reference to NTLs detection.
We describe some of them used in our framework:
A MINING FRAMEWORK TO DETECT NON-TECHNICAL LOSSES IN POWER UTILITIES
99

• The hours of consumption at maximum con-
tracted power (HMP). It is the rate between
the contracted power (CP) and the daily con-
sumption (DC). For example, if CP=15 KW and
DC=150KWh then HMP=10 hours.
• Minimum and maximum values of consumption
in different time zones of the day. In some tariffs,
the day is divided into different time zones with
different rates. Our sample is divided into three
zones: cheap (zone 1), normal (zone 2), expen-
sive (zone 3). Suspect fraudulent customers have
relatively very low consumption in normal and ex-
pensive time zones.
• The number of valid consumption lectures (NL).
Usually, when there is not a valid lecture value
and the company is sure that consumption existed,
the consumption is estimated and billed.
2.4 Data Mining Techniques. Predictive
Data Mining
The major goal of the predictive module is the infer-
ence of a rule set to characterize each of two following
classes: ’normal’ customer or ’anomalous’ customer.
We characterized each consumer by means of the at-
tributes described in the last section.
The predictive (or classification) model uses su-
pervised learning. Main attributes in NTL detection
are:
• ES variability: The proposed variability estima-
tor, calculated from invoices (ES variability i) or
from lectures (ES variability l).
• ES streak i: The proposed consumption trend es-
timator, calculated from invoices (ES streak i) or
from lectures (ES streak l).
• HMP i: The hours of consumption at maximum
contracted power, to refer to the time zone i (i =
{
1, 2, 3
}
).
• Maximum i: The maximum value of consump-
tion, in KWH, in time zone i (i =
{
1, 2, 3
}
).
• Minimum i: The minimum value of consumption,
in KWH, in time zone i (i =
{
1, 2, 3
}
).
• NL: The number of valid consumption lectures in
the period of study (NL =
{
1, 2, . . . , 24
}
).
A feature named ’suspect’ are added. if ’sus-
pect’=1, the customer had a non technical loss during
the period of study. We should clarify that our exper-
iment refers to real cases, including more than 10000
customers, and the available database has a signifi-
cant limitation: although ’suspect’=0, it is possible
that the customer had a non detected NTL. As often
Table 1: Description of the Rules.
Model Rule Description
GRI R1 ES variability i>0.95
and ES streak l>2.13
and HMP 1>0 and NL<12
and Maximum 3>490
GRI R2 Maximum 2>63400
and Minimum 3<2400
Table 2: Rule Set for NTL Detection.
IF CUSTOMERS ∈ (SAMPLE1∩R1) THEN ’SUSPECT’
IF CUSTOMERS ∈ (SAMPLE1∩(R1∪R2)) THEN ’SUSPECT’
occurs in power companies, it is not very realistic to
assume that all the customers from a large sample are
inspected.
The classification algorithm use the Generalized
Rule Induction (GRI) model. The GRI model dis-
covers association rules in the data. The advantage
of association rule algorithm over the more standard
decision tree algorithms is that associations can exist
between any of the attributes. A decision tree algo-
rithm GRI extracts rules with the highest information
content based on an index that takes both the gener-
ality (support) and accuracy (confidence) of rules into
account. GRI can handle numeric and categorical in-
puts, but the target must be categorical: ’suspect’∈
{
0;1
}
.
Table 1 shows the description of the obtained
rules. Table 2 shows the application of the rule set.
The structure of this classification module is the
following: the full sample studied is composed by
10279 customers, 188 of them with detected NTL in
the period of study (feature ’suspect’=1) and 10091
’normal’ or not detected, with ’suspect’=0. First, Rule
1 applies to 102 customers, 78 of them classified with
’suspect’=0 and 24 with ’suspect’=1. Customers in-
cluded in Rule 1 are removed to the rest of the sam-
ple.
The remaining sample is made up of from 10177
customers, 164 of them with detected NTLs in the
period of study (feature ’suspect’=1) and 10013 with
’suspect’=0. Rule 2 applies to 117 customers, 103
of them classified as ’suspect’=0 and 14 with ’sus-
pect’=1.
The test of the set of rules generates four val-
ues, according to the following classifications (Cabral
et al., 2006):
i) True positives (TP): quantity of test registers cor-
rectly classified as fraudulent.
ii) False positives (FP): quantity of test registers
falsely classified as fraudulent.
Table 3 summarizes the described test and adds
ICEIS 2009 - International Conference on Enterprise Information Systems
100

Table 3: Test of the Set of Rules.
Rule Support Confidence TP FP
R1 1.0% 23.5% 24 78
R1∪R2 2.1% 17.3% 38 181
support and confidence data.
The model evaluation is performed using ten-fold
cross validation (Witthen and Frank, 2000). This
kind of evaluation was selected to train the algorithms
using the entire data set and obtain a more precise
model. This will increase the computational effort but
improves the model’s capacity for generating differ-
ent data sets. The evaluation is performed by splitting
the initial sample in 10 sub-samples in order to fill
consumption range. The model is trained using 9/10
of the data set and tested with the 1/10 left. This is
performed 10 times on different training sets and fi-
nally the ten estimated errors are averaged to yield an
overall error estimate. The overall accuracy obtained
is around 80%.
3 CONCLUSIONS
This classification results can be interpreted in a prac-
tical way. This classification can be used to assign
new customers to existing classes and/or to inspect
customers that had not been previously inspected but
that belong to a class with a high rate of historical
NTL. In this last sense, Endesa staff action is required.
The Endesa staff, due to the extremely high cost
of the in-situ inspection for this class of customers,
usually only revises and inspects small samples (a
hundred or so medium-high consumption customers).
The quality of this framework is illustrated by a case
study that uses a real database. Only 188 of 10279
customers (less than 2%) of the selected registers
for mining present results of NTLs inspect. Regar-
less of the difficulty to study real data instead of
simulated data, rate of correct fraud identification
(about 20%) significatively improved previous com-
pany detection campaigns, refering to medium-high
consumption customers.
ACKNOWLEDGEMENTS
The authors would like to thank the Endesa Company
for providing the funds for this project (since 2005).
The authors are also indebted to the following col-
leagues for their valuable assistance in the project:
Gema Tejedor, Miguel Angel L
´
opez and Francisco
Godoy. Special thanks to Juan Ignacio Cuesta, Tom
´
as
Blazquez and Jes
´
us Ochoa for their help and cooper-
ation to extract the data from Endesa.
REFERENCES
Biscarri, F., Monedero, I., Le
´
on, C., Guerrero, J., Bis-
carri, J., and Mill
´
an, R. (June 12-16, Barcelona, Spain,
2008). A data mining method based on the variabil-
ity of the customers consumption. In 10th Interna-
tional conference on Enterprise Information Systems
ICEIS2008.
Cabral, J., Pinto, J., Gontijo, E. M., and Reis, J. (2004).
Fraud detection in electrical energy consumers using
rough sets. In 2004 IEEE International Conference on
Systems, Man and Cybernetics. IEEE press.
Cabral, J., Pinto, J., Linares, K., and Pinto, A. (2006).
Methodology for fraud detection using rough sets.
In 2006 IEEE International Conference on Granular
Computing. IEEE press.
Cabral, J., Pinto, J., Martins, E., and Pinto, A. (April 21-
24, 2008). Fraud detection in high voltage electric-
ity consumers using data mining. In IEEE Trans-
mision and Distribution Conference and Exposition
T&D. IEEE/PES.
Filho, J. and als (The Hague, The Netherlands, 2004.).
Fraud identification in electricity company costumers
using decision tree. In IEEE International Conference
on Systems, Man and Cibernetics. IEEE/PES.
Galv
´
an, J., Elices, E., noz, A. M., Czernichow, T., and Sanz-
Bobi, M. (Nov. 2-6, 1998). System for detection of
abnormalities and fraud in customer consumption. In
12th Conference on Electric Power Supply Industry.
IEEE/PES.
Jiang, R., Tagiris, H., Lachsz, A., and Jeffrey, M. (Oct. 6-10,
2002). Wavelet based features extraction and multi-
ple classifiers for electricity fraud detection. In Trans-
mission and Distribution Conference and Exhibition
2002: Asia pacific. IEEE/PES.
K.S.Yap, Hussien, Z., and Mohamad, A. (April 2-4, Phuket,
Thailand, 2007). Abnormalities and fraud electric me-
ter detection using hybrid support vector machine and
genetic algorithm. In Proceeding of the Third IASTED
International Conference Advances in Computer Sci-
ence and Technology. IASTED PRESS.
Sforna, M. (England, 2000). Data mining in power com-
pany customer database. In Electric Power Systems
Reseach, 55, 201-209. Elsevier Press.
Witthen, I. and Frank, E. (2000). Data Mining–Practical
Machine Learning Tools and Techniques with Java
Implementations. Morgan Kaufmann, Academic
Press, New York and San Mateo, CA.
A MINING FRAMEWORK TO DETECT NON-TECHNICAL LOSSES IN POWER UTILITIES
101
