
AUTOMATIC DETECTION OF DUPLICATED ATTRIBUTES
IN ONTOLOGY
Irina Astrova
Institute of Cybernetics, Tallinn University of Technology, Akadeemia tee 21, 12618 Tallinn, Estonia
Arne Koschel
Department of Computer Science, Faculty IV, University of Applied Sciences and Arts
Ricklinger Stadtweg 120, 30459 Hannover, Germany
Keywords: Ontology-based data integration, Duplicated attributes, Context-based similarity, Market basket analysis,
ICD algorithm.
Abstract: Semantic heterogeneity is the ambiguous interpretation of terms describing the meaning of data in
heterogeneous data sources such as databases. This is a well-known problem in data integration. A recent
solution to this problem is to use ontologies, which is called ontology-based data integration. However,
ontologies can contain duplicated attributes, which can lead to improper integration results. This paper
proposes a novel approach that analyzes a workload of queries over an ontology to automatically calculate
(semantic) distances between attributes, which are then used for duplicate detection.
1 INTRODUCTION
Consider a user who submits the following query
against the Wikipedia infobox ontology (Wu and
Weld, 2008): “Which performers were born in
Chicago?” In response to this query, the query-
answering system will return only one result (viz.
Michael Ian Black). However, if it were known that
actor and comedian are subclasses of performer and
that their attributes birthplace, birth place, city of
birth, place of birth and origin are duplicates of
performer’s location, the query-answering system
could return 163 additional results. Thus, the recall
of query results can be greatly improved by
detecting duplicated attributes.
Duplicate detection may be manual, automatic,
or both. Traditionally, duplicate detection was
performed by humans (e.g. a domain expert or a
user): “Humans do it better” (Eyal et al., 2005).
Many ontology languages provide the means to
specify the duplication of attributes. E.g. OWL
(OWL, 2004) has a construct sameAs. However,
manual duplicate detection tends to be slow, tedious
and inefficient, and does not work on a large scale.
Therefore, there is a need for automatic duplicate
detection.
2 RELATED WORK
Most reseach focuses on identifying similar
attributes, with some research devoted to detecting
duplicates.
Over the past two decades, researchers in both
academy and industry have proposed various
approaches to identifying similar attributes. These
approaches can be categorized as:
1. Term-based (or linguistic) approach
where two attributes are considered to be
similar if their names (i.e. terms) are
similar (Eyal et al., 2005; Ehrig et al.,
2004).
2. Value-based (or extensional) approach
where two attributes are considered to be
similar if their values are similar (Eyal et
al., 2005; Ehrig et al., 2004).
3. Structure-based (or taxonomic)
approach where two attributes are
considered to be similar if their structures
(i.e. taxonomies) are similar (Eyal et al.,
2005; Ehrig et al., 2004).
283
Astrova I. and Koschel A. (2009).
AUTOMATIC DETECTION OF DUPLICATED ATTRIBUTES IN ONTOLOGY.
In Proceedings of the 11th International Conference on Enterprise Information Systems - Databases and Information Systems Integration, pages
283-286
DOI: 10.5220/0001961102830286
Copyright
c
SciTePress

4. Context-based approach where two
attributes are considered to be similar if
their contexts are similar (Ehrig et al.,
2004).
5. Hybrid approach that combines two or
more approaches from the first four
categories to minimize false positives (i.e.
dissimilar attributes that appear similar) and
false negatives (i.e. similar attributes that
appear dissimilar) (Eyal et al., 2005; Ehrig
et al., 2004).
These approaches can also be used for detecting
duplicated (i.e. very similar) attributes. However, the
term-based approach can incur problems in
situations where the same terms are used to name
dissimilar attributes (i.e. homonyms) or where
different terms are used to name similar attributes
(i.e. synonyms). The value-based approach can
incur problems in situations where similar attributes
have no or few common values or where dissimilar
attributes have many common values. The
structure-based approach can incur problems in
situations where similar attributes are not organized
in the taxonomy or where the taxonomy is shallow.
These problems could be solved by domain
experts. However, they are often not available. In
such situations, duplicated attributes could be
detected by analyzing information on the past user
interaction with the ontology. This information may
be in the form of workload of queries or edit history.
(Wu and Weld, 2008) proposed to record a
history of changes made to the ontology and analyze
this information to detect duplicates. E.g. there can
be attributes in a class that are frequently renamed.
Or their values can be copied to one and the same
attribute in another class. Such an edit history points
to evidence that these attributes are duplicates.
However, edit history must be recorded for a long
time to minimize false positives and false negatives.
3 OUR APPROACH
Since terms, values and structures are not sufficient
criteria for identifying similar attributes, we decide
to use the context-based approach where two
attributes are considered to be similar if their
contexts are similar.
The main problem with this approach is how to
identify similar contexts. We address this problem
by adopting a similarity measure from market basket
analysis.
3.1 Market Basket Analysis
Market baskets are the sets of products bought
together by customers in transactions. These may be
the results of customer visits to the supermarket or
customer online purchases in a virtual store.
Typically, market baskets are represented as a binary
matrix where rows correspond to transactions and
columns to products. A row has a value of 1 for a
column if the customer has bought the product in the
transaction; otherwise, it is 0. The number of
products and their price are ignored.
One of the most popular tasks of market basket
analysis is to reveal customer buying patterns. These
patterns can be used to identify similar products.
Consider Coke and Pepsi. These two products
appear dissimilar because they have few customers
in common. However, it was observed that the
customers of Coke and Pepsi bought many other
products in common such as hamburgers,
cheeseburgers, pizzas and chips. Based on this
observation, (Das and Mannila, 2000) defined the
following similarity measure for products: two
products are considered to be similar if the buying
patterns of their customers are similar.
We adapt this similarity measure to attributes:
two attributes are considered to be similar if the
querying patterns of their users are similar. E.g. if it
were known that there are many users who have
asked about the birth place of actor together with the
actor’s name and birth date, and that there are many
users who have asked about the origin of actor,
again, together with the actor’s name and birth date,
we could conclude that attributes birth place and
origin in a class actor are similar to each other.
User querying patterns (i.e. contexts) are
revealed by analyzing a workload of queries asked
by users against the ontology. In the example above,
many users tend to ask about actor’s name and birth
date.
3.2 Assumptions
We assume that users do not ask about all attributes
in the ontology at once. (This is by analogy with
market basket analysis, which assumes that a market
basket contains a small set of products from
hundreds or thousands of products available in the
supermarket or virtual store.) In the example above,
the users have not asked about actor’s nationality
and marital status. These are called missing
attributes.
In addition, we assume that users understand the
ontology well enough to submit queries that reveal
ICEIS 2009 - International Conference on Enterprise Information Systems
284

the similarity between attributes. Or the users
intuitively know if the attributes are similar. E.g.
there can be several recent queries in the workload
by a certain user who may repeatedly ask about
actor’s birthplace, birth place, city of birth, place of
birth and origin.
3.3 Steps
Our approach goes through two basic steps:
1. Calculation of distances between attributes.
2. Detection of duplicates.
3.3.1 Calculation of Distances between
Attributes
To calculate distances between attributes, we adopt
the ICD (Iterated Contextual Distance) algorithm
(Das and Mannila, 2000) from market basket
analysis. The basic idea behind the ICD algorithm is
to start with an arbitrary distance between attributes
and use this distance to calculate a probability
distribution of the attributes in the workload of
queries, then use this distribution to recalculate the
distance between the attributes. Since the calculation
of a distance between attributes is circular, the ICD
algorithm is iterative. A few iterations of the ICD
algorithm (typically 5) produce a stable distance
between attributes called an iterated contextual
distance. This distance is between 0 and 1; 0 means
that two attributes are completely similar and 1
means that they are completely dissimilar. Next, we
present the ICD algorithm.
_________________________________________
ICD algorithm
INPUT: A workload of m queries over an
ontology with n attributes.
OUTPUT: An n x n symmetric distance matrix
in which an element standing in the i-th row and j-th
column represents the iterated contextual distance
between the attributes i and j.
1. Construct a binary matrix. Construct an m
x n binary matrix M where rows correspond
to the queries and columns to the attributes.
Let M(i, j) be an element of the matrix M
that stands in the i-th row and the j-th
column. It has a value of 1 if the query i
references the attribute j. Otherwise, it is 0.
2. Construct a distance matrix. Construct an
n x n symmetric distance matrix D where
both rows and columns correspond to the
attributes. Let D(i, j) be an element of the
matrix D that stands in the i-th row and the
j-th column. It has a random value between
0 and 1 if i ≠ j. Otherwise, it is 0.
3. Construct query vectors. Let R be a set of
attributes in the ontology. For each attribute
A∈R, let r
A
= {t | M(t, A) = 1} be a set of
queries that reference the attribute A.
4. Construct attribute vectors. For each
query t∈r
A
, let A
t
= {A | M(t, A) = 1} be a
set of attributes that the query t references.
5. Construct probability distribution
vectors. For each attribute A∈R, let V
A
=
{f(t, A) | t∈r
A
} be its probability distribution
vector, where f(t, A) is the probability
distribution of the attribute A in the query t.
It is calculated using formula (1):
,
11
,
∑
,
(1)
where K is a kernel smoothing function;
e.g. K(X) = 1/(1+X).
6. Calculate centroids of probability
distribution vectors. For each probability
distribution vector V
A
, let c
A
be its centroid.
It is calculated using formula (2):
1
|
|
,
,
(2)
7. Calculate distances between attributes.
For each pair of attributes A∈R and B∈R
(A ≠ B), let D(A, B) = D(B, A) = |c
A
– c
B
|,
where c
A
and c
B
are centroids of V
A
and V
B
,
respectively.
8. Iterate: Stop if the algorithm converges.
Otherwise, go to Step 5.
__________________________________________
3.3.2 Detection of Duplicates
To detect duplicates, we use a threshold; e.g. 0.20.
Any two attributes with the iterated contextual
distance less than this threshold are considered to be
duplicates.
For each pair of attributes A∈R and B∈R (A ≠
B), let S = {(A, B) | D(A, B) < T} be a set of
duplicates, where T∈[0, 1] is a threshold.
AUTOMATIC DETECTION OF DUPLICATED ATTRIBUTES IN ONTOLOGY
285
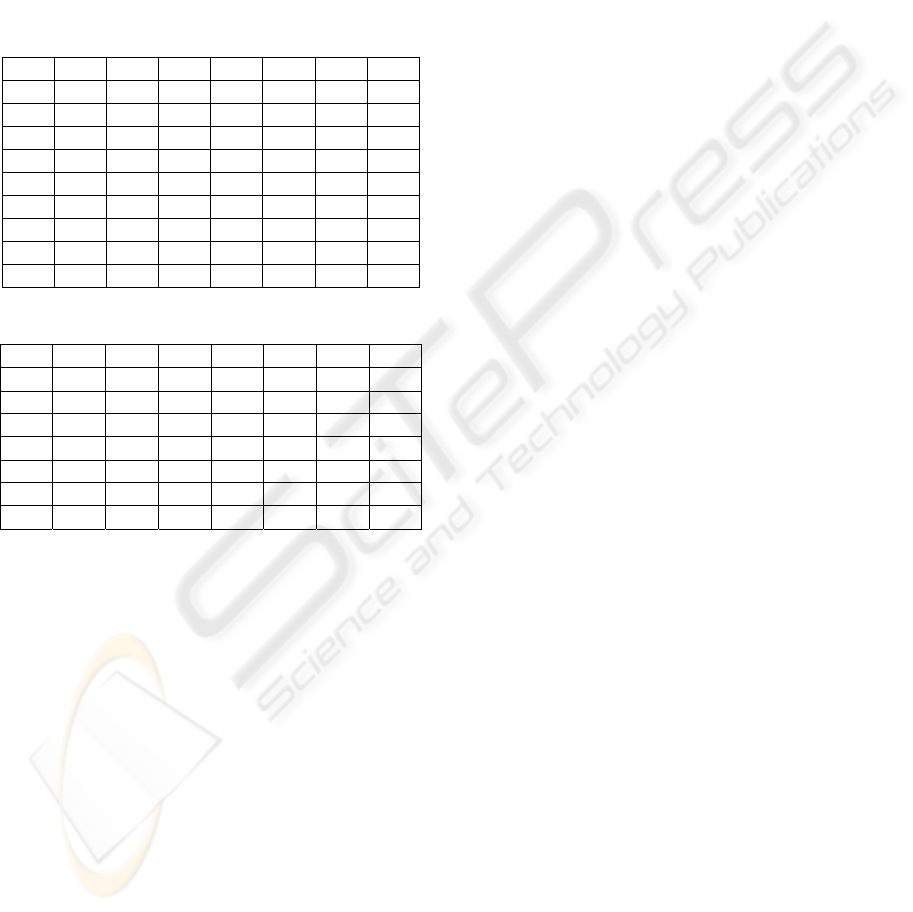
3.4 Example
Consider an ontology with the following attributes:
A, B, C, D, E, F and G. Suppose the following
workload of queries over this ontology: {A}, {A, B,
D, E}, {A, C}, {B, C}, {B}, {A, D}, {B, D, E}, {F}
and {G}.
When the ICD algorithm is run on this workload,
it produces a binary matrix in Table 1 and a distance
matrix in Table 2.
Table 1: Binary matrix.
A B C D E F G
Q1 1 0 0 0 0 0 0
Q2 1 1 0 1 1 0 0
Q3 1 0 1 0 0 0 0
Q4 0 1 1 0 0 0 0
Q5 0 1 0 0 0 0 0
Q6 1 0 0 1 0 0 0
Q7 0 1 0 1 1 0 0
Q8 0 0 0 0 0 1 0
Q9 0 0 0 0 0 0 1
Table 2: Distance matrix.
A B C D E F G
A 0.00 0.03 0.33 0.33 0.33 0.95 0.95
B 0.03 0.00 0.33 0.33 0.33 0.95 0.95
C 0.33 0.33 0.00 0.05 0.05 0.92 0.92
D 0.33 0.33 0.05 0.00 0.07 0.92 0.92
E 0.33 0.33 0.05 0.07 0.00 0.92 0.92
F 0.95 0.95 0.92 0.92 0.92 0.00 0.06
G 0.95 0.95 0.92 0.92 0.92 0.06 0.00
Upon examining this distance matrix, we found
that there are three groups of attributes: (1) A and B;
(2) C, D and E; and (3) F and G. Next, we give some
intuitive reasoning for the above.
Consider users who have asked about A and B.
Both of these users have also asked about D and E.
If we knew that D and E are similar, we could
conclude that A and B are similar too. But how do
we know about the similarity between D and E?
Consider users who have asked about D and E.
Both of these users have also asked about A and B.
Thus, by a circular argument, we can conclude that
A and B are similar and that D and E are similar.
Consider users who have asked about D and C.
Both of the users have also asked about A and B.
Thus, C is similar to D and consequently, to E.
As for F and G, they are far from other attributes
because the querying patterns of their users have
nothing in common with the others.
4 CONCLUSION AND FUTURE
WORK
We have proposed a novel approach to automatically
detecting duplicated attributes in an ontology, which
adopts the ICD algorithm from market basket
analysis. Some possible future applications of our
approach include: ontology-based data integration,
ontology matching and ontology ranking.
Even though the ICD algorithm appears to
converge quickly (typically within 5 iterations) in
practice, criteria for that convergence are to be
investigated. However, a theoretical analysis of the
convergence is difficult, because the ICD algorithm
essentially tries to compute fixed points of a non-
linear dynamic system.
Furthermore, we’ll investigate if some other
approaches (such as the term, value and structure-
based) can be combined with ours to produce even
better results.
ACKNOWLEDGEMENTS
This work was supported by the Estonian Centre of
Excellence in Computer Science (EXCS) funded
mainly by the European Regional Development
Fund (ERDF).
REFERENCES
Das, G., Mannila, H., 2000. Context-based similarity
measures for categorical databases. In PKDD’00, 4
th
European Conference on Principles of Data Mining
and Knowledge Discovery. pp. 201-210.
Ehrig, M., Haase, P., Hefke, M., Stojanovic, N., 2004.
Similarity for ontologies - a comprehensive
framework. In PAKM’04, Workshop on Enterprise
Modeling and Ontology: Ingredients for
Interoperability.
Eyal, A., Gal, A., Jamil, H., Modica, H., 2005. Automatic
ontology matching using application semantics. AI
Magazine, Vol. 26, issue 1, pp. 21-31.
OWL Web Ontology Language Reference, 2004,
http://www.w3.org/TR/owl-ref
Wu, F., Weld, D., 2008. Automatically refining the
Wikipedia infobox ontology. In WWW’08, 17
th
International Conference on World Wide Web. pp.
635-644.
ICEIS 2009 - International Conference on Enterprise Information Systems
286
