
The Elaboration and Clinical Testing of a New
Technique of Image Quality Improvement in Ultrasound
Medical Diagnostics
N. S. Kulberg
1
, T. V. Yakovleva
1
, Yu. R. Kamalov
2
, V. A. Sandrikov
2
L. V. Osipov
3
, P. A. Belov
3
1
Dorodnicyn Computing Centre of the Russian Academy of Science
Vavilova st., 40, Moscow 119333, RF
2
National Research Centre of Surgery
Abrikosovsky per. 2, Moscow 119992, RF
3
Izomed, ltd
Timiryazevskaya st. 1 corp. 2 Moscow 127422, RF
Abstract. The subject of the present research is solving the problem of the noi-
sy and the informative texture elements separation with taking into account the
specific traits of the ultrasound visualization. A noise suppression procedure is
realized on the basis of the elaborated mathematical model. The elaborated
technique has been tested in a clinic. The testing has confirmed its efficiency.
The work has been implemented under the support of the Russian Foundation
of Basic Research (RFBR), project № 08-01-12011-ofi.
1. Introduction
The main purpose of the investigations in the ultrasound medical visualization con-
sists in getting the most comprehensive information about the structure of the scatter-
ing biological tissue on the basis of scattered signal data analysis, and in further loca-
lization and characterization of the lesions. This task is far from its final solution. In
this field various particular applied tasks appear, such as the resolution improvement,
noise influence decrease, etc. Their main point is to insure the capability of the physi-
cian to identify the pathological changes on the background of the secondary image
elements that appear during the ultrasound image formation due to the influence of
various physical factors. The presence of the speckle structure is well known factor in
the visualization tasks. The speckle noise inevitably appears in the coherent imaging
systems. It is caused by the signals’ interference at scattering by the randomly distri-
buted very small objects. The speckle structure is imposed upon the useful texture of
the image. This kind of distortions is one of the most difficult for processing.
In the present work the speckle elements origination mechanism has been ana-
lyzed. The mathematical model has been developed to describe the basic elements of
the speckle structure according to the criteria of clinical usefulness and in correlation
with their spectral properties. Image improvement algorithm based upon the proposed
model has been developed and tested.
Kulberg N., Yakovleva T., Kamalov Y., Sandrikov V., Osipov L. and Belov P. (2009).
The Elaboration and Clinical Testing of a New Technique of Image Quality Improvement in Ultrasound Medical Diagnostics.
In Proceedings of the 2nd International Workshop on Image Mining Theory and Applications, pages 63-72
DOI: 10.5220/0001962300630072
Copyright
c
SciTePress

2. Comparison with Similar Results
Traditionally the noise suppression in digital visualization is based upon a priori
information about the differences in spatial spectra of the noisy and the useful ele-
ments of an image [1]. Thus, for some classes of images (for example, in digital pho-
tography) one can introduce a hypothesis that the useful elements’ spectrum is shifted
to lower band in comparison with the noise spectrum. Images in this case can be im-
proved by low frequency filtering.
Such approach works well only if the useful and noisy elements’ spectra can be re-
liably separated (e.g., for the small-grained photos). Such a processing is not applica-
ble when these spectra can not be distinguished between each other. The coherent
images which are characterized by the relatively large-scale interference noise ele-
ments cannot be improved by this way: depending upon the filter adjustments either
the image remains significantly noised, or the unacceptable meaningful small details
loss takes place.
In proposed technique the described drawbacks of the traditional approaches are
absent: the sharpness of the boundaries and the small-scale useful elements of the
image are kept even at high degrees of noise suppression.
Some investigators undertake the attempts to find such numeral parameter which
variations could become an indication of the presence of some pathologies in tissues
[2]. These works deal more with the attempts to automate the diagnostics process
rather than with the image quality improvement.
The most close prototype of the proposed technique is the method GOPView, that
was developed in 1980-s by Swedish company ContextVision [3]. All the software
products based upon this method are characterized by a common approach at which
the image being processed is described by means of a set of vector “features”, the
vector direction characterizing the “class” of an object (for example, the direction of
the boundary between two areas), and the vector length characterizing the “certainty”
of a feature. The image processing by means of this method consists in finding the
fields of “features” and their further analysis.
In our approach there is no intermediate step with the finding and analysis of the
“features”: the initial image elements are analyzed and filtered directly .
3. A Medical Problem Statement
Before discussing the mathematical criteria of the recognition of “useful” and “noisy”
elements of an image it is necessary to present a verbal “intuitive” description of the
investigated objects in such a way as they are perceived by a physician. Taking into
account the medical aspects of the problem together with the formal-mathematical
ones allows to increase the chances that the obtained solution will be really useful for
medics.
At visual analysis of an image the physician pays attention to two informative le-
vels in the image. They differ by size of the visualized objects relatively to the so-
called “resolution spot” of the acoustical system. This term means the minimal image
element which is distinguishable by the observer. This size in lateral area is deter-
64

mined by the acoustical system frequency: the smaller the frequency is, the worse its
lateral resolution is, and, consequently, the wider the “resolution spot” is. Its longitu-
dinal size is determined by the duration of the irradiated pulse: the longer the pulse is,
the worse is the longitudinal resolution and bigger is the “resolution spot”. The easiest
way to estimate the size of the “resolution spot” of a certain acoustical system is to
observe bright point reflectors of the acoustical phantom.
The first informative level (mentioned above) is a large-scale structure of the ob-
ject under investigation. At this level one can estimate the boundaries of organs and
their mutual disposition, the focal lesions and the large vessels. The macrostructure is
determined by the objects which size is larger than the “resolution spot” of the acous-
tical system. Due to this fact the definition of the correspondence of the macro-objects
in the acoustical image to real anatomic objects and the estimation of these objects’
properties is implemented relatively easily (we do not discuss here the various arti-
facts that can make the task more difficult). At diagnostics process the “direct” fea-
tures are estimated: the organs’ deformation (local or diffuse increase or decrease, the
presence of the local outpouching or retraction) and the violation of their normal
topography, the smoothness and clearness of the contours of the focal lesions, the
uniformity of the diameter and the right run of vessels.
The second informative level is presented by the small-scale structure. Here we
mean the various texture filling of extensive and relatively homogeneous areas of an
image of the parenchymatous organs. The structure of the scattering medium in this
case is characterized by the presence of a lot of scattering objects whose characteristic
size is of the order of tenth and hundredth portions of a millimeter. These are the the
cells layers of various orientation, arterioles and venules, small ducts, fibrous and fat
interlayers. At disease the morphological structure of these objects is changed. This
may lead to the changes of their acoustical properties. The local variations of the
brightness caused, for example, by small vessels, single small stones, etc., can also be
attributed to the small-scale structure level.
Thus, the microstructure of an image is determined by the scattering objects which
are smaller than “the resolution spot” of the acoustical system. An acoustical image of
such objects in principle does not have any geometric likeness with the original object
whereas within a single “resolution spot” there are tens and hundreds inhomogeneities
which are added statistically. As we deal here with the coherent adding of the acous-
tical oscillations, an interference amplification or weakening of the scattered signal
take place, which are not directly caused by the real changes of the reflective charac-
teristics of micro-objects (speckle-noise).
Nevertheless the change of the micro-objects’ scattering properties at various de-
ceases leads (though not directly) to the change of the image features. That is why the
characteristics of the texture structure of the picture that is obtained from these micro-
objects (including the speckle-noise) can serve as an indirect source of the informa-
tion about the disease nature. The changes of the brightness (the signal intensity), the
texture homogeneity and the degree of the attenuation of ultrasound signal are esti-
mated.
So, the morphological features of the objects under the study at macro- and micro-
levels are principally different. This fact causes the difference in approaches to their
analyzing. Obviously this leads to choosing the different mathematical means for
these informative levels’ processing.
65

4. Separation of Macro- and Micro- Structures
A two-dimensional discrete function f
ij
, obtained as a result of ultrasound transducer
scanning along one special coordinate
x
, is being processed. Depending upon a real
scanning coordinates system this coordinate may correspond both to polar angle (the
convex and the sector transducers) and to one of the Cartesian coordinates (the linear
transducers).
An image comes to processing in the coordinate system of scanning, i.e. before
passing the scan-converter. These data have already been passed the procedure of
quadrature detection and logarithmic compression of the dynamic range.
For convenience of the mathematical estimations let us transfer from discrete func-
tions to the function of continuous variable:
f
ij
⇒ fx
i
, y
j
(
)
⇒ fx, y
(
)
. This is possi-
ble under Nyquist-Shannon sampling theorem for functions having the finite spec-
trum. It should be noticed that the latter condition, i.e. the limited spectra’s ranges, is
valid with some approximations. However its validity is believed to be sufficient for
the most part of practical cases.
In order to separate the small-scale and large-scale image structures let us use the
procedure similar to the known method of pyramidal coding. We shall represent an
initial image
fx, y
()
as a sum:
fx, y
()
= M
0
x, y
(
)
+ m
0
x, y
(
)
(1)
Here m
0
x, y
()
is a function of the small-scale structure including mainly the in-
formation about small details of the initial image.
The function of large-scale structure is the following:
M
0
x, y
(
)
= fx, y
(
)
∗ψ x, y
(
)
(2)
It contains the information about large details of an initial image and is calculated
by means of the low frequency filtering (LFF) of the initial image function
fx, y
()
.
Here ψ x, y
()
is a pulse characteristic of some LFF, a sign
∗
means convolution. Let
us denote the spatial spectrum of this filter as
ΨΩ
x
, Ω
y
(
)
.
As the simulation results have shown the type of the LFF is not critical. The only
critical condition is the velocity of the monotonous decrease of the filter amplitude-
frequency characteristic (AFC) behind the cut frequency, which must be not less than
10 dB per octave. The principle meaningful factor is the choice of the cut frequencies,
what directly depend on the specific traits of the acoustical image acquisition. Let us
consider this issue in more detail.
The most important parameter of the images under our study is the so-called local
correlation radius. The results of many theoretical and experimental investigations
have shown its value to be determined mainly by the ratio between the emitted sig-
nal’s wavelength, the ultrasound pulse duration and correlation characteristics of the
object under the study. For the homogeneous areas which are characterized only by
the presence of a texture, the correlation radius is the least one and is determined by
66

the sizes of the “resolution spot” of the acoustical transducer R
C
. The filter cut fre-
quency is determined by the following formula:
Ω
C
=
1 R
C
(3)
The two-dimensional filter ψ x, y
(
)
can be built as a superposition of one-
dimensional LFFs with the cut frequencies calculated by the formula (3).
It should be noticed that the requirement to the scale properties of the filters to be
used depending upon the correlation characteristics of an image makes it difficult to
apply the wavelet transform, at which the spectral filter characteristics are rather de-
pendent upon the scale of the discrete image.
To build an improved image
f
E
x, y
(
)
we shall use an auxiliary “reconstruction
function”
Rx, y
()
for macrostructure and rx, y
(
)
for microstructure:
f
E
x, y
()
= M
1
x, y
()
+ m
1
x, y
(
)
= Rx, y
(
)
M
0
x, y
(
)
+ rx, y
(
)
m
0
x, y
(
)
(4)
The key moment of the present work determining its scientific novelty are the me-
thods of functions
Rx, y
()
and rx, y
(
)
calculation. These functions represent the
numerical criteria of the “usefulness” of any image element. Determining the function
rx, y
()
is of particular importance for us as the analysis and the processing of the
macrostructure, according to the authors’ opinion, present a less complicated task than
the processing of the textured “homogeneous” areas.
5. The Macrostructure and the Microstructure Processing
The macrostructure processing is relatively simple to implement. The main objects of
interest in the images determined by the function
M
0
x, y
(
)
, are the large objects’
boundaries. That is why the processing and improvement of such images can be con-
sidered as a kind of automated “retouch”. These techniques are well known and wide-
ly used in various graphical applications. For example, the most simple and evident is
the usage of an un-sharp masking method with the threshold criteria [1]. The other
ways of processing are also possible and their elaboration is not a difficult task. That
is why we shall not consider them here in detail. Significantly more difficult and
interesting task is the microstructure processing.
In order to explain the essence of the technique of the small-scale structure
processing developed in the present work, let us describe its main components and
provide their mathematical grounding. We shall suppose that the signal is emitted as
the focused Gaussian beam and that the signal spectrum is also Gaussian. We shall
consider the correlation radiuses
R
C
for both coordinates to be the same (this condi-
tion is easy to implement by simple change of one of the coordinates).
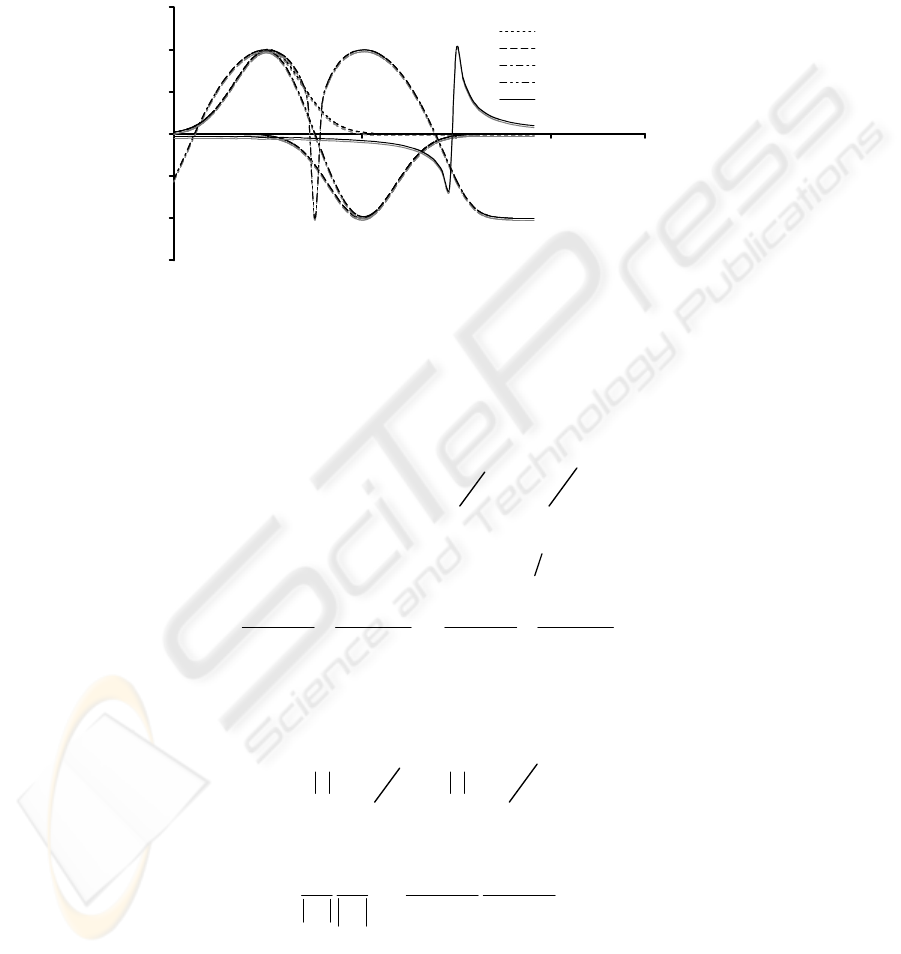
The main elements of speckle-structure are the “interference maximum” and the
“interference zero” (Fig. 1). Besides, some components of the macrostructure persist
67
in a function m
0
x, y
()
: first of all, the brightness “jumps”, determining the sharpness
of the objects’ boundaries.
1st scatterer signal
2nd scatterer signal
Summary signal (linear scale)
Summary signal (log. scale)
Sharp boundary signal
Fig. 1. Basic elements of the small-scale structure represented by the function m
1
x, y
()
(the
cross-sections of the values of two-dimensional function are presented along
x
-axis). Two
antiphase scattering objects result in the oscillation signal having two interference maxima
(useful) and one interference zero (harmful)
The interference maximum can be presented approximately as a logarithm of an in-
itial Gaussian “resolution spot” with some limit of the special extension:
R
C
2
− y
2
()
R
C
2
− x
2
()
rect
x
R
C
(
)
rect
y
R
C
(
)
(5)
Having implemented the Fourier transform we obtain the spatial spectrum that de-
creases while the frequency grows with the velocity ∼ 1 Ω
2
:
sin Ω
y
R
C
Ω
y
3
R
C
3
−
cos Ω
y
R
C
Ω
y
2
R
C
2
⎛
⎝
⎜
⎞
⎠
⎟
⋅
sin Ω
y
R
C
Ω
y
3
R
C
3
−
cos Ω
y
R
C
Ω
y
2
R
C
2
⎛
⎝
⎜
⎞
⎠
⎟
(6)
Within the surroundings of the “interference zero” the image function’s behavior
is, as a rule, linear, before the calculation of its logarithm. After the logarithm calcula-
tion we get a function
ln x rect
x
R
C
(
)
⋅ ln y rect
y
R
C
(
)
, (7)
with the spectrum :
1
Ω
x
1
Ω
y
⎛
⎝
⎜
⎜
⎞
⎠
⎟
⎟
∗
sin Ω
x
R
C
Ω
x
R
C
sin Ω
y
R
C
Ω
y
R
C
⎛
⎝
⎜
⎞
⎠
⎟
(8)
At last, the extensive boundary of two objects that is oriented along y -axis, is de-
scribed in the function
m
0
x, y
()
by the following expression:
68

ϑ x
(
)
∗δx
(
)
−ψ x, y
(
)
(
)
, (9)
where ϑ x
()
is a Heaviside function. The spectrum of (9) is the following:
1
Ω
x
⋅δ Ω
y
()
⋅ 1 −Ψ Ω
x
, Ω
y
()
(
)
(10)
Having averaged the obtained characteristic for all the angles of the boundary
orientation we get the formula:
1
Ω
x
2
+Ω
y
2
⋅ 1 −Ψ Ω
x
, Ω
y
()
(
)
(11)
From (11) it follows that the function will have a local maximum near the filter cut
frequency
ΨΩ
x
, Ω
y
(
)
. The presence of this maximum can be easily proved taking
into account the above introduced condition concerning the function
ΨΩ
x
, Ω
y
()
decreasing velocity.
The usefulness of three described elements is estimated on the basis of the analysis
of the investigated data distribution. Traditionally the behavior of the local amplitude
of the speckle-noise (let us denote it as
v ) is described by means of the Rayleigh
distribution:
Fv
()
=
v
v
0
2
exp
−v
2
2v
0
2
⎛
⎝
⎜
⎞
⎠
⎟
, v > 0
. (12)
However this distribution is not applicable for all the cases (e.g., see [4], p. 213).
As an evident case of “non-Rayleigh” reflective medium one can propose the model
of a medium consisting of a lot of the reflectors of the same amplitude
v
0
and random
phases, these reflectors being distanced by
R
C
. The amplitudes of signals that have
been received from such a medium obey to the so-called
β
-distribution:
β
1
2
,
1
2
v
()
=
v
0
π vv
0
− v
()
, v ∈ 0, v
0
()
(13)
This distribution has a U-shaped density function, while the reflectors’ amplitude
v
0
which is to be estimated by us, is the upper boundary of the distribution values.
The distributions (12) and (13) just represent two extreme cases of the interference
picture behavior, and in practice we have something average. It is important for us
that the value under the estimation always lies between the mathematical expectation
and the maximum of the real distribution. This fact leads us to the following practical-
ly important conclusion: the “
interference zeros” in the image should be believed
to be more “harmful” elements of a texture than the interference maxima.
The comparison of the objects’ spectral characteristics with the degree of their use-
fulness has shown that the most “harmful” object is characterized by slower decreas-
ing of its spatial spectrum, and the most “useful” one possesses the local spectral
69

maximum near the frequency
Ω
C
. For this reason we propose to suppress harmful
texture details and to amplify useful ones by means of a filter characterized by the
amplification of the spatial frequencies within the range from 0 up to
Ω
C
, and by
suppression of higher spatial frequencies:
mx, y
(
)
= m
0
x, y
(
)
∗ψ
1
x, y
(
)
(14)
The certain shape of the filter pulse characteristic ψ
1
x, y
(
)
is determined empiri-
cally based upon the subjective estimation of the acquired image quality. It depends
upon the specific conditions of the measurements.
a) b)
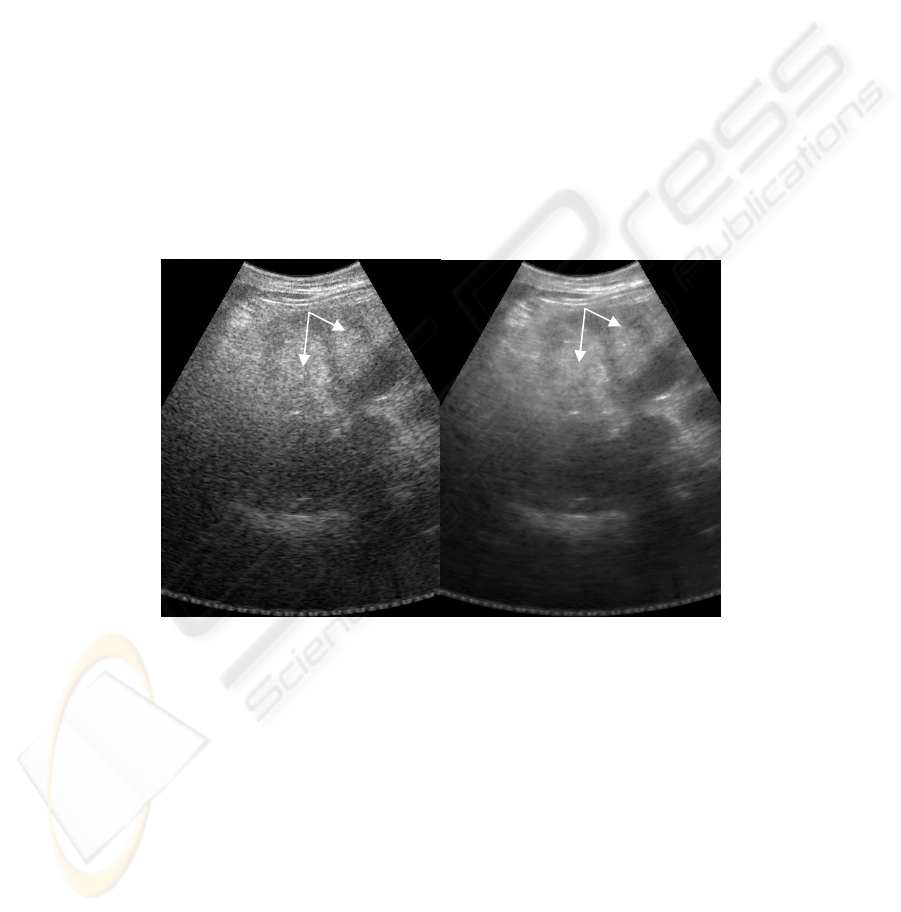
Fig 2. An oblique scanning from under the right subcostal area: image of the gall-bladder
(marked by arrow) and right lobe of the liver. a) unprocessed image; b) processed image. After
the processing one can notice an improvement of the visualization of the walls of gall-bladder,
what makes it possible to get more reliable information about its shape. It is also possible to get
a more reliable estimation of the state of the internal gall-bladder’s contents
The main property of the function
mx, y
(
)
consists in the fact that its absolute
value in any point of the image increases with the degree of the usefulness of an
object situated in this point.
Consequently this function can be used as a function of
the microstructure reconstruction in formula (4). For additional tuning of the recon-
struction function properties one can introduce the nonlinear scaling of the small-scale
structure reconstruction function:
rx, y
()
=α
%
mx, y
()
(
)
γ
(15)
where the
α
and
γ
are parameters of the algorithm being available for the user
adjusting. By means of changing the parameters
α
and
γ
one can achieve practically
a complete suppression of the small-scale texture areas of an image without loss of
70
large objects boundaries’ sharpness. The usage of the above described macro-objects
“retouch” procedure can still make them more clear. Thus processed picture approx-
imately resembles MR-image and can produce a good impression upon non-
specialists. Nevertheless, such excessive noise-suppression, according to the physi-
cians’ estimation, is not desirable and is even harmful.
6. Clinical Approbation
The techniques developed in the present work have been implemented as a soft-
ware package called RASP System
®
. This software was installed in the medical ultra-
sonic scanner A-4000 developed by Russian company Izomed, ltd. This scanner has
been approbated in the process of ultrasound examinations of patients in National
Research Centre of Surgery. Some results of clinical testing are included into the
present paper.
a) b)
Fig. 3. Scanning of the subcostal area from the right: image of the focal lesion in a liver (the
nodes of liver cells carcinoma are marked by arrows) on the background of the liver cirrhoses.
a) unprocessed image; b) processed image. The processing makes the contours of the liver
lesion more clear due to improving the visualization of the hypo-echoic area around it, and also
the visualization of the nearby situated hypo-echoic node on the background of the diffuse
changes of the liver parenchyma
During the tests we have compared the results of ultrasound visualization of some
organs of health people with the data obtained while examining the patients with
various diseases. These approbations have confirmed the efficiency of the proposed
techniques of the ultrasound image visual characteristics improvement, and, conse-
quently, a real possibility to increase the informative capacity and reliability of ultra-
sound medical diagnostics at the detected images processing. The results of this
processing are presented in Figs. 2—3.
71

At visual analysis of various abdominal objects images obtained in normal condi-
tion and in the cases of various diseases, by means of our program it has been found
out that:
1) The method makes it possible to make more certain conclusion about the shape
of the texture objects (liver, pancreas, spleen, kidneys), that provides the opportunity
of more confident their differentiation from the surrounding tissues and structures, to
get more reliable opinion about the smoothness or non-smoothness of these objects
boundaries and more precise definition of their sizes.
2) While using this processing one get the possibility of more assured revealing of
the focal lesions of the liver (both hyper-, and hypo-echoic) due to having more accu-
rate information about their boundaries, sizes and internal structure.
3) Clearer contouring of the liquid-containing objects (vessels, bile ducts, cysts) al-
lows more assured differentiation of these organs from the surrounding medium and
more reliable judgments about their anatomic construction.
4) The larger range of the contrast if compared with the standard imaging modes,
makes it possible to reveal more reliably the sludge (sand, small stones, etc.) in bile
ducts, and also to differentiate the liver ligaments.
7. Conclusion. The Perspectives of Further Investigation
The present paper is devoted to the processing of significantly “roughed” signals
that have passed the quadrature detection and the logarithmic compression of the
dynamic range. This results from the obvious fact: in most modern series devices it is
relatively easy the get an access to such a data. That is why, in spite of the obvious
insufficiency of these data their investigation and processing continue to be of a sig-
nificant interest. However according to the authors’ opinion the most perspective
direction in the ultrasound images improvement is the investigation and processing of
the radiofrequency “raw” data which are not practically used at the present time. Re-
ceiving the “raw” data in series devices will significantly extend the boundaries of the
ultrasound visualization due to the introduction of new techniques of the digital signal
processing.
References
1. R. Gonsalez and R. Woods, Digital Image Processing, second ed. Prentice Hall,
2001;
2.
Wen-Chun Yen, Sheng-Wen Huang and Pai-Chi Li. Liver fibrosis classification
with B-mode ultrasound. Ultrasound in Med. & Biol., vol. 29, No 9, pp. 1229—
1235;
3.
Official site of company ContextVision http://www.contextvision.com;
4.
Physical Principles of Medical Ultrasonics. Edited by C. R. Hill, J. C. Bamber and
G. R. ter Haar. John Wiley & Sons, Ltd, 2003;
72
