
A Method for Automatic Extraction of Dopaminergic
Neuron Terminals on Striatum Frontal Section Images
⋆
I. Gurevich
1
, I. Koryabkina
1
, E. Kozina
2
, A. Myagkov
3
, H. Niemann
4
M. Ugrumov
2
and V. Yashina
1
1
Dorodnicyn Computing Centre of the Russian Academy of Sciences
Vavilov st. 40, 119333 Moscow, Russian Federation
2
Koltzov Institute of Developmental Biology of the Russian Academy of Sciences
Vavilov st. 40, 119334 Moscow, Russian Federation
3
Lomonosov Moscow State University
Leninskie Gory GSP-1, 119992 Moscow, Russian Federation
4
Friedrich-Alexander University of Erlangen-Nuremberg
Martensstr. 3, Erlangen, 91058, Germany
Abstract. This work is devoted to the description of an experimental data ac-
quisition automated method which is required to fill the model of Parkinson’s
disease preclinical stage. Digital images of the immunostained brain sections of
experimental animals are used as a data source. Proposed method: 1) is based on
following mathematical morphology operations: opening, grayscale reconstruc-
tion, closing, bot-hat transformation, morphological gradient, watershed trans-
formation; 2) enables: to smooth heterogeneous complex background; to select
small objects on images depended on given sizes and gray values; to eliminate
out-of-focus objects; to separate close objects; to calculate features of selected
objects; 3) is intended for automatic extraction of dopaminergic neurons termi-
nals on striatum frontal section images. Experimental investigations confirmed
possibility and suitability of section images automated processing and analysis
by means of the method. The results of the method use are segmented object
contours binary image and object feature list.
1 Introduction
Now and in foreseeable future an image is one of the main tools to represent infor-
mation in scientific researches, particularly in medicine and biology. Development and
application of modern mathematical apparatus for automation of image mining is one of
the breakthrough challenges for theoretical computer science. Paper authors developed
theoretical basis [1] and elements of information technology [2] for automated mor-
phological image analysis of lymphoid cell nuclei of diseased hemoblastoses, which
⋆
This work was partially supported by the Russian Foundation for Basic Research Grants Nos.
07-07-13545, 08-01-90022 and by the project of the Program of the Presidium of the Russian
Academy of Sciences “Fundamental Sciences to Medicine 2009”.
Gurevich I., Koryabkina I., Kozina E., Myagkov A., Niemann H., Ugrumov M. and Yashina V. (2009).
A Method for Automatic Extraction of Dopaminergic Neuron Terminals on Striatum Frontal Section Images.
In Proceedings of the 2nd International Workshop on Image Mining Theory and Applications, pages 30-39
DOI: 10.5220/0001964600300039
Copyright
c
SciTePress
were fundamentals for creation of system for automated diagnostics of blood oncolog-
ical diseases. This paper is devoted to development of mathematical tools and elements
of information technology for analysis of another class of medical images. A current
task is automation of experimental data extraction for filling a model of Parkinson’s
disease (PD) preclinical stage [3].
The disease is characterized by a progressive degeneration of dopaminergic (DA-
ergic) neurons[4] in the substantia nigra pars compacta (SN) leading to a dopamine (DA)
depletion in the striatum. As a result, parkinsonian patients loose the ability to control
their movements. Experimental models’ creation is one of the crucial approach to this
neurodegenerativedisease pathogenesis research.
The development of PD preclinical stage model is a complex screening analysis
which is being done cooperatively by physiologists, biochemists and morphologists.
The morphological research requires processing and analysis of large quantity of ex-
perimental animal serial brain section images. And studying of each of the sections
requires quantitative and qualitative feature measurements and analysis of several thou-
sand neurons and axons.
Automatic extraction of dopaminergic neuron terminals on striatum frontal section
images allows one to speed up significantly the research of PD at the cost of automati-
zation of experimental data model filling and automatization of model investigation by
means of computer experiments.
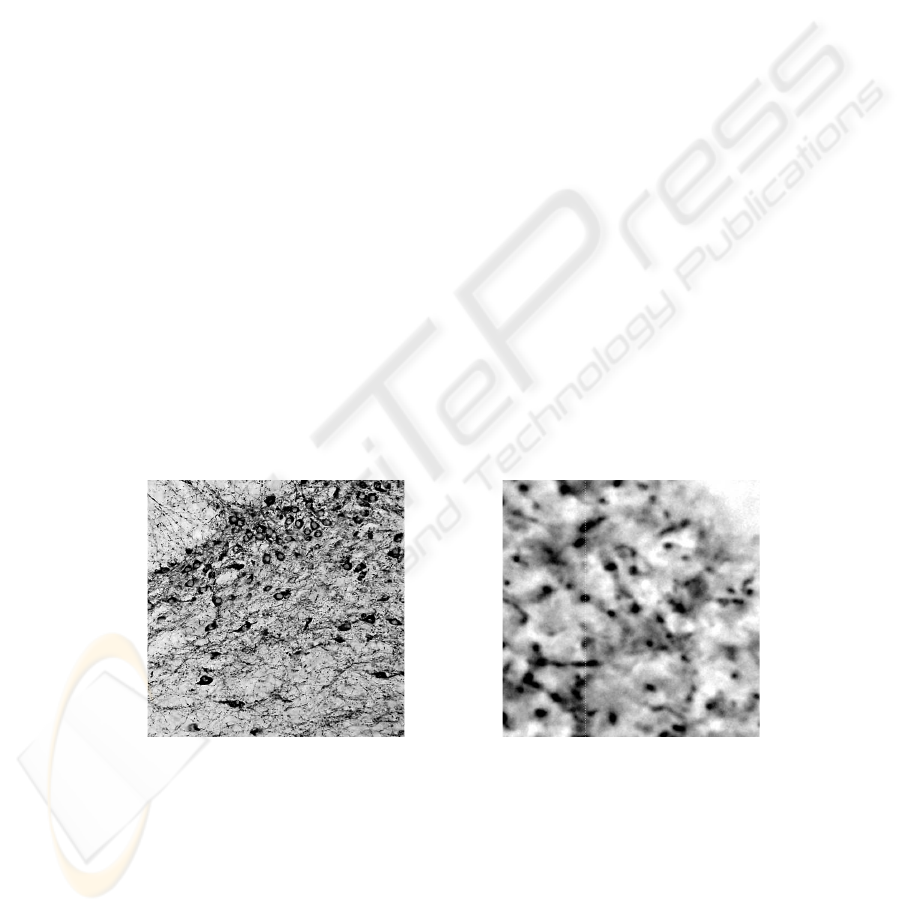
The initial data is digital images of the immunostained sections of various brain
areas. DA-ergic neurons were labeled on serial sections (a thickness is 20 microns) of
the substantia nigra (Fig. 1), and their axons (terminals) on sections of the striatum (a
thickness is 12 microns) (Fig. 2) by immunohystochemestry for tyrosinehydroxylase
(TH). Experimental data have been received from digital images of distal parts of axons
(terminals).
Fig.1. Neurons. Fig.2. Terminals.
The major characteristic of PD model is the number of DA-ergic axons, which in-
nervate the striatum. A number of DA-ergic striatum fibers can variate when various
schemes of specific dopaminergicneurotoxin – 1-methyl-4phenyl-1,2,3,6-tetrahydropyridine
(MPTP) administration (a dose, quantity of injections, intervals between injections) are
31

used. The extent of degeneration is defined as a difference between the number of ter-
minals of DA-ergic axons in control (the group of animals that were not injected by the
toxin) and in experimental (the group of animals that were injected by the toxin) groups.
DA-ergic neurons and axons remained after MPTP administration are supposed to have
to increase its functional activity to compensate DA deficiency. One of the indicators of
increased functional activity of neurons and their fibers is their size increases (hypertro-
phy). TH – DA synthesis key enzyme – concentration increase can be another specific
indicator of functional activity of DA-ergic axons and neurons.
Application of the developed method allows one to quantitatively estimate features
mentioned above. The description of the method is given below in Sec. 2. Section 3
reviews the results of the method application.
2 Method Description
The proposed method is designed for the isolation of the small informative elongated
objects on the frontal striatum section images and for extracted objects’ feature calcu-
lation. Images and objects represented on that images were characterized as follows: a)
initial image resolution is 0.0117 µm
2
/pixel
2
; b) terminals (Fig. 2) are rounded objects
with area varying from 0.6 − 0.7 µm
2
up to 2.5 − 3 µm
2
; c) terminals color differs
from background color; d) terminals can have oval, round, prolate or irregular shape.
The results of the method application are segmented object contours binary image and
their feature list. The automated segmentation method include 7 stages defined below.
The method stage description is outlined according to the following scheme: 1) brief
description of the applied transformation or algorithm and its mathematical content;
2) the significance of the particular transformation while task solving; 3) explanatory
material permitting results evaluation. Some method stages are supplied by plots of in-
tensity function for a particular column, which is marked on the corresponding image
with thin white dashed line. Intensity function corresponding to particular stage result-
ing image is plotted with solid line, this of previous stage resulting image (if any) is
depicted by dashed line and dash-dot line is used to demonstrate the partial result while
applying the transformation. In the equations presented below the grayscale reconstruc-
tion [5] of I from marker J is denoted by ρ
I
(J) (similar the dual reconstruction [5] is
denoted by ρ
∗
I
(J)).
2.1 Step 1. Opening by Reconstruction
Grayscale opening by reconstruction [5,6], denoted by I◦
ρ
B , consists of the following:
an initial image I is eroded [6] by a flat structuring element B , then the obtained image
I ⊖ B is used as marker to reconstruct the initial image.
I ◦
ρ
B = ρ
I
(I ⊖ B) . (1)
The first method step is intended for elimination of initial image narrow peaks,
corresponding to the background. The results of carrying out the present transformation
are depicted on Fig. 3 and Fig. 4. The erosion was done by the flat disk structuring
32
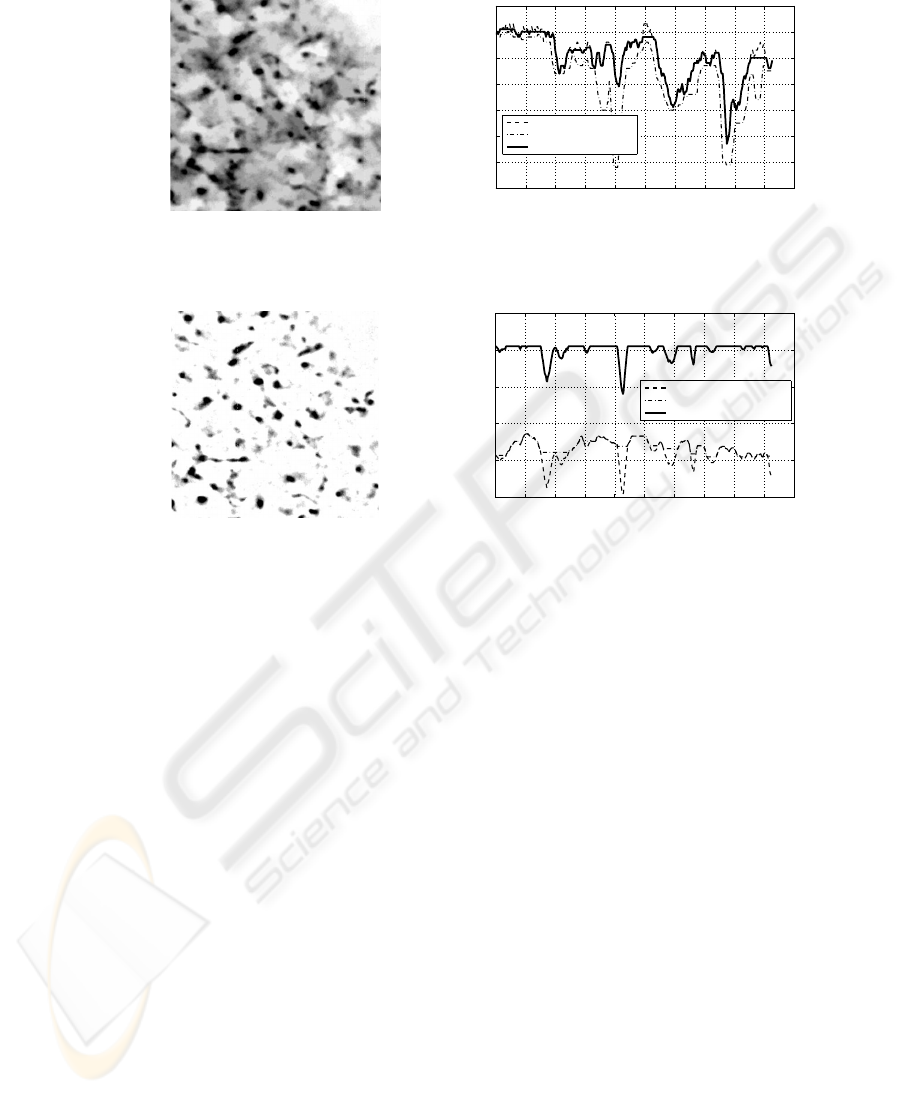
Fig.3. Opening by Reconstruction.
0 50 100 150 200 250 300 350 400 450 500
80
90
100
110
120
130
140
150
Y
Gray value
Initial image
erosion
Opening by reconstruction
Fig.4. Opening by Reconstruction. Plot of in-
tensity function. X = 453.
Fig.5. Bot-Hat by Dual Reconstruction.
0 50 100 150 200 250 300 350 400 450 500
50
100
150
200
250
300
Y
Gray value
Opening by reconstruction
dual reconstruction
Bot−hat by dual reconstruction
Fig.6. Bot-Hat by Dual Reconstruction. Plot of
intensity function. X = 149.
element with the radius that is greater than the narrowest terminal width and that is
smaller than the most prolate terminal length.
This step is essential for the reduction of the background regions. There are lots of
intensity local minima in these regions, that are used as markers of the objects in the
next.
2.2 Step 2. Bot-Hat Transformation by Dual Reconstruction
Grayscale bot-hat transformation by dual reconstruction [5, 7] is the subtraction of the
input image from closed by dual reconstruction image (see Sec. 2.3).
BotHat
B
ρ
(I) = ρ
∗
I
(I ⊕ B) − I . (2)
The main goal of this step is the correction of complex heterogeneous background
of the initial image. Figures 5 and 6 reveals the results of bot-hat by dual reconstruction
using.
While applying this transformation the inner structure of terminals remains un-
changed. It is achieved by using of the dual reconstruction and by the fact, that the
used structuring element is grater than almost all terminals.
33
2.3 Step 3. Closing by Dual Reconstruction
Grayscale closing by dual reconstruction [5,6], denoted by I •
ρ
B , consists of the
following: an initial image I is dilated [6] by a flat structuring element B , after that the
obtained image I ⊕ B is used as marker to reconstruct the initial image.
I •
ρ
B = ρ
∗
I
(I ⊕ B) . (3)
This step of the method is aimed to nonuniform regions smoothing in the interior
of the terminals. The results of carrying out of the present transformation are shown on
Fig. 7 and Fig. 8. The structuring element was chosen to be completely contained in all
possible terminals.
Fig.7. Closing by Dual Reconstruction.
0 50 100 150 200 250 300 350 400 450 500
190
200
210
220
230
240
250
260
Y
Gray value
Bot−hat by dual reconstruction
dilation
Closing by dual reconstruction
Fig.8. Closing by Dual Reconstruction. Plot of
intensity function. X = 149.
This step is essential for providing robust marking of terminals procedure. Whereas,
terminal initially have many intensity local minima, the marker extraction procedure
will not give appropriate results without the use of current operation.
2.4 Step 4. H-dome Elimination Transformation
Reconstruction proved to be a very efficient technique to extract regional maxima and
minima from grayscale images. Moreover, the method extends to the determination of
such “maximal structures”, which are called h-domes and h-basins [5]. As it was shown
in [5] the binary image (mask) M(I) of the regional maxima of I is given by:
M(I) = I − ρ
I
(I − 1) . (4)
Then, the h-dome D
h
(I) image of the h-domes of a grayscale image I was defined as
follows:
D
h
(I) = I − ρ
I
(I − h ) . (5)
And consequently h-dome elimination is the subtraction of an h-dome image from the
initial image.
Terminals are located at different depth on 12 microns thickness section of the stria-
tum. While taking photos of a section the only section plane is in the microscope focus,
34
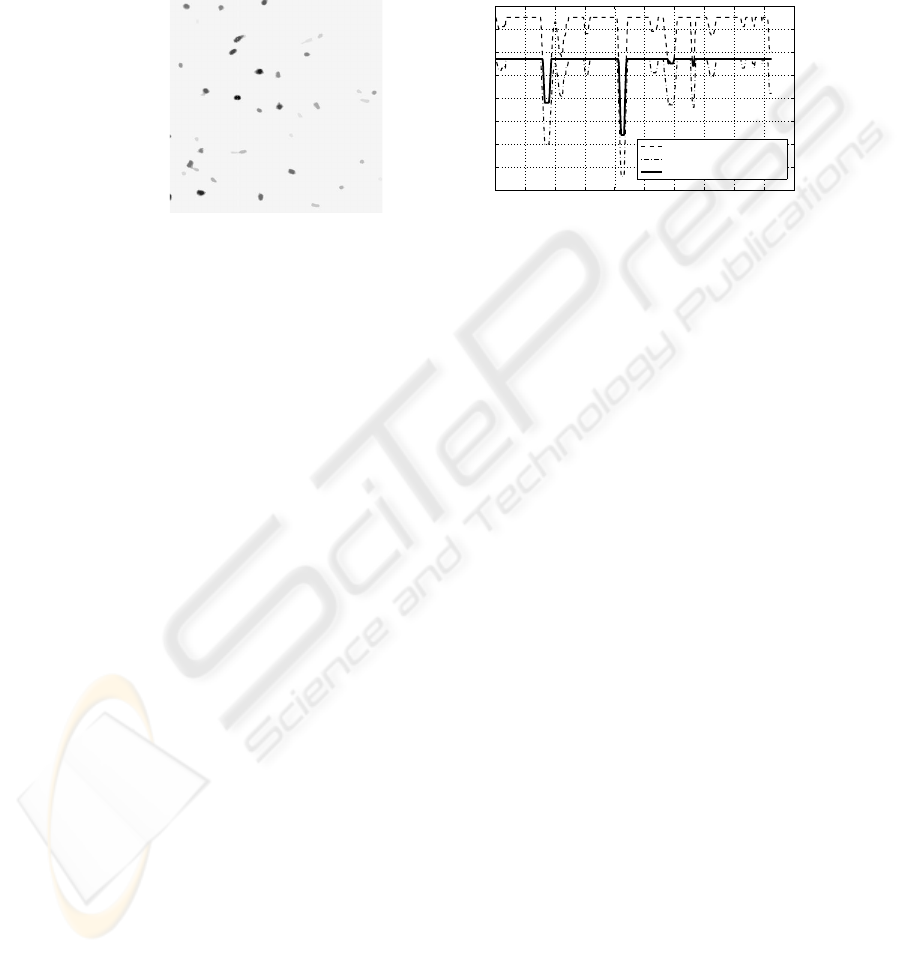
some terminals can have intensity values greater than the others. In addition, sections
can be non-uniformly stained, that also involves differences in terminal intensity val-
ues. But at first, it is necessary to detect in- and out-of-focus objects. The image with
eliminated h-domes is presented on Fig. 9 and Fig. 10.
Fig.9. H-dome elimination.
0 50 100 150 200 250 300 350 400 450 500
180
190
200
210
220
230
240
250
260
Y
Gray value
Closing by dual reconstruction
h subtraction, h = 18
H−max elimination
Fig.10. H-dome elimination. Plot of intensity
function. X = 149.
A technique for h-parameter estimation was offered for automation of the segmen-
tation procedure. It proceeds on the idea of the selected marker intensity values cluster-
ing into two groups. As a result of previous transformations, maxima of all remained
objects became equalized, and the focus closeness can be measured by minimal inten-
sity values of the objects which are revealed as regional minima. The initial values for
clusters’ centers is assigned with minimum and maximum intensity values of the pre-
vious step resulting image. To sum up, h-dome elimination corresponds to out-of-focus
objects removal. H-parameter estimation technique agrees with hand-selected in-focus
objects.
2.5 Step 5. Object and Background Markers Extraction
All the previous steps were intended to avoid oversegmentation when applying wa-
tershed transformation to morphological gradient image (see Sec. 2.7). Another very
effective way to reduce oversegmentation is based on the idea of markers [7, 8]. Object
markers are extracted as regional minima of the previous stage resulting image. Back-
ground markers are estimated from the distance transform [8] of object markers’ binary
image. Applying the watershed segmentation algorithm to the modified gradient (see
the next step), only marked objects are selected.
2.6 Step 6. Morphological Gradient Image Modification
After marker extraction, grayscale reconstruction is used to modify the gradient image
G into an image G
′
[5] so that:
– its only minima are located on the extracted markers,
35
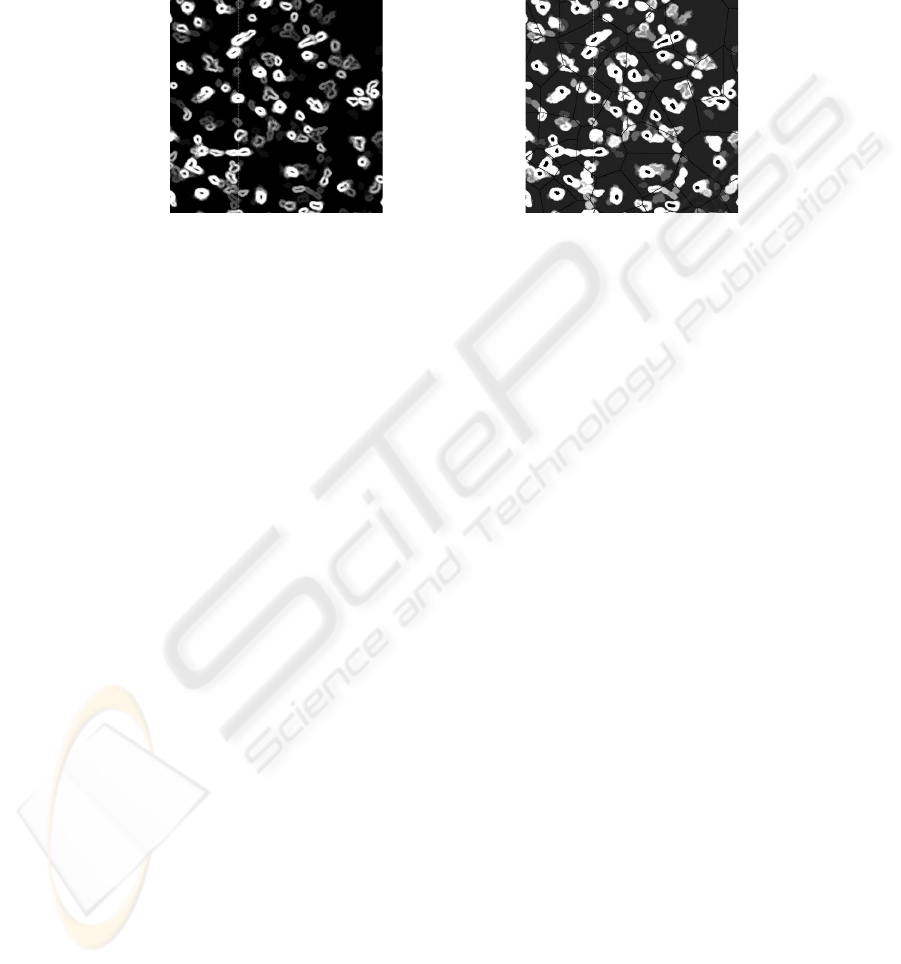
– its watershed lines separating markers are preserved.
Figures 11 and 12 represent the morphological gradient image and modified gradient
image respectively.
Fig.11. Morphological Gradient. Fig.12. Modification of Gradient Image.
Morphological gradient image, denoted by G, is obtained as the difference between
the dilation and the erosion of the Step 3 (Sec. 2.3) resulting image by the same struc-
turing element.
G(p, q) = (I ⊕ B)(p, q) − (I ⊖ B)(p, q) . (6)
Then the binary marker image M, revealed at the previous step, is used to modify
G in the following way:
G
′
= ρ
∗
min(G+1,(m+1)M)
((m + 1)M ) , (7)
where m is the maximal value of the pixels of G.
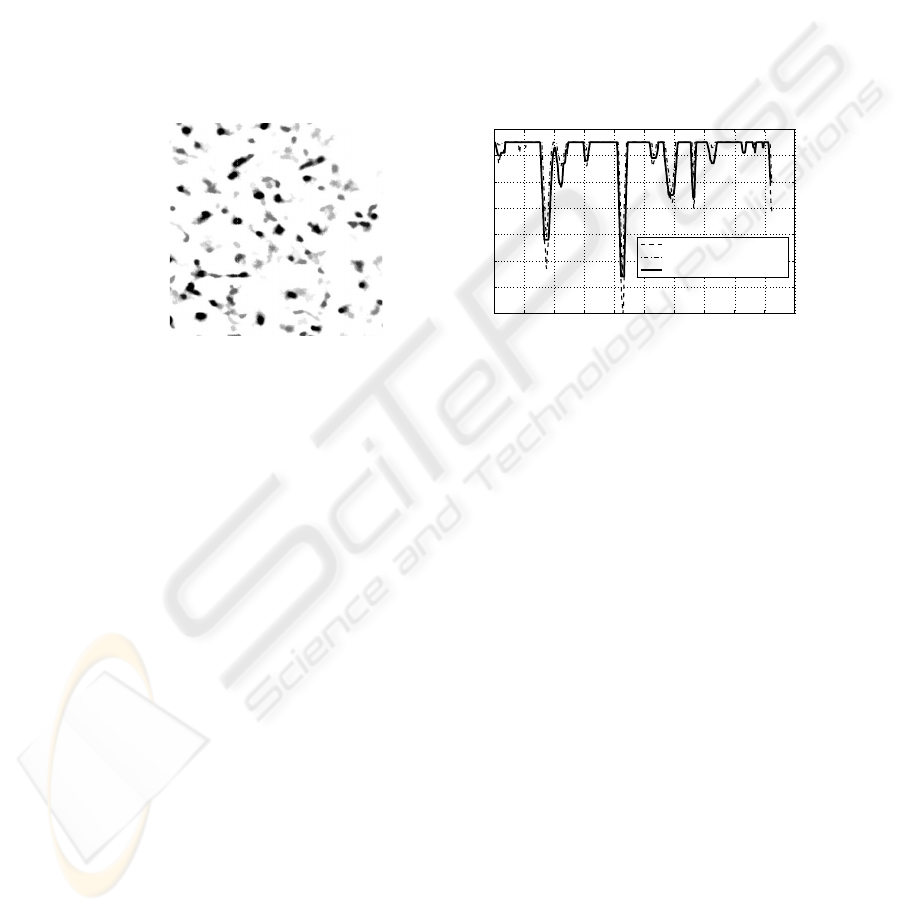
2.7 Step 7. Watershed Segmentation
On this step the modified gradient is processed with watershed segmentation algorithm
[8, 9], and, as a result, object contours are retrieved. Figures 13 and 14 reveals the
modified gradient and watersheds lines intensity function plots.
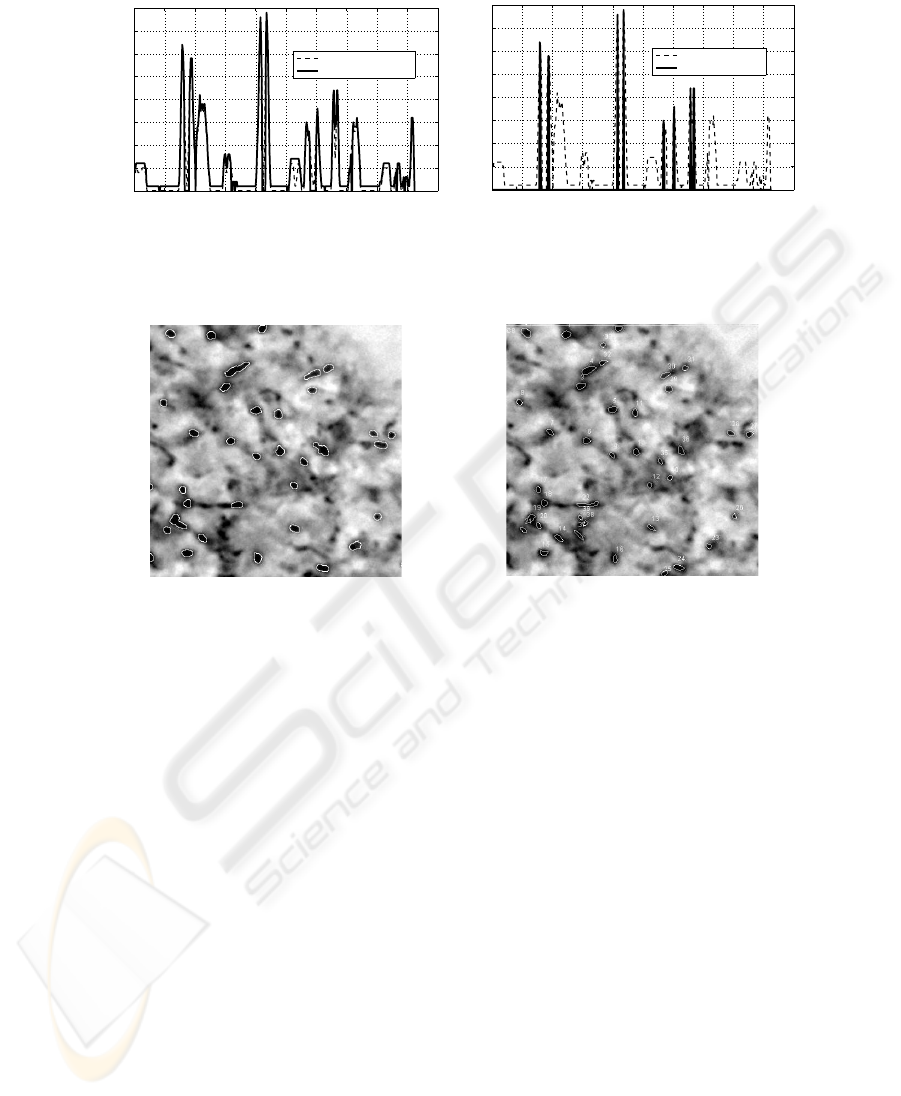
3 Experimental Check of Proposed Method
The initial image with white color marked object boundaries, revealed during the pro-
posed method application, is presented at Fig. 15. Figure 16 depicts manually extracted
objects for the same image.
With the aid of the developed method ten striatum frontal section images (five be-
long to experimental group and five – to control group) were analyzed. Main subtasks of
this analysis were the following: automated and manual extracted objects comparison;
terminal features calculation; experimental and control groups differences detection.
Following data was found for each image and for each group of images: 1. selected
36
0 50 100 150 200 250 300 350 400 450 500
0
5
10
15
20
25
30
35
40
Y
Gray value
Morphological gradient
Transformed gradient
Fig.13. Modified gradient. Plot of intensity
function. X = 149.
0 50 100 150 200 250 300 350 400 450 500
0
5
10
15
20
25
30
35
40
Y
Gray value
Transformed gradient
Watersheds
Fig.14. Watersheds of modified gradient. Plot
of intensity function. X = 149.
Fig.15. Automatic extraction. Fig.16. Manual extraction.
objects’ numeric features (perimeter; area; minimum, mean and maximum of intensity
values; shape factor); 2. averaged numeric features; 3. results of hypothesistests to com-
pare the distributions of feature values in manual and automated calculations; 4. corre-
lation analysis 5. explanatory material permitting manual and automated selected object
areas and mean gray values comparison: (a) plots for comparison and evaluation of area
distribution fractiles; (b) plots for comparison and evaluation of mean value distribution
fractiles; (c) plots of joint area and mean gray value distribution.
Table 1 contains means and standard deviations of terminal area and mean gray
value distributions, when different ways of object selection techniques are used. In this
table coincident objects are those, that were the same while extracting them manually
and automatically
Such a considerable difference in the mean area becomes clear if we take into ac-
count the fact that the human vision is not so perfect in detecting precise boundaries
of the objects and the fact that morphologists extract not all objects presented on an
image, but only those they believe to be in-focus terminals. Furthermore the manual
terminal extraction was done with computer mouse and it is not always possible to con-
trol hand and mouse movements totally. But, in spite of all written above the hypothesis
tests allow us to conclude that there is no reliable difference between area distribu-
37

Table 1. Area and mean gray value distribution average characteristics in “experiment” and “con-
trol”.
Average Estimation Area Mean gray value
characteristic method experiment control experiment control
Mean manual estimation 1.372 1.303 96.227 82.927
coincident objects 1.555 1.700 95.789 83.596
automated estimation 1.749 1.731 100.677 88.614
Standard manual estimation 0.692 0.520 9.928 10.766
deviation coincident objects 0.562 0.695 10.982 11.569
automated estimation 0.694 0.705 12.245 14.705
tions in manual and automated estimation. The results also were satisfactory for PD
experts. Concerning a little difference in manually estimated area it can be guessed that
the method extracts more essential objects. Hypothesis tests on area distributions give
the following results: there is no reliable difference between control and experimental
groups in manual estimation and there is such a difference in automated estimation.
The number of objects extracted manually and automatically on the initial image
fragment and automatically on the whole image are given in Tab. 2, where in image
names “c” stands for control and “e” – for experiment.
Table 2. Terminals number.
Image 1–c 2–e 3–c 4–e 5–c 6–e 7–c 8–e 9–c 10–e
Automatic segmentation (whole) 1664 900 1623 891 1423 917 1632 899 1980 1002
Manual extraction (fragment) 40 11 29 20 36 14 35 11 33 12
Automatic segmentation (fragment) 36 16 34 20 35 15 43 12 34 13
4 Conclusions
Experimental investigations confirmed the possibility and the suitability of immunos-
tained striatum frontal section images automated processing and analysis by means of
developed method and with the aim to define characteristics, which are essential for
preclinical stage PD model construction. The designed method for automatic extraction
and feature calculation of dopaminergic neurons terminals on section images is also
established to allow obtaining the results with precision comparable those of manual
object feature estimation. The same methods can be developed for similar problems
solving.
Experiments revealed following: 1) considerable decrease in terminal numbers of
DA-ergic axons in experimental group in comparison to terminal numbers in control
group;2) change in DA-ergic neuron functionalactivity after neurotoxinadministration.
The obtained results are the important stage of a condition of dopaminergic nigrostriatal
system estimation researches at developing PD. Hereafter it will allow of compensatory
mechanisms research.
38

In the future selected object clustering in an extended feature space is planned. It is
aimed to statement and solving a problem of automatically extracted objects assignment
to selected clusters.
References
1. Gurevich, I.B., Yashina, V.V., Koryabkina, I.V., Niemann, H., Salvetti, O.: Descriptive ap-
proach to medical image mining: An algorithmic scheme for analysis of cytological speci-
mens. Pattern Recognition and Image Analysis: Advances in Mathematical Theory and Ap-
plications 18 (2008) 542–562
2. Gurevich, I., Harazishvili, D., Jernova, I., et al.: Information technology for the morpholog-
ical analysis of the lymphoid cell nuclei. In: The 13th Scandinavian Conference on Image
Analysis. Volume 2749 of LNCS. (2003) 541–548
3. Albin, R.L., Young, A.B., Penney, J.B.: The functional anatomy of basal ganglia disorders.
Trends Neurosci 12 (1989) 366–75
4. Tipton, K.F., Singer, T.P.: Advances in our understanding of the mechanisms of the neurotox-
icity of mptp and related compounds. J Neurochem 61 (1993) 1191–1206
5. Vincent, L.: Morphological grayscale reconstruction in image analysis: Applications and ef-
ficient algorithms. IEEE Transactions on Image Processing 2 (1993) 176–201
6. Soille, P.: Morphological Image Analysis: Principles and Applications. Springer, Berlin
(2004)
7. Wu, Q., Merchant, F., Castleman, K.: MICROSCOPE IMAGE PROCESSING. Elsevier Inc.
(2008)
8. Gonsales, R.C., Woods, R.E.: Digital Image Processing. 2 edn. Pearson Education, Inc (2002)
publishing as Prentice Hall.
9. Vincent, L., Soille, P.: Watersheds in digital spaces: an efficient algorithm based on immersion
simulations. IEEE Trans. Pattern Anal. Machine Intell. 6 (1991) 583–598
39
