
HOW TO VISUALISE ABSTRACT TOPICS IN
COMPUTER AND COMMUNICATION SCIENCE
Luděk Kučera
Dept. of Applied Mathematics, Faculty of Mathematics and Physics, Charles University
Malostranské nám. 25, Prague, Czech Republic
Keywords: Algorithm visualisation, Protocol visualisation, Algorithm animation, Program invariant, Mathematical
proof, Intuition, Algorithmic idea.
Abstract: The paper deals with learning of algorithms and protocols using visual media and it presents experience
obtained with a system Algovision developed at Charles University, Prague. The teaching of the paper is
that learning objects and courses should attempt explaining why an algorithm or protocol achieves its goals
rather than merely showing what is going on during the computation and/or communication and how the
data change in time. This means visualising abstract topics like algorithm invariant, mathematical proof,
researcher intuition, and a collection of paradigms used to achieve such task is presented, as it appeared
during development of Algovision.
1 INTRODUCTION
The paper deals with learning of algorithms and
protocols using visual media and it presents
experience obtained with Algovision, a system
developed at Charles University.
However, the main aim of the paper is to argue
that a proper way to creating systems that make
learning of algorithms and protocols easy and
efficient is based on showing why an algorithm or
protocol achieves its goal, and what is the idea
which is behind and which lead to discovery of the
algorithm or establishing a protocol, rather than
merely showing what is going on during the
computation and/or communication and how the
data change in time.
Most of the present learning systems and course
collections implement just the what and how
dimension. Even though such learning objects bring
all information that is necessary to learn how an
algorithm or protocol works, this information is
unstructured and hidden, and it is too difficult (if not
impossible) for a learner to infer the laws the objects
in the screen follow. This is why the present ways of
visualisation of algorithms and protocols are not as
successful in learning as we hoped ten or fifteen
years ago.
The experience we obtained when developing
and using Algovision is that incorporating the why
coordinate into interactive and/or dynamic visual
objects and courses is not a straightforward task that
can be described by a single paradigm or directive.
Building of why-learning objects turned out to be
very case specific, but we tried to prepare a list of
approaches that seem to be useful as general
methods of enhancing understandability of our
learning products.
There is another teaching that we get when
developing Algovision. The system was originally
conceived as a support of a teacher in the standard
classroom instruction, but it turned out that the best
presentations prepared for classroom teacher-
students applications are in the same time the best e-
learning objects and vice versa. Thus, it is not wise
distinguishing between teacher support and e-
learning and/or distant learning objects, because they
just represent two possible applications of the same
computer supported educational tools.
2 STATE OF THE ART
About two decades ago dynamic graphics became
available and started a boom of dynamic
visualisation systems aimed for learning of
algorithms and protocols, for an overview see
(Stasko et al., 1998), (Kerren, Stasko, 2002).
313
Ku
ˇ
cera L. (2009).
HOW TO VISUALISE ABSTRACT TOPICS IN COMPUTER AND COMMUNICATION SCIENCE.
In Proceedings of the First International Conference on Computer Supported Education, pages 313-317
DOI: 10.5220/0001980303130317
Copyright
c
SciTePress
Both algorithms and protocols operate on
abstract data and objects in such a way that change
the value of data and the status of objects by
following a fixed and predetermined set of
instructions and/or rules. Even though data and
objects are abstract, they are usually an abstraction
of real life entities, and therefore a quite intuitive
and natural way of visualisation of data and
manipulated objects usually exists and doesn't bring
any logical problems to users of a learning system.
A general philosophy of animation, which is the
main way in which a dynamic interactive visual
system is used to enhance learning of algorithms and
protocols, is to show how the visual data
representation changes to follow changes of the
processed data.
The idea of animation is so natural and simple,
that many researchers even try to build systems that
are able to create an animation of a given algorithm
or protocol automatically or using just simple
directives of a user.
However our great expectations have
materialized only partially and dynamic and
interactive visualisation is still much less used than
we would like to and we saw in our predictions in
early 90's. (Catrambone, Stasko, 1996),
(Hundhausen et al., 2002).
3 VISUALISATION OF "WHY"
3.1 Why We Visualise "why"
As already pointed above, most visualisations
deliver a large amount of information (where
information is understood in the sense of Shannon,
i.e., as the number of bits), but much less knowledge
(where knowledge is understood in the sense of
cognition theory). As an author's student said: "In
order to understand what is going on in the screen I'd
need to understand the algorithm that is animated" -
a poor view of an animation aimed in helping
students to learn the algorithm.
Such visualisations could only be used as
illustrations and exemplifications for those who have
already learnt the topic elsewhere, but not as tools
useful for learning directly. This explains certain
disappointment with a use of computer-supported
learning.
In the remaining part of the section, we will
discuss several methods to increase the "knowledge
density" of a teacher-supporting and/or e-learning
presentation by visualisation the underlying idea of a
computational and/or communicational method
rather than its external behaviour.
3.2 Changing View
There are many cases when a "natural" visualisation
hides the underlying rules and it is necessary to
switch to another view that makes inferring rules
easy. Such a change is often based on a major
discovery in the science. Let us give some examples
to illustrate the paradigm.
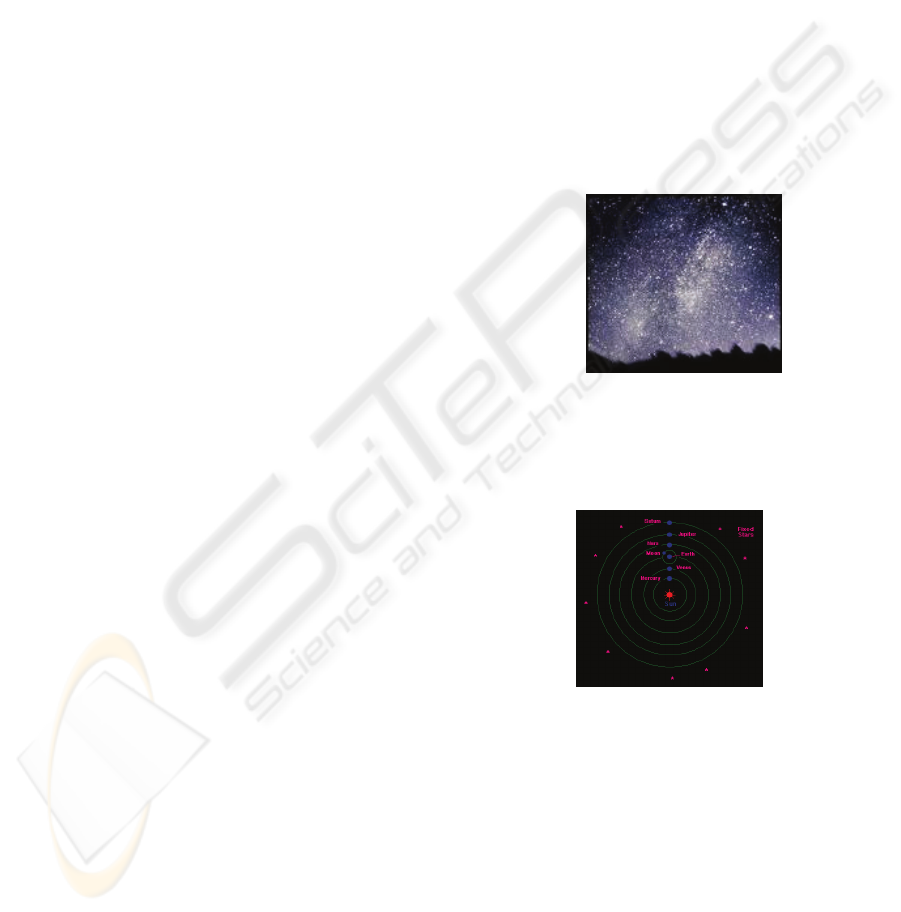
The first example is just a metaphor, but explains
well our approach. The night sky (Fig. 1A) is a
magnificent tool for visualizing planet trajectories.
Unfortunately, what we see looks so complex and
strange that this kind of visual presentation
practically prevents inferring any rule of planet
movements (mankind needed centuries to do it).
Figure 1A: Natural visualisation of planet trajectories.
The proper why-learning way of presenting the
subject is a drawing of the Kepler's model of the
solar system (Fig. 1B).
Figure 1B: Kepler's visualisation of planet trajectories.
An example from wireless communication is
formally very similar to the previous celestial
mechanic one. Code Division Multiple Access
(CDMA) is a method how several users of an
advanced cellular telephony system can share the
same communication channel. A standard way of
visual representation of signatures used in CDMA
uses time-amplitude plots; in this approach the users'
signals and their combination look as if they were
observed on a screen of a multi-channel
oscilloscope, which is the most natural visualisation
CSEDU 2009 - International Conference on Computer Supported Education
314
in electrical engineering. For illustration, see, e.g.,
http://www.vias.org/simulations/simusoft_dscdma.ht.ml.
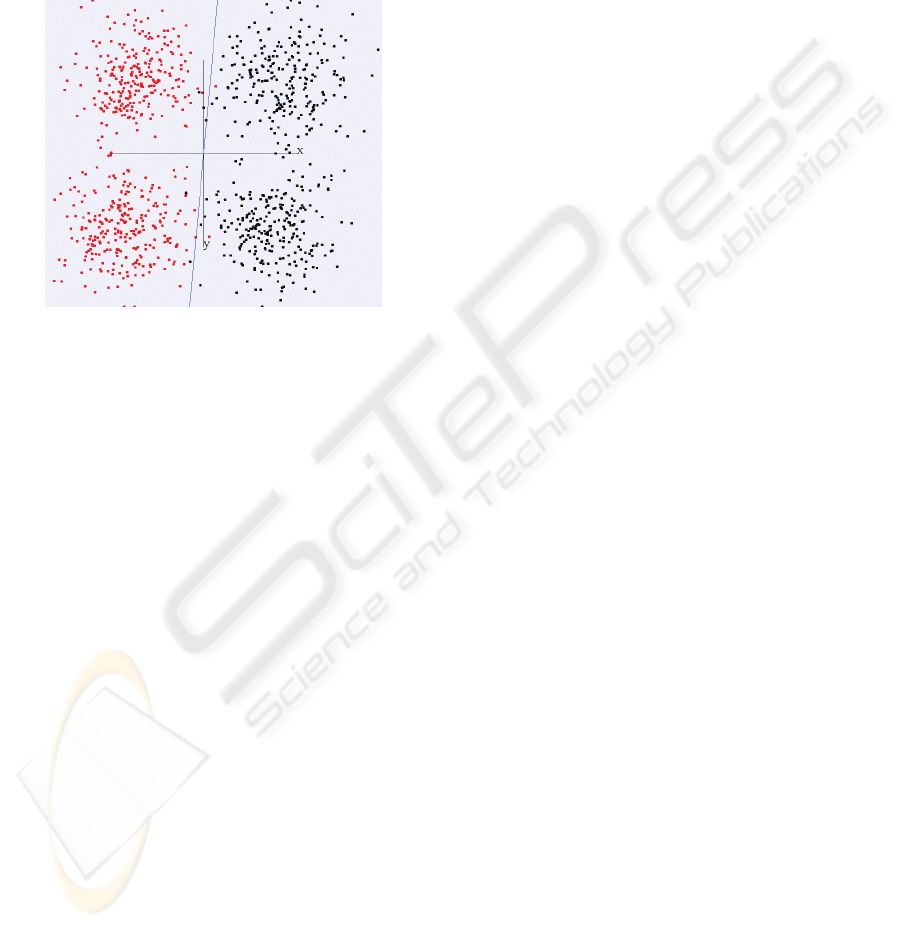
However, a model that parallelizes Kepler's
model of the preceding paragraph and explains
properties and protocols of CDMA in an easier way
views signatures as 0,1-vectors that form a (quasi)
orthogonal basis of an n-dimensional vector space
and combinations of users' bits are represented as
vectors in said space, see Fig. 2 for n=2.
Figure 2: CDMA signatures and signals in a two-user
noisy channel - a geometric intuition.
3.3 Program Invariants
There is a paradigm that proved to be very
successful for visualisation of algorithms in a way
that helps understanding the idea of the algorithm.
The paradigm comes from a field that is usually
called "software verification" if developed to solve
practical problems, or "theory of program
correctness", if studied as a theoretical discipline.
An invariant of a program or an algorithm is a
logical statement that represents a property of data
(program variables) that remains valid (i.e., is
invariant) during the whole computation and which,
together with termination condition, implies a
desired property of the output data (the result of a
computation).
Given an invariant, it is easy (but usually very
tedious) to prove that the output has always a desired
property (e.g., that a shortest path algorithm really
finds the shortest path).
Thus, the only problem when proving
correctness of a program with respect to a given
output property, is to find a proper invariant. This,
however, is an extremely difficult problem; it is even
proved that in general the problem of constructing
an invariant for a given program and a desired
output property is algorithmically insolvable.
The only known method of invariant
construction is a meta-rule: you must understand,
what a program is doing, and then write down all
relations between variable values that you could
imagine. In other words, understanding implies
ability to construct an invariant.
Fortunately, this rule can be inverted: an
invariant is usually a formal description of a strategy
that is followed to reach the desired goal, and who
knows an invariant also understands what is going
on during computation.
The examples of successful use of invariants in
visualization could be found in Algovision in the
section about shortest paths (algorithms of Dijkstra
and Bellman-Ford, see, e.g., Corman et al., 2001).
Since Dijkstra's shortest path algorithm is a part
of Algorithm course at most CS departments over
the world, many animations of the algorithm exist on
the web. However, to the author's best knowledge,
no one of them attempts to help a learner to see the
algorithmic idea that is behind. Thus, such
animations do not represent an independent learning
tool, being just an illustration for those who already
know the method.
In general, graph algorithms are typical examples
where an animation is useless as a learning tool
unless it displays in a proper way the algorithm
invariant.
3.4 Animated Constructions
In certain cases, both as a part of instruction in
computer hardware and software, an algorithm is
represented as a combination circuit, which can be
seen both as a layout of an asynchronous chip
without feedback and a logical scheme of a program
without loops.
A standard animation that can be found in the
web for many problems shows how data propagate
through the circuit from inputs to outputs.
Animating a circuit function is good, but much
better learning results can be obtained when using
(as it is in Algovision), two orthogonal animations.
The first one is the function animation mentioned
above; the other one shows in a step-by-step way
how the circuit is constructed.
An animation of construction begins by showing
the circuit as a single black box with inputs and
outputs, but without any internal structure displayed.
The animation continues by refining building
blocks in a way that illustrates well the logical
structure of a circuit. At each refinement stage a
circuit is fully functional, i.e., it is possible to
animate its function.
HOW TO VISUALISE ABSTRACT TOPICS IN COMPUTER AND COMMUNICATION SCIENCE
315
In Algovision the multi-animated approach is
used in a pure form in the course on Bitonic Sorting
(Batcher, 1990), and in a slightly modified way in a
course on Carry Look-Ahead binary adder.
3.5 Animated Proofs
In some cases it turned out to be difficult to integrate
directly explanation of the underlying idea or the
proof of correctness into animation. In such a case it
is necessary to demonstrate properties of a
computing method in a way that might be
formulated as a mathematical proof. Such a proof is
often a proof of the existence of certain object.
E.g., the correctness of a bitonic splitter follows
immediately from the existence of certain bisection
of the input sequence, and in Algovision, the
correctness proof can be viewed as a construction of
such bisection.
In this way, the essence of a mathematical proof
is often a construction algorithm, which can be
animated in the same way as any other algorithm,
the only difference being that it operates with
properly visualised abstract notions rather than with
objects that are more or less straightforward
generalization of real-world entities.
3.6 Visualised Intuition
The most general way of explaining the approach of
the present paper is the following: in order to
achieve a new discovery, a researcher is guided by
his or her intuition. It is difficult or perhaps
impossible to explain in more specific terms what is
an intuition, but creative researchers understand
surprisingly well the term.
Often, when speaking about their initial intuition,
researchers use visual terms and images, and it is
just sufficient to put such visual ideas to the screen.
We are sure that our present view of the solar
system was originally a vague intuition in Kepler's
head, and similar is the case with many other human
intellectual achievements.
One example, perhaps too simple to illustrate
well the idea of this subsection, but relatively easy
and short, is the Voronoi diagram in the plane and
how we can see it in a way that has proved to be
quite fruitful and which is used in Algovision.
Many facts about Voronoi diagrams, including
the background intuition for an important algorithm
that is included in Algovision (Fortune 1987), follow
directly from the following view of the situation, see
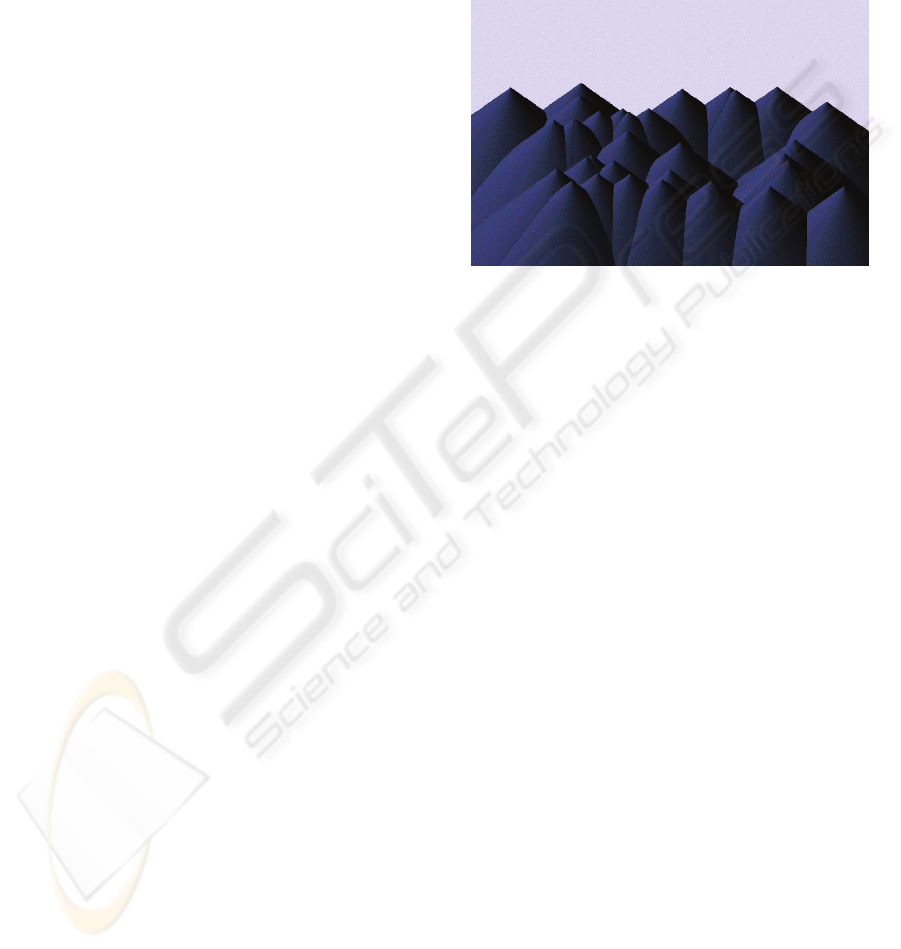
Fig. 4.
The plane containing the sites is viewed as a
horizontal plane embedded into the 3D space. Each
site is the top of a corresponding cone that has a
vertical axis. In such a way one obtains a mountain
range, which, viewed in vertical direction from
above looks exactly like the Voronoi diagram of the
sites (more precisely, visible intersections of cones,
projected to the site plane, give the diagram).
Figure 4: Voronoi diagram - cone mountains.
Although this intuition is again a folklore and
highly simplifies understanding certain Voronoi
diagram algorithms, it is not used in standard
learning courses, because it doesn't help too much if
displayed as a static figure similar to Fig. 4.
However, Algovision uses standard methods of
3D graphics (mouse controlled rotations, etc.) which
allows observing the mountains horizontally or
under a general angle to see how the mountains are
built, vertically to see the Voronoi diagram, and
under 45° to visualise original Fortune's intuition.
3.7 Virtual Tools, Devices and Gadgets
In certain cases it is very useful to build virtual tools
or devices that look and function like physically
existing or abstract measurement or visualising
devices. When playing with them, or using them to
solve given problems, a learner gets new knowledge
in a much more efficient way, compared to standard
and widely used learning procedures.
A typical example of the paradigm that appears
in Algovision is a Discrete Fourier Transform (DFT)
gadget. A learned draws a function in the upper
window (or selects a function from a predefined list
prepared to cover all interesting cases and features
of the problem) and the lower window shows the
corresponding Fourier spectrum.
CSEDU 2009 - International Conference on Computer Supported Education
316

Figure 5: Discrete Fourier Transform gadget.
However, the main use of the gadget in learning
DFT goes in the opposite direction. Given an input
function (drawn in black), a learner should find the
spectrum by himself or herself; a red function that
corresponds to the actual spectrum appears in the
upper window and should match the black one in all
sampling points represented by the vertical lines.
The device provides several levels of hints to
make this difficult task easier (e.g., sets the correct
value of certain spectrum item, or at least indicates
whether the present value is too small or large).
It takes typically several hours of hard work in a
trial-and-error style to find ways to match at least
roughly the black and the red functions, because the
correspondence between a digital signal and its
Fourier image is conceptually rather complex, but
learners find the task challenging and even funny
and eventually get surprisingly high level of
understanding of the essence of DFT.
3.8 Visual Hints
Visual presentations can quite often be enhanced by
visual hints. One source of such hints is a use of
colours when visualising algorithms and protocols
with temporal features. Any displayed object has
typically a particular status; it can be processed
and/or exhausted (dead), new, fresh, pending, active,
etc. In our cultural range such terms are associated
with colors (fresh=green, dead=black, attention or
stop=red, etc.).
Another kind of visual hints uses shapes or
forms. An example of a shape visual hint is used in
the Algovision implementation of AVL-tree course,
where balance of a node is shown using ideas of
Calder's mobiles.
4 CONCLUSIONS
We found that visual learning objects and courses
directed to algorithms and communication protocols
should be constructed to explain the underlying idea,
in other words, why it works in a presented way.
Doing so is more art than science or methodology,
but we listed several paradigms and approaches that
proved to be useful and give good results.
ACKNOWLEDGEMENTS
Work on Algovision was partially supported by
Czech Ministry of Education, Youth and Sports.
REFERENCES
Batcher, K., 1990. On bitonic sorting networks, ICPP 1,
pp. 376-379.
Cormen, T., Leiserson, C., Rivest, R., Stein, C., 2001.
Introduction to Algorithms, The MIT Press,
Cambridge, MA, 2
nd
edition.
Catrambone, R., Stasko, J., Do Algorithm Animations Aid
Lerning?, 1996. TR GIT-GVU96-18, Georgia Institute
of Technology.
Dijkstra, E.V., 1959. A note on two problems in
connection with graphs. In Numerische Mathematik, 1
(1959), pp. 269–271.
Fleischer, R., Kučera, L. 2001. Algorithm Animation for
Teaching. Software Visualization pp. 113-128
Fortune, R., Lopes, J., 1999. Paper templates. In
TEMPLATE’06, 1st International Conference on
Template Production. INSTICC Press.
Fortune, S., 1987. A sweepline algorithm for Voronoi
diagrams. Algorithmica 2, pp. 153-174.
Hundhausen, C., Douglas S., Stasko, J., 2002. A Meta-
Study of Algorithm Visualization Effectiveness, J. of
Visual Languages & Computing, 13, pp. 259-290.
Kerren, A., Stasko, J., 2002. Software Visualization.
Springer-Verlag Berlin Heidelberg.
Kučera, L., 2005. Visualisation of algorithms, Int. J. of
Continuing Engineering Education and Life Long
Learning 15 (3-6) pp. 212 – 224
Kučera, L., Algovision, http://kam.mff.cuni.cz/~ludek
Stasko, J., Domingue, J., Brown, M., Price, B., 1998.
Software Visualization, The MIT Press, Cambridge,
MA.
HOW TO VISUALISE ABSTRACT TOPICS IN COMPUTER AND COMMUNICATION SCIENCE
317
